Lithuania Ball Valves Market (2026-2032) | Forecast, Revenue, Analysis, Trends, Segmentation, Value, Industry, Outlook, Companies, Share, Growth & Size
Market Forecast By Type (Trunnion-mounted, Floating, Rising Stem), By Material (Stainless Steel, Cast Iron, Alloy-based), By Industry (Oil & Gas, Energy & Power, Water & Wastewater) And Competitive Landscape
| Product Code: ETC5906703 | Publication Date: Nov 2023 | Updated Date: Apr 2026 | Product Type: Market Research Report | |
| Publisher: 6Wresearch | Author: Ravi Bhandari | No. of Pages: 60 | No. of Figures: 30 | No. of Tables: 5 |
Lithuania Ball Valves Market Size (2020-2030)
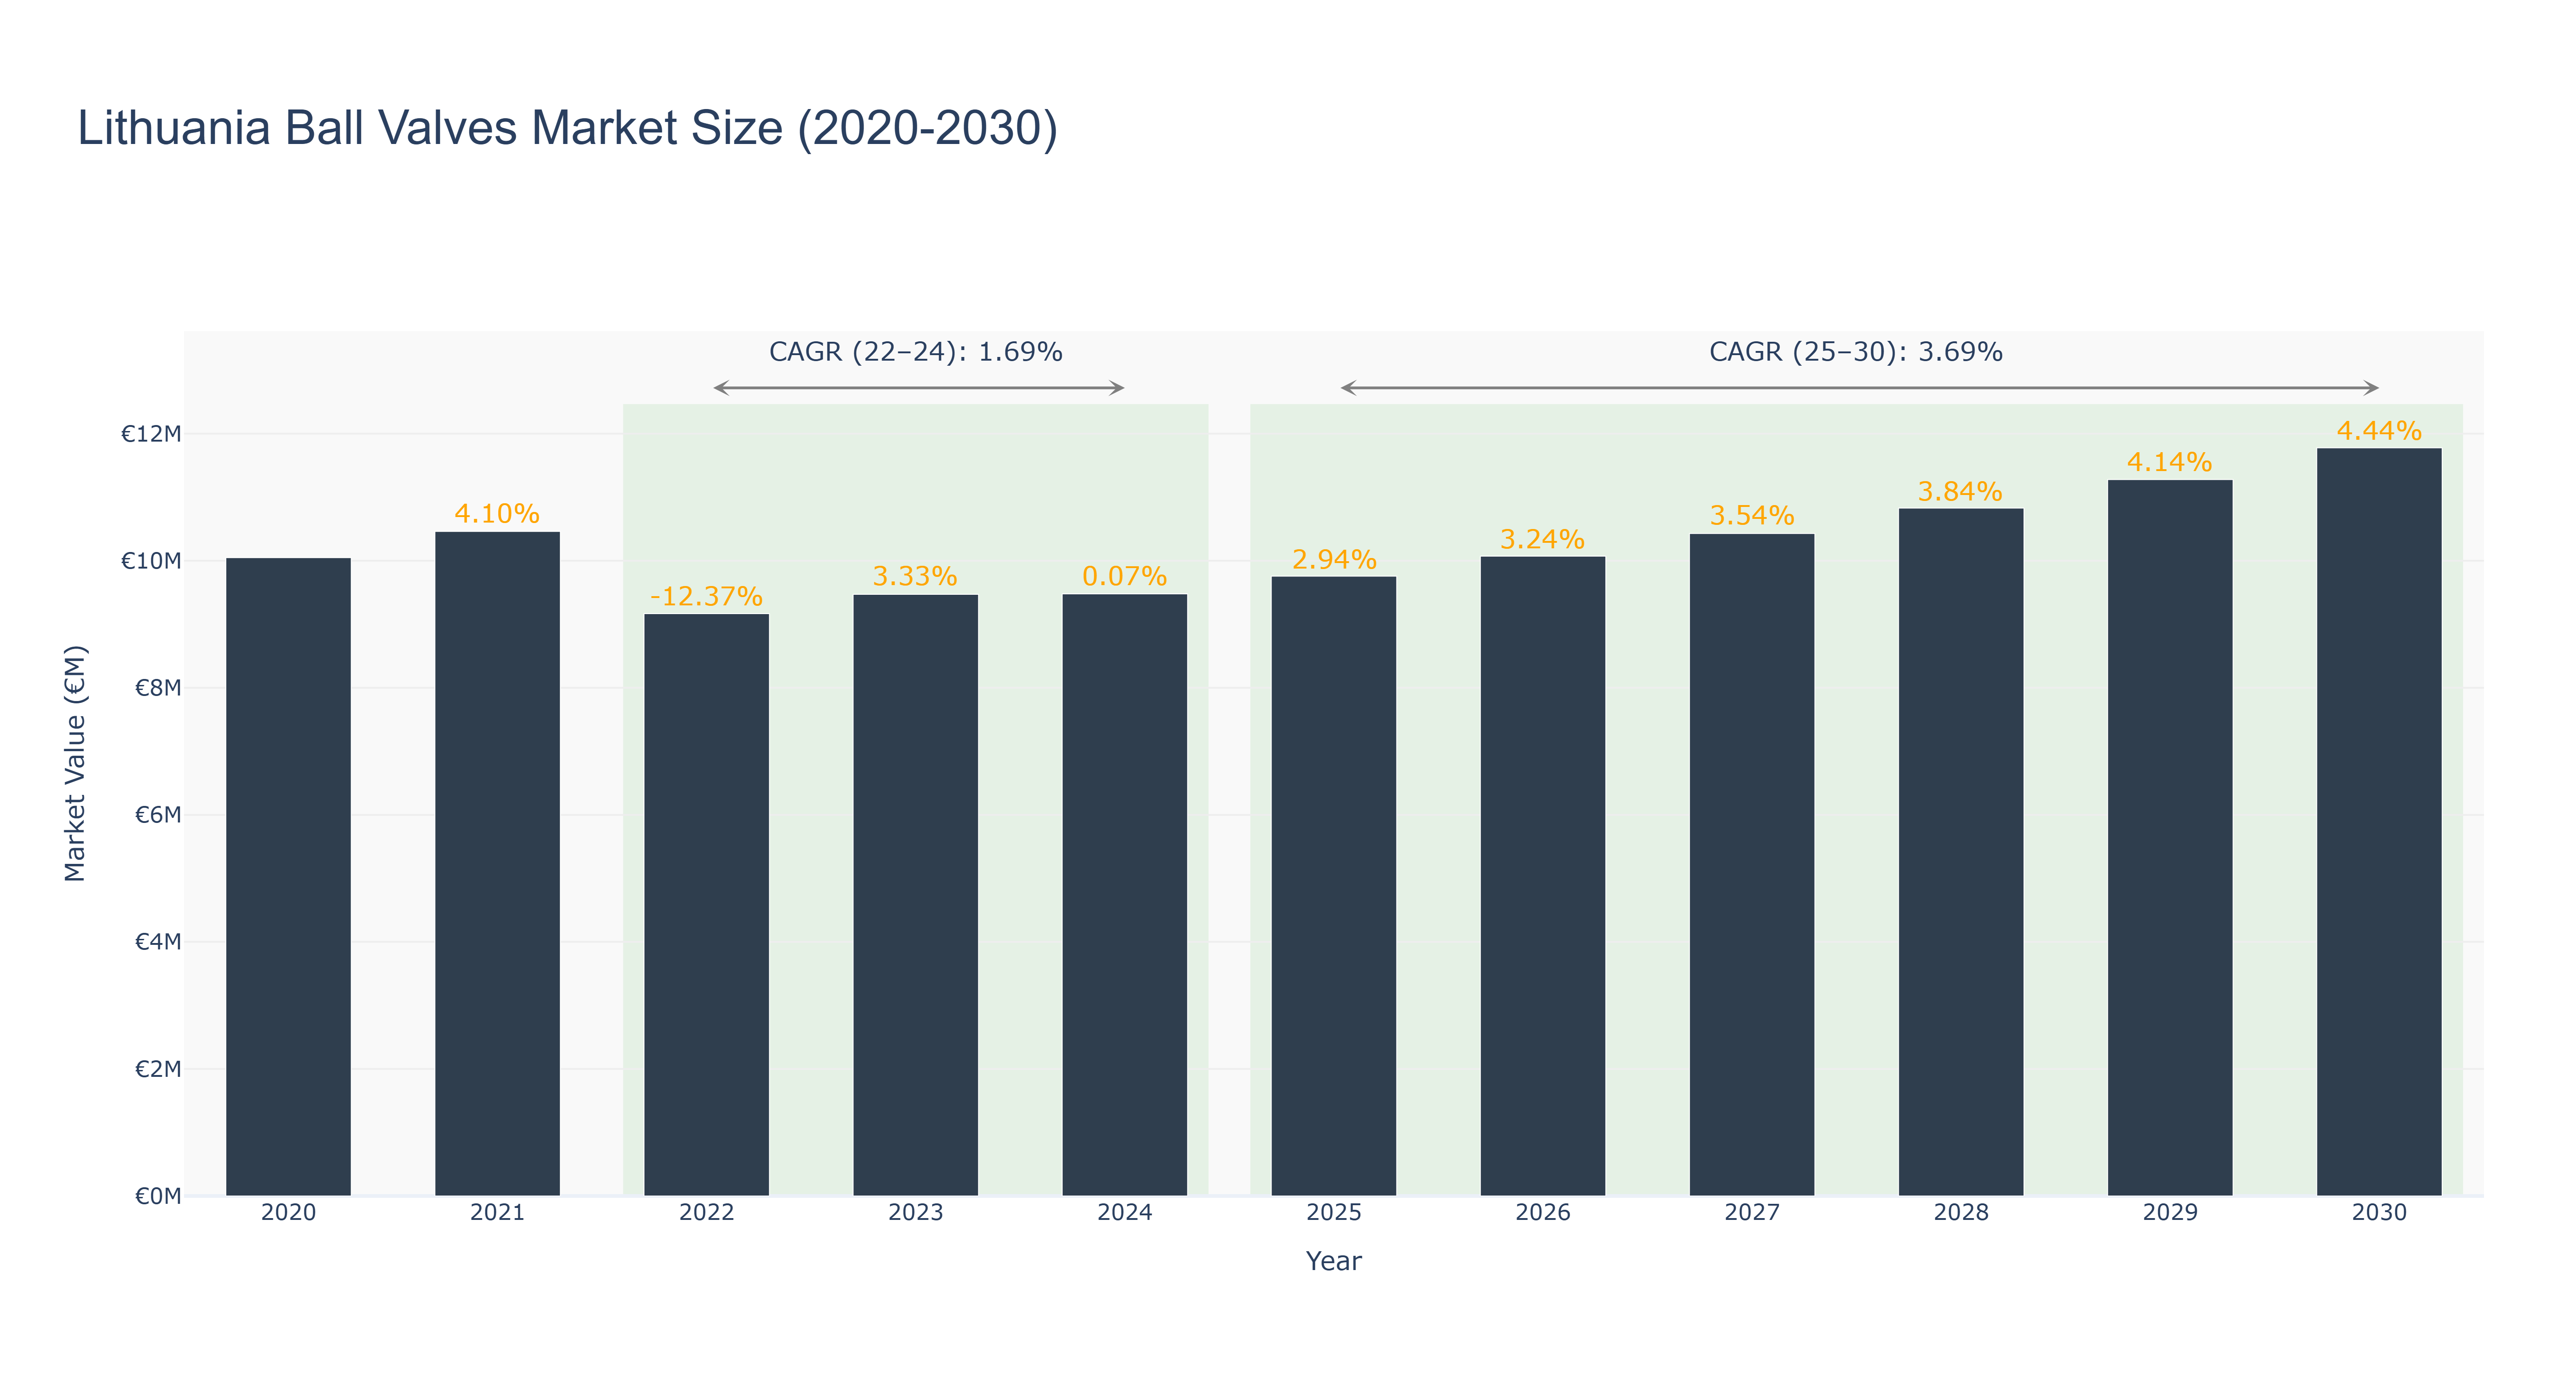
The Lithuania Ball Valves Market experienced a downward trend from 2020 to 2024, with the market size decreasing from €10.05 million in 2020 to €9.48 million in 2024. This decline can be attributed to various factors such as economic instability and fluctuations in demand. However, from 2025 to 2030, the market is forecasted to show steady growth, with a Compound Annual Growth Rate (CAGR) of 3.69%. The peak market size of €11.78 million is expected in 2030, indicating a positive trajectory for the market. Industry drivers such as increasing industrialization and infrastructure projects are likely to fuel this growth. Recent developments in Lithuania's manufacturing sector, particularly in the energy industry, are set to boost the demand for ball valves, further driving market expansion in the coming years.
Lithuania Ball Valves Market: Production & Trade Performance (2019-2025)
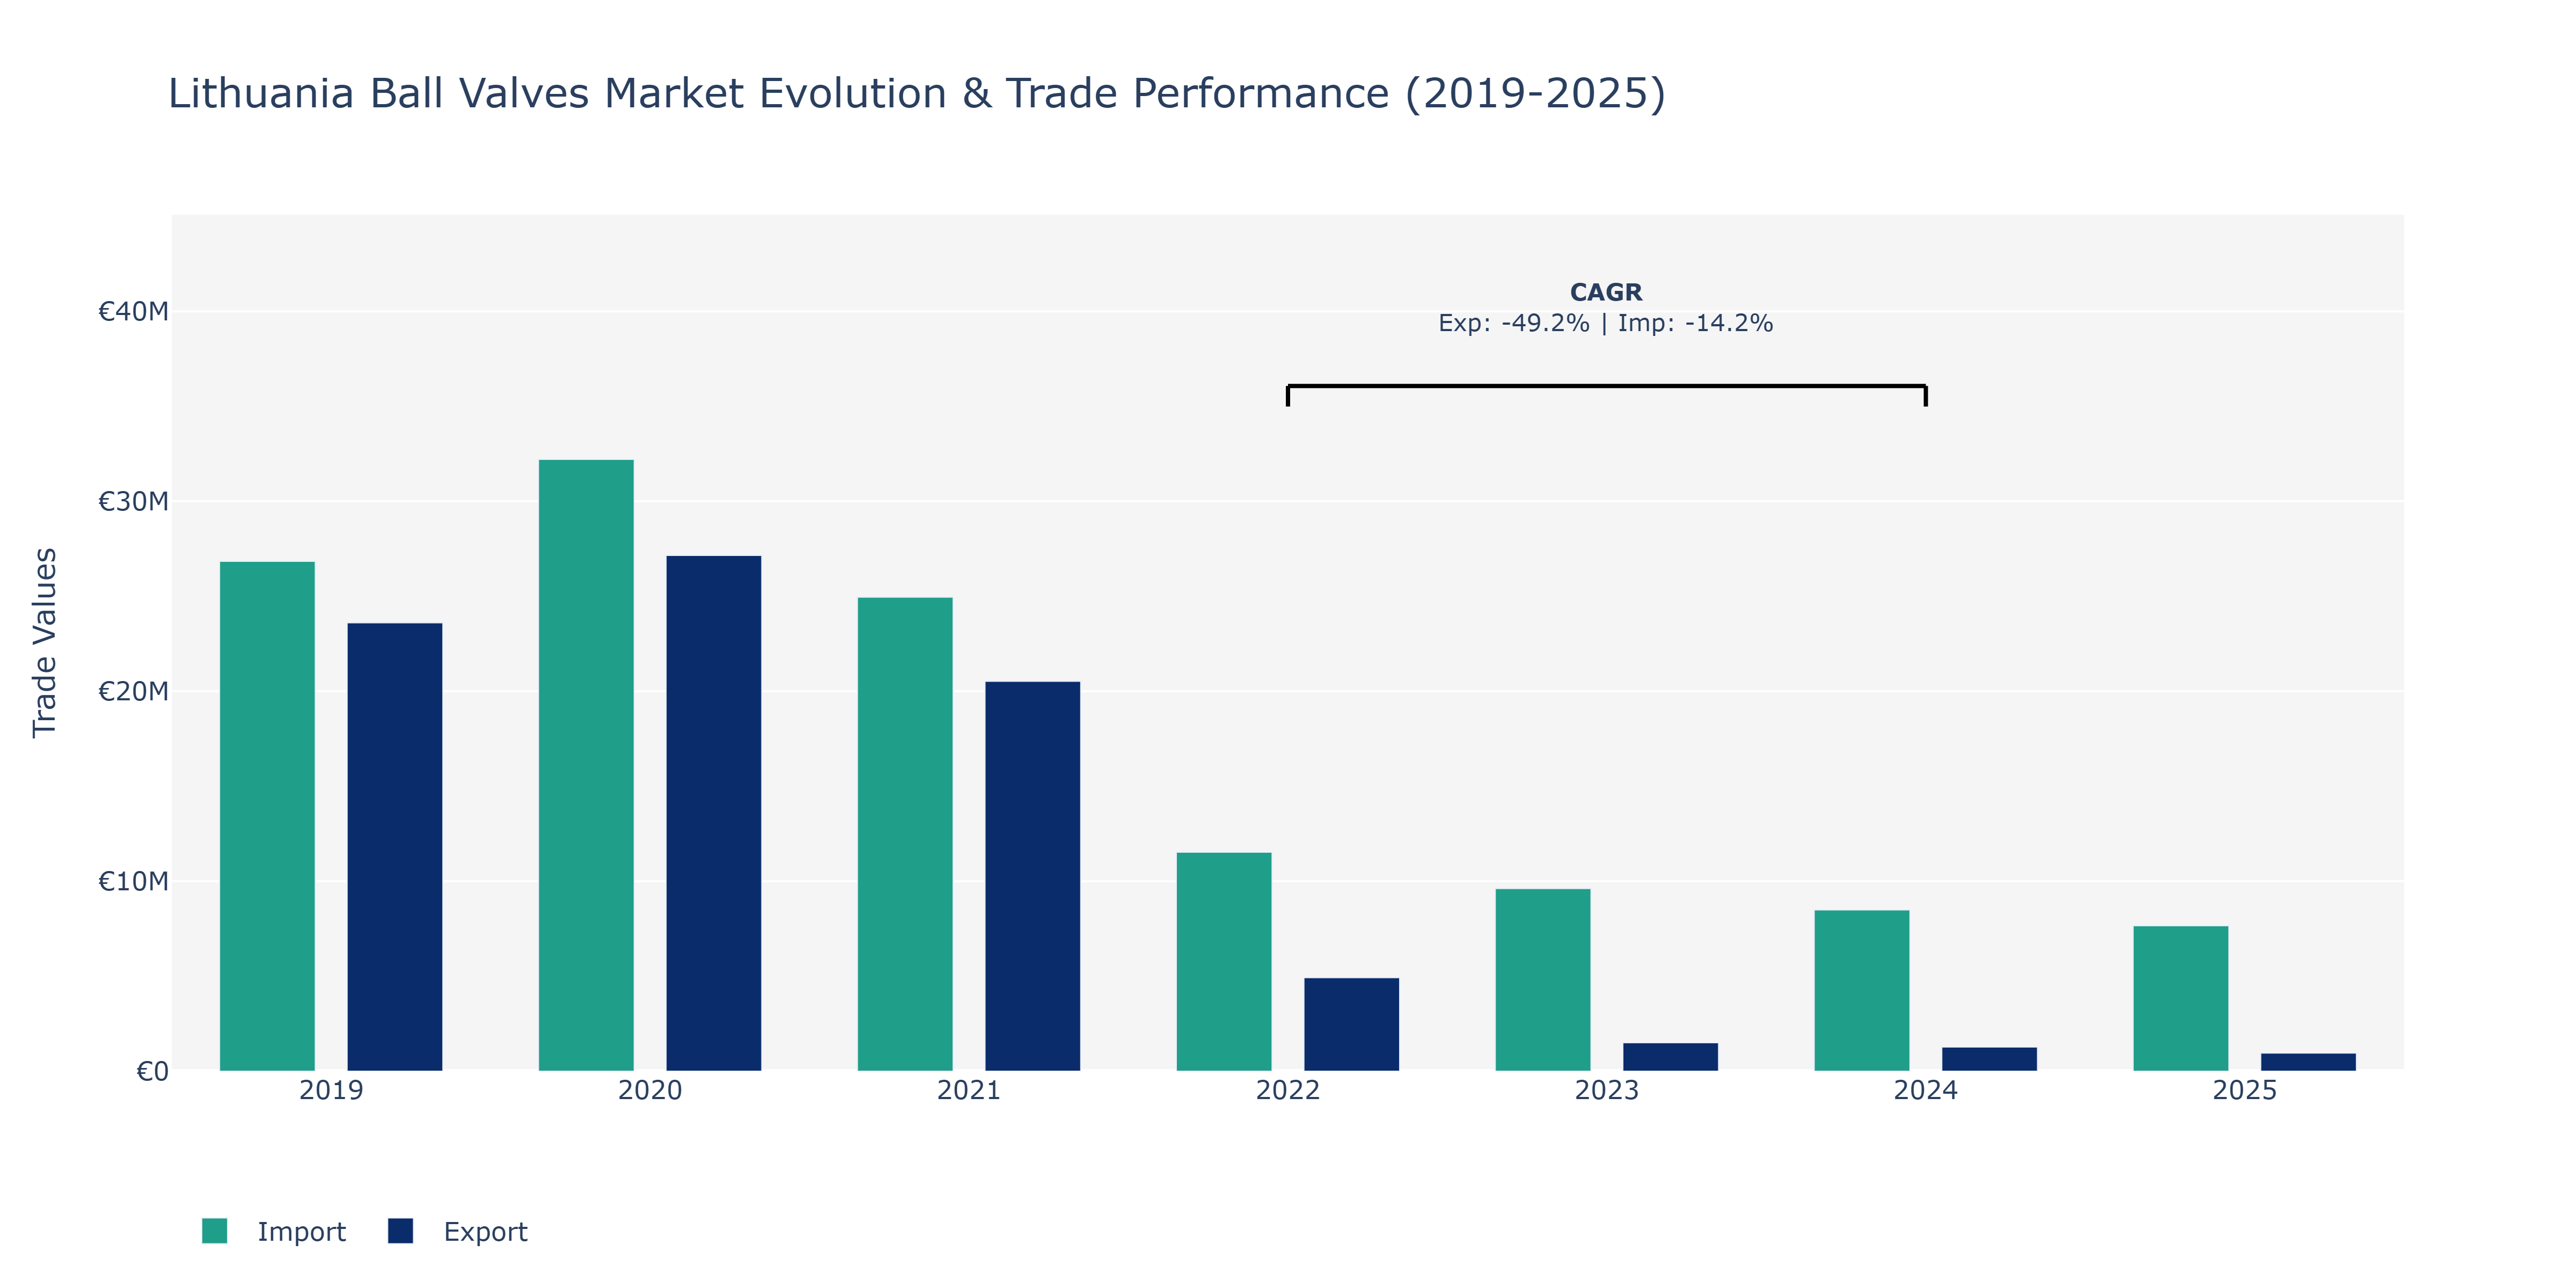
In the Lithuania Ball Valves Market, exports experienced a notable fluctuation over the years, starting at €23.61 million in 2019, increasing to €27.15 million in 2020, and then declining to around €20.52 million in 2021. The sharp decrease to €4.92 million in 2022 marked a significant shift, followed by a further decline to €1.5 million in 2023, and a relatively stable position at €1.27 million in 2024, with a slight decrease to approximately €953.5 thousand in 2025. On the other hand, imports followed a similar trend, with a peak in 2020 at €32.21 million before decreasing to approximately €24.96 million in 2021. Subsequently, imports dropped to around €11.53 million in 2022, €9.61 million in 2023, €8.49 million in 2024, and €7.65 million in 2025. These fluctuations can be attributed to various factors such as changing global demand for industrial valves, economic conditions impacting trade volumes, and possibly supply chain disruptions affecting the flow of goods in the market. It is crucial for market players to adapt to these shifts by enhancing efficiency in production, optimizing supply chains, and exploring new market opportunities to navigate the changing landscape effectively.
Key Highlights of the Report:
- Lithuania Ball Valves Market Outlook
- Market Size of Lithuania Ball Valves Market, 2025
- Forecast of Lithuania Ball Valves Market, 2032
- Historical Data and Forecast of Lithuania Ball Valves Revenues & Volume for the Period 2022 - 2032F
- Lithuania Ball Valves Market Trend Evolution
- Lithuania Ball Valves Market Drivers and Challenges
- Lithuania Ball Valves Price Trends
- Lithuania Ball Valves Porter`s Five Forces
- Lithuania Ball Valves Industry Life Cycle
- Historical Data and Forecast of Lithuania Ball Valves Market Revenues & Volume By Type for the Period 2022 - 2032F
- Historical Data and Forecast of Lithuania Ball Valves Market Revenues & Volume By Trunnion-mounted for the Period 2022 - 2032F
- Historical Data and Forecast of Lithuania Ball Valves Market Revenues & Volume By Floating for the Period 2022 - 2032F
- Historical Data and Forecast of Lithuania Ball Valves Market Revenues & Volume By Rising Stem for the Period 2022 - 2032F
- Historical Data and Forecast of Lithuania Ball Valves Market Revenues & Volume By Material for the Period 2022 - 2032F
- Historical Data and Forecast of Lithuania Ball Valves Market Revenues & Volume By Stainless Steel for the Period 2022 - 2032F
- Historical Data and Forecast of Lithuania Ball Valves Market Revenues & Volume By Cast Iron for the Period 2022 - 2032F
- Historical Data and Forecast of Lithuania Ball Valves Market Revenues & Volume By Alloy-based for the Period 2022 - 2032F
- Historical Data and Forecast of Lithuania Ball Valves Market Revenues & Volume By Industry for the Period 2022 - 2032F
- Historical Data and Forecast of Lithuania Ball Valves Market Revenues & Volume By Oil & Gas for the Period 2022 - 2032F
- Historical Data and Forecast of Lithuania Ball Valves Market Revenues & Volume By Energy & Power for the Period 2022 - 2032F
- Historical Data and Forecast of Lithuania Ball Valves Market Revenues & Volume By Water & Wastewater for the Period 2022 - 2032F
- Lithuania Ball Valves Import Export Trade Statistics
- Market Opportunity Assessment By Type
- Market Opportunity Assessment By Material
- Market Opportunity Assessment By Industry
- Lithuania Ball Valves Top Companies Market Share
- Lithuania Ball Valves Competitive Benchmarking By Technical and Operational Parameters
- Lithuania Ball Valves Company Profiles
- Lithuania Ball Valves Key Strategic Recommendations
Frequently Asked Questions About the Market Study (FAQs):
6Wresearch actively monitors the Lithuania Ball Valves Market and publishes its comprehensive annual report, highlighting emerging trends, growth drivers, revenue analysis, and forecast outlook. Our insights help businesses to make data-backed strategic decisions with ongoing market dynamics. Our analysts track relevent industries related to the Lithuania Ball Valves Market, allowing our clients with actionable intelligence and reliable forecasts tailored to emerging regional needs.
Yes, we provide customisation as per your requirements. To learn more, feel free to contact us on sales@6wresearch.com
1 Executive Summary |
2 Introduction |
2.1 Key Highlights of the Report |
2.2 Report Description |
2.3 Market Scope & Segmentation |
2.4 Research Methodology |
2.5 Assumptions |
3 Lithuania Ball Valves Market Overview |
3.1 Lithuania Country Macro Economic Indicators |
3.2 Lithuania Ball Valves Market Revenues & Volume, 2022 & 2032F |
3.3 Lithuania Ball Valves Market - Industry Life Cycle |
3.4 Lithuania Ball Valves Market - Porter's Five Forces |
3.5 Lithuania Ball Valves Market Revenues & Volume Share, By Type, 2022 & 2032F |
3.6 Lithuania Ball Valves Market Revenues & Volume Share, By Material, 2022 & 2032F |
3.7 Lithuania Ball Valves Market Revenues & Volume Share, By Industry, 2022 & 2032F |
4 Lithuania Ball Valves Market Dynamics |
4.1 Impact Analysis |
4.2 Market Drivers |
4.2.1 Increasing industrialization and infrastructure development in Lithuania |
4.2.2 Rising demand for energy and water utilities |
4.2.3 Growing focus on sustainability and environmental regulations |
4.3 Market Restraints |
4.3.1 Intense competition from global and regional players |
4.3.2 Fluctuations in raw material prices |
4.3.3 Regulatory challenges and compliance requirements |
5 Lithuania Ball Valves Market Trends |
6 Lithuania Ball Valves Market Segmentations |
6.1 Lithuania Ball Valves Market, By Type |
6.1.1 Overview and Analysis |
6.1.2 Lithuania Ball Valves Market Revenues & Volume, By Trunnion-mounted, 2022 - 2032F |
6.1.3 Lithuania Ball Valves Market Revenues & Volume, By Floating, 2022 - 2032F |
6.1.4 Lithuania Ball Valves Market Revenues & Volume, By Rising Stem, 2022 - 2032F |
6.2 Lithuania Ball Valves Market, By Material |
6.2.1 Overview and Analysis |
6.2.2 Lithuania Ball Valves Market Revenues & Volume, By Stainless Steel, 2022 - 2032F |
6.2.3 Lithuania Ball Valves Market Revenues & Volume, By Cast Iron, 2022 - 2032F |
6.2.4 Lithuania Ball Valves Market Revenues & Volume, By Alloy-based, 2022 - 2032F |
6.3 Lithuania Ball Valves Market, By Industry |
6.3.1 Overview and Analysis |
6.3.2 Lithuania Ball Valves Market Revenues & Volume, By Oil & Gas, 2022 - 2032F |
6.3.3 Lithuania Ball Valves Market Revenues & Volume, By Energy & Power, 2022 - 2032F |
6.3.4 Lithuania Ball Valves Market Revenues & Volume, By Water & Wastewater, 2022 - 2032F |
7 Lithuania Ball Valves Market Import-Export Trade Statistics |
7.1 Lithuania Ball Valves Market Export to Major Countries |
7.2 Lithuania Ball Valves Market Imports from Major Countries |
8 Lithuania Ball Valves Market Key Performance Indicators |
8.1 Number of new infrastructure projects in Lithuania |
8.2 Adoption rate of environmentally friendly ball valve technologies |
8.3 Percentage of market share held by domestic manufacturers |
8.4 Average lead time for ball valve delivery |
8.5 Customer satisfaction ratings for ball valve products and services |
9 Lithuania Ball Valves Market - Opportunity Assessment |
9.1 Lithuania Ball Valves Market Opportunity Assessment, By Type, 2022 & 2032F |
9.2 Lithuania Ball Valves Market Opportunity Assessment, By Material, 2022 & 2032F |
9.3 Lithuania Ball Valves Market Opportunity Assessment, By Industry, 2022 & 2032F |
10 Lithuania Ball Valves Market - Competitive Landscape |
10.1 Lithuania Ball Valves Market Revenue Share, By Companies, 2025 |
10.2 Lithuania Ball Valves Market Competitive Benchmarking, By Operating and Technical Parameters |
11 Company Profiles |
12 Recommendations | 13 Disclaimer |
Export potential assessment - trade Analytics for 2030
Export potential enables firms to identify high-growth global markets with greater confidence by combining advanced trade intelligence with a structured quantitative methodology. The framework analyzes emerging demand trends and country-level import patterns while integrating macroeconomic and trade datasets such as GDP and population forecasts, bilateral import–export flows, tariff structures, elasticity differentials between developed and developing economies, geographic distance, and import demand projections. Using weighted trade values from 2020–2024 as the base period to project country-to-country export potential for 2030, these inputs are operationalized through calculated drivers such as gravity model parameters, tariff impact factors, and projected GDP per-capita growth. Through an analysis of hidden potentials, demand hotspots, and market conditions that are most favorable to success, this method enables firms to focus on target countries, maximize returns, and global expansion with data, backed by accuracy.
By factoring in the projected importer demand gap that is currently unmet and could be potential opportunity, it identifies the potential for the Exporter (Country) among 190 countries, against the general trade analysis, which identifies the biggest importer or exporter.
To discover high-growth global markets and optimize your business strategy:
Click Here
Pricing
- Single User License$ 1,995
- Department License$ 2,400
- Site License$ 3,120
- Global License$ 3,795

Search
Thought Leadership and Analyst Meet


Our Clients
Latest Reports
- United Kingdom (UK) Outdoor Cooking Equipment Market (2026-2032) | Investment Opportunities, Outlook, Growth, Competition, Trends, Pricing, Demand, Insights, Challenges, Drivers, Size, Restraints, segmentation, Value, Share, Forecast, Companies, Analysis, Revenue, Strategy
- United Arab Emirates (UAE) Outdoor Cooking Equipment Market (2026-2032) | Challenges, Value, Restraints, Growth, Competition, Revenue, Trends, Outlook, Analysis, Drivers, Share, Investment Opportunities, Strategy, Demand, Companies, Forecast, Pricing, segmentation, Size, Insights
- Vietnam Outdoor Cooking Equipment Market (2026-2032) | Demand, Investment Opportunities, Growth, Pricing, Trends, Restraints, Competition, Outlook, Drivers, Strategy, Challenges, Revenue, Analysis, segmentation, Value, Size, Share, Insights, Companies, Forecast
- Venezuela Outdoor Cooking Equipment Market (2026-2032) | Challenges, Revenue, Demand, Value, Pricing, Strategy, Competition, Analysis, Companies, Insights, Growth, Outlook, Forecast, Size, Restraints, segmentation, Drivers, Trends, Investment Opportunities, Share
- Uganda Outdoor Cooking Equipment Market (2026-2032) | Drivers, Pricing, Challenges, Value, Growth, Companies, segmentation, Strategy, Analysis, Demand, Outlook, Size, Competition, Restraints, Revenue, Forecast, Investment Opportunities, Insights, Trends, Share
- Turkey Outdoor Cooking Equipment Market (2026-2032) | Size, Competition, Outlook, Strategy, Forecast, Drivers, Trends, Companies, Revenue, Growth, Analysis, segmentation, Insights, Pricing, Restraints, Demand, Investment Opportunities, Value, Share, Challenges
- Tunisia Outdoor Cooking Equipment Market (2026-2032) | Analysis, Share, Pricing, Trends, Size, Outlook, Revenue, segmentation, Demand, Insights, Investment Opportunities, Restraints, Growth, Forecast, Competition, Drivers, Challenges, Companies, Strategy, Value
- Thailand Outdoor Cooking Equipment Market (2026-2032) | Growth, Revenue, Insights, Companies, Drivers, Strategy, Forecast, Size, Analysis, segmentation, Trends, Challenges, Competition, Share, Investment Opportunities, Demand, Pricing, Value, Restraints, Outlook
- Tanzania Outdoor Cooking Equipment Market (2026-2032) | Share, Drivers, Forecast, Revenue, Growth, Outlook, Analysis, Investment Opportunities, Restraints, segmentation, Demand, Pricing, Size, Insights, Challenges, Competition, Companies, Value, Trends, Strategy
- Tajikistan Outdoor Cooking Equipment Market (2026-2032) | Value, Pricing, Companies, Share, Strategy, Revenue, Investment Opportunities, Demand, Forecast, Size, Competition, Challenges, Growth, Insights, Restraints, segmentation, Analysis, Trends, Drivers, Outlook
Industry Events and Analyst Meet

HIMTEX 2026

India Refining Summit 2026

India EV Show 2026

EV tech India Expo 2026

Auto Tech Asia 2026
Whitepaper
- Middle East & Africa Commercial Security Market Click here to view more.
- Middle East & Africa Fire Safety Systems & Equipment Market Click here to view more.
- GCC Drone Market Click here to view more.
- Middle East Lighting Fixture Market Click here to view more.
- GCC Physical & Perimeter Security Market Click here to view more.
6WResearch In News
- Doha a strategic location for EV manufacturing hub: IPA Qatar
- Demand for luxury TVs surging in the GCC, says Samsung
- Empowering Growth: The Thriving Journey of Bangladesh’s Cable Industry
- Demand for luxury TVs surging in the GCC, says Samsung
- Video call with a traditional healer? Once unthinkable, it’s now common in South Africa
- Intelligent Buildings To Smooth GCC’s Path To Net Zero