Lithuania Calcium Acetate Market (2026-2032) | Demand, Companies, Segments, Forecast, Growth, Size, Consumer Insights, Revenue, Restraints, Competition, Segmentation, Drivers, Share, Trends, Value, Strategic Insights, Outlook, Opportunities, Investment Trends, Industry, Challenges, Supply, Competitive, Strategy, Pricing Analysis, Analysis
Market Forecast By Product Type (Pharmaceutical Grade, Industrial Grade), By Application (Phosphate Binder, Food Additive), By End User (Healthcare, Food & Beverage), By Grade (High Purity, Standard Purity), By Form (Tablets, Powder) And Competitive Landscape
| Product Code: ETC11468538 | Publication Date: Apr 2025 | Updated Date: Apr 2026 | Product Type: Market Research Report | |
| Publisher: 6Wresearch | No. of Pages: 65 | No. of Figures: 34 | No. of Tables: 19 | |
Lithuania Calcium Acetate Market Size (2020-2030)
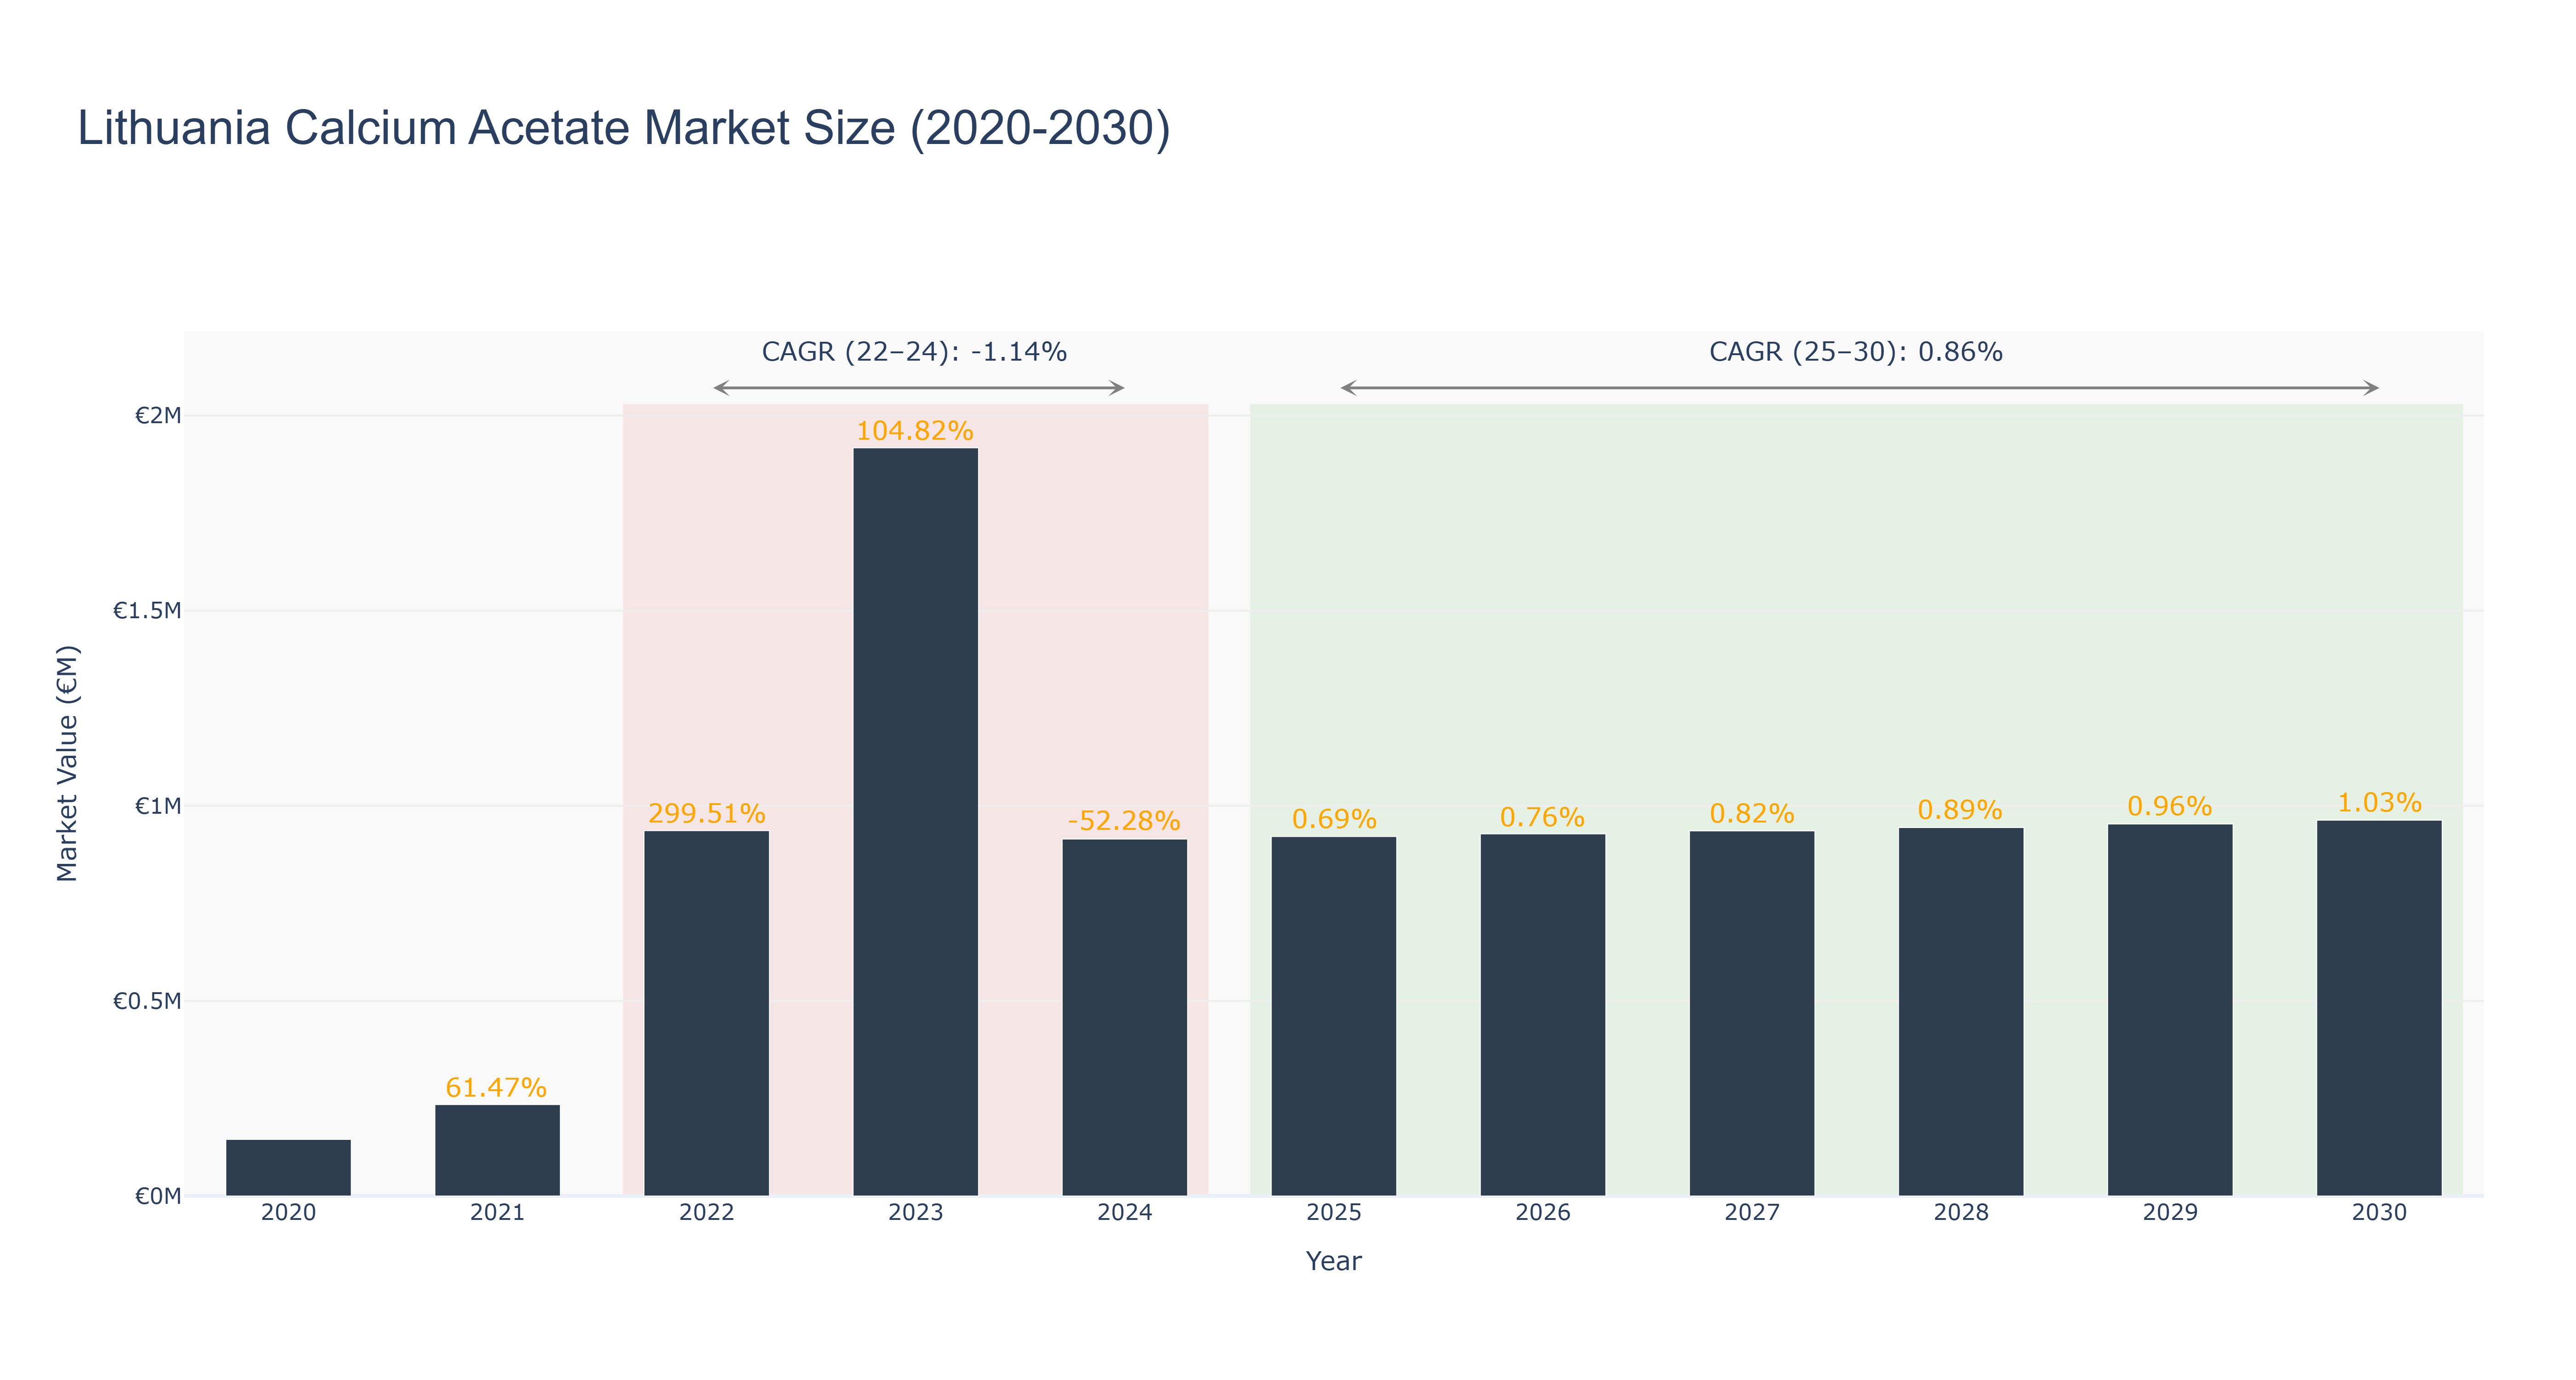
Lithuania Calcium Acetate Market has shown a fluctuating trend over the years. The peak market size was reached in 2023 at €1.92 million, followed by a significant decline in 2024 to €0.92 million. The market size has stabilized around €0.92-0.96 million from 2025 to 2030, with a slight upward trend. The CAGR for the period 2022-24 was -1.14%, attributed to market corrections and external factors affecting demand. Conversely, the CAGR for 2025-30 is projected at 0.86%, indicating a gradual recovery and growth potential. Industry drivers such as increasing demand for pharmaceutical applications and expanding research into calcium-based products are expected to support market stability and growth. Recent developments include partnerships with local pharmaceutical companies for product innovation, paving the way for enhanced market competitiveness in the near future.
Lithuania Calcium Acetate Market: Production & Trade Performance (2019-2025)
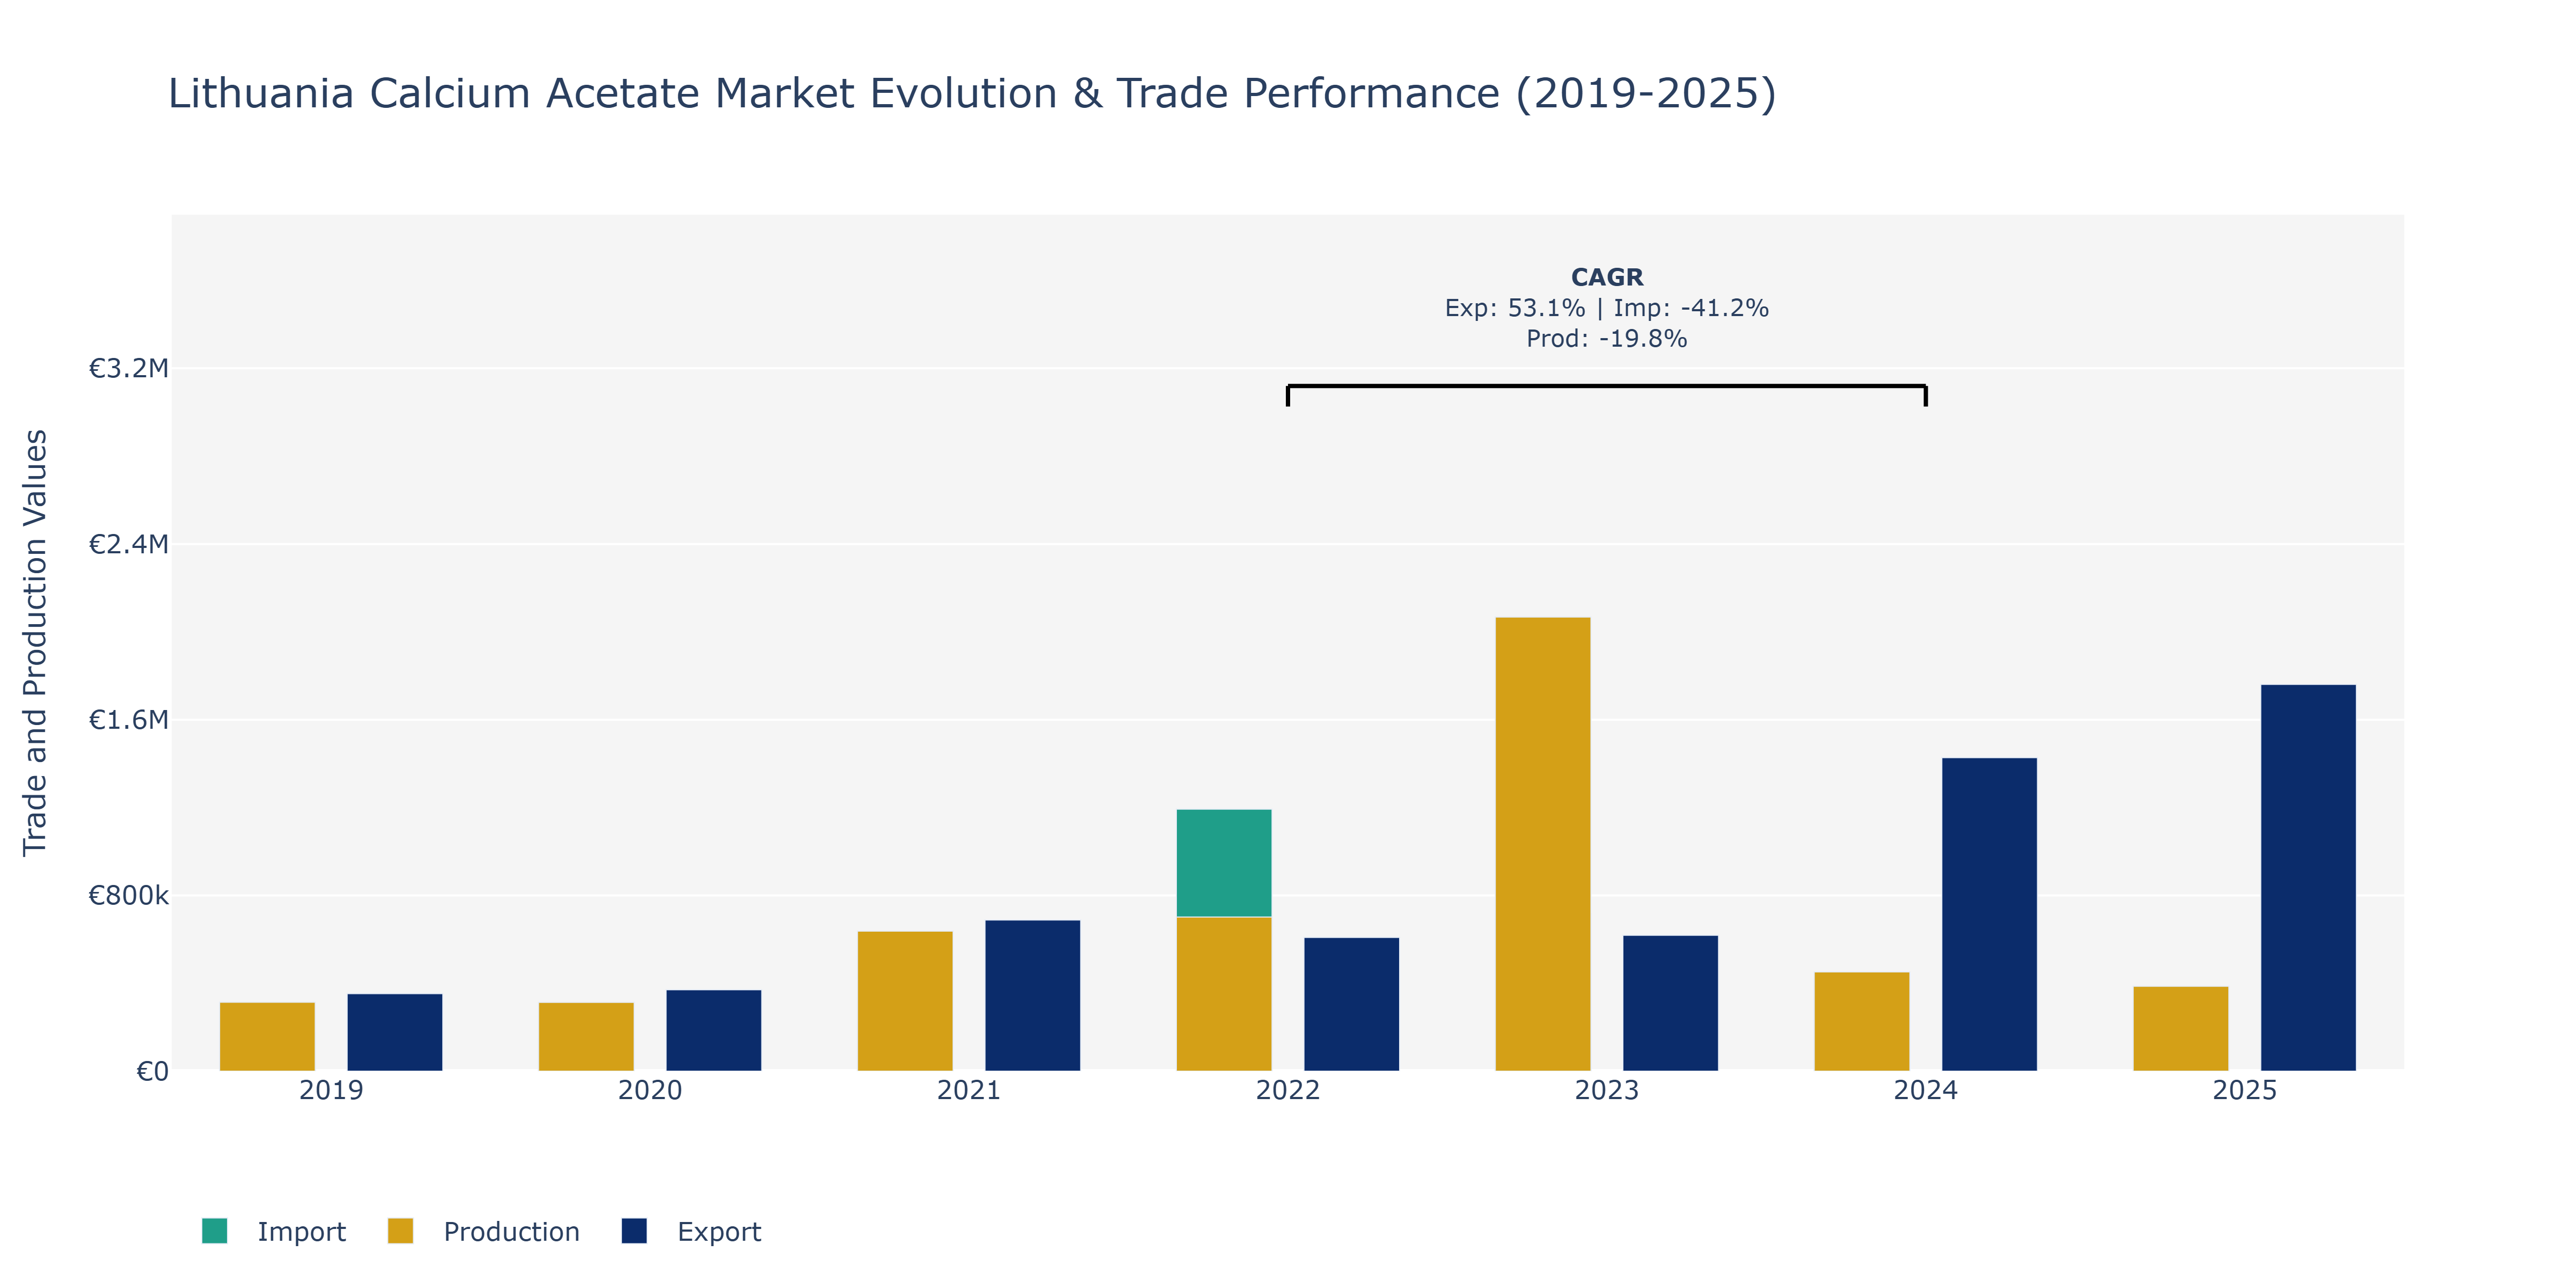
Between 2019 and 2025, Lithuania's Calcium Acetate market experienced various trends in Exports, Imports, and Production. Exports saw progressive growth, starting at €353.23 thousand in 2019, peaking at €1.76 million in 2025. This substantial increase can be attributed to the rising global demand for Calcium Acetate, driven by its applications in pharmaceuticals and food industries. In contrast, Imports fluctuated, with a high of €1.19 million in 2022 before declining to €310.08 thousand in 2025. This fluctuation may be influenced by shifts in trade agreements or changes in domestic production capacities. Production levels remained relatively stable, with a slight decrease from €638 thousand in 2021 to €386.56 thousand in 2025. This decline could be due to factors like production efficiency improvements or market saturation leading to optimized output levels. Overall, Lithuania's Calcium Acetate market shows resilience amid global market dynamics and evolving industry demands.
Key Highlights of the Report:
- Lithuania Calcium Acetate Market Outlook
- Market Size of Lithuania Calcium Acetate Market, 2025
- Forecast of Lithuania Calcium Acetate Market, 2032
- Historical Data and Forecast of Lithuania Calcium Acetate Revenues & Volume for the Period 2022 - 2032F
- Lithuania Calcium Acetate Market Trend Evolution
- Lithuania Calcium Acetate Market Drivers and Challenges
- Lithuania Calcium Acetate Price Trends
- Lithuania Calcium Acetate Porter's Five Forces
- Lithuania Calcium Acetate Industry Life Cycle
- Historical Data and Forecast of Lithuania Calcium Acetate Market Revenues & Volume By Product Type for the Period 2022 - 2032F
- Historical Data and Forecast of Lithuania Calcium Acetate Market Revenues & Volume By Pharmaceutical Grade for the Period 2022 - 2032F
- Historical Data and Forecast of Lithuania Calcium Acetate Market Revenues & Volume By Industrial Grade for the Period 2022 - 2032F
- Historical Data and Forecast of Lithuania Calcium Acetate Market Revenues & Volume By Application for the Period 2022 - 2032F
- Historical Data and Forecast of Lithuania Calcium Acetate Market Revenues & Volume By Phosphate Binder for the Period 2022 - 2032F
- Historical Data and Forecast of Lithuania Calcium Acetate Market Revenues & Volume By Food Additive for the Period 2022 - 2032F
- Historical Data and Forecast of Lithuania Calcium Acetate Market Revenues & Volume By End User for the Period 2022 - 2032F
- Historical Data and Forecast of Lithuania Calcium Acetate Market Revenues & Volume By Healthcare for the Period 2022 - 2032F
- Historical Data and Forecast of Lithuania Calcium Acetate Market Revenues & Volume By Food & Beverage for the Period 2022 - 2032F
- Historical Data and Forecast of Lithuania Calcium Acetate Market Revenues & Volume By Grade for the Period 2022 - 2032F
- Historical Data and Forecast of Lithuania Calcium Acetate Market Revenues & Volume By High Purity for the Period 2022 - 2032F
- Historical Data and Forecast of Lithuania Calcium Acetate Market Revenues & Volume By Standard Purity for the Period 2022 - 2032F
- Historical Data and Forecast of Lithuania Calcium Acetate Market Revenues & Volume By Form for the Period 2022 - 2032F
- Historical Data and Forecast of Lithuania Calcium Acetate Market Revenues & Volume By Tablets for the Period 2022 - 2032F
- Historical Data and Forecast of Lithuania Calcium Acetate Market Revenues & Volume By Powder for the Period 2022 - 2032F
- Lithuania Calcium Acetate Import Export Trade Statistics
- Market Opportunity Assessment By Product Type
- Market Opportunity Assessment By Application
- Market Opportunity Assessment By End User
- Market Opportunity Assessment By Grade
- Market Opportunity Assessment By Form
- Lithuania Calcium Acetate Top Companies Market Share
- Lithuania Calcium Acetate Competitive Benchmarking By Technical and Operational Parameters
- Lithuania Calcium Acetate Company Profiles
- Lithuania Calcium Acetate Key Strategic Recommendations
Frequently Asked Questions About the Market Study (FAQs):
6Wresearch actively monitors the Lithuania Calcium Acetate Market and publishes its comprehensive annual report, highlighting emerging trends, growth drivers, revenue analysis, and forecast outlook. Our insights help businesses to make data-backed strategic decisions with ongoing market dynamics. Our analysts track relevent industries related to the Lithuania Calcium Acetate Market, allowing our clients with actionable intelligence and reliable forecasts tailored to emerging regional needs.
Yes, we provide customisation as per your requirements. To learn more, feel free to contact us on sales@6wresearch.com
1 Executive Summary |
2 Introduction |
2.1 Key Highlights of the Report |
2.2 Report Description |
2.3 Market Scope & Segmentation |
2.4 Research Methodology |
2.5 Assumptions |
3 Lithuania Calcium Acetate Market Overview |
3.1 Lithuania Country Macro Economic Indicators |
3.2 Lithuania Calcium Acetate Market Revenues & Volume, 2022 & 2032F |
3.3 Lithuania Calcium Acetate Market - Industry Life Cycle |
3.4 Lithuania Calcium Acetate Market - Porter's Five Forces |
3.5 Lithuania Calcium Acetate Market Revenues & Volume Share, By Product Type, 2022 & 2032F |
3.6 Lithuania Calcium Acetate Market Revenues & Volume Share, By Application, 2022 & 2032F |
3.7 Lithuania Calcium Acetate Market Revenues & Volume Share, By End User, 2022 & 2032F |
3.8 Lithuania Calcium Acetate Market Revenues & Volume Share, By Grade, 2022 & 2032F |
3.9 Lithuania Calcium Acetate Market Revenues & Volume Share, By Form, 2022 & 2032F |
4 Lithuania Calcium Acetate Market Dynamics |
4.1 Impact Analysis |
4.2 Market Drivers |
4.3 Market Restraints |
5 Lithuania Calcium Acetate Market Trends |
6 Lithuania Calcium Acetate Market, By Types |
6.1 Lithuania Calcium Acetate Market, By Product Type |
6.1.1 Overview and Analysis |
6.1.2 Lithuania Calcium Acetate Market Revenues & Volume, By Product Type, 2022 - 2032F |
6.1.3 Lithuania Calcium Acetate Market Revenues & Volume, By Pharmaceutical Grade, 2022 - 2032F |
6.1.4 Lithuania Calcium Acetate Market Revenues & Volume, By Industrial Grade, 2022 - 2032F |
6.2 Lithuania Calcium Acetate Market, By Application |
6.2.1 Overview and Analysis |
6.2.2 Lithuania Calcium Acetate Market Revenues & Volume, By Phosphate Binder, 2022 - 2032F |
6.2.3 Lithuania Calcium Acetate Market Revenues & Volume, By Food Additive, 2022 - 2032F |
6.3 Lithuania Calcium Acetate Market, By End User |
6.3.1 Overview and Analysis |
6.3.2 Lithuania Calcium Acetate Market Revenues & Volume, By Healthcare, 2022 - 2032F |
6.3.3 Lithuania Calcium Acetate Market Revenues & Volume, By Food & Beverage, 2022 - 2032F |
6.4 Lithuania Calcium Acetate Market, By Grade |
6.4.1 Overview and Analysis |
6.4.2 Lithuania Calcium Acetate Market Revenues & Volume, By High Purity, 2022 - 2032F |
6.4.3 Lithuania Calcium Acetate Market Revenues & Volume, By Standard Purity, 2022 - 2032F |
6.5 Lithuania Calcium Acetate Market, By Form |
6.5.1 Overview and Analysis |
6.5.2 Lithuania Calcium Acetate Market Revenues & Volume, By Tablets, 2022 - 2032F |
6.5.3 Lithuania Calcium Acetate Market Revenues & Volume, By Powder, 2022 - 2032F |
7 Lithuania Calcium Acetate Market Import-Export Trade Statistics |
7.1 Lithuania Calcium Acetate Market Export to Major Countries |
7.2 Lithuania Calcium Acetate Market Imports from Major Countries |
8 Lithuania Calcium Acetate Market Key Performance Indicators |
9 Lithuania Calcium Acetate Market - Opportunity Assessment |
9.1 Lithuania Calcium Acetate Market Opportunity Assessment, By Product Type, 2022 & 2032F |
9.2 Lithuania Calcium Acetate Market Opportunity Assessment, By Application, 2022 & 2032F |
9.3 Lithuania Calcium Acetate Market Opportunity Assessment, By End User, 2022 & 2032F |
9.4 Lithuania Calcium Acetate Market Opportunity Assessment, By Grade, 2022 & 2032F |
9.5 Lithuania Calcium Acetate Market Opportunity Assessment, By Form, 2022 & 2032F |
10 Lithuania Calcium Acetate Market - Competitive Landscape |
10.1 Lithuania Calcium Acetate Market Revenue Share, By Companies, 2025 |
10.2 Lithuania Calcium Acetate Market Competitive Benchmarking, By Operating and Technical Parameters |
11 Company Profiles |
12 Recommendations |
13 Disclaimer |
Global Go To Market Strategy - 2030
Export potential enables firms to identify high-growth global markets with greater confidence by combining advanced trade intelligence with a structured quantitative methodology. The framework analyzes emerging demand trends and country-level import patterns while integrating macroeconomic and trade datasets such as GDP and population forecasts, bilateral import–export flows, tariff structures, elasticity differentials between developed and developing economies, geographic distance, and import demand projections. Using weighted trade values from 2020–2024 as the base period to project country-to-country export potential for 2030, these inputs are operationalized through calculated drivers such as gravity model parameters, tariff impact factors, and projected GDP per-capita growth. Through an analysis of hidden potentials, demand hotspots, and market conditions that are most favorable to success, this method enables firms to focus on target countries, maximize returns, and global expansion with data, backed by accuracy.
By factoring in the projected importer demand gap that is currently unmet and could be potential opportunity, it identifies the potential for the Exporter (Country) among 190 countries, against the general trade analysis, which identifies the biggest importer or exporter.
To discover high-growth global markets and optimize your business strategy:
Click Here
Pricing
- Single User License$ 1,995
- Department License$ 2,400
- Site License$ 3,120
- Global License$ 3,795

Leadership Perspectives from Industry Events
Search
Thought Leadership and Analyst Meet


Our Clients
6WResearch In News
- Doha a strategic location for EV manufacturing hub: IPA Qatar
- Demand for luxury TVs surging in the GCC, says Samsung
- Empowering Growth: The Thriving Journey of Bangladesh’s Cable Industry
- Demand for luxury TVs surging in the GCC, says Samsung
- Video call with a traditional healer? Once unthinkable, it’s now common in South Africa
- Intelligent Buildings To Smooth GCC’s Path To Net Zero
Latest Reports
- New Zealand Aseptic Manufacturing Market (2026-2032)
- Netherlands Aseptic Manufacturing Market (2026-2032)
- Nauru Aseptic Manufacturing Market (2026-2032)
- Namibia Aseptic Manufacturing Market (2026-2032)
- Mozambique Aseptic Manufacturing Market (2026-2032)
- Montenegro Aseptic Manufacturing Market (2026-2032)
- Mongolia Aseptic Manufacturing Market (2026-2032)
- Monaco Aseptic Manufacturing Market (2026-2032)
- Micronesia Aseptic Manufacturing Market (2026-2032)
- Mauritius Aseptic Manufacturing Market (2026-2032)
Industry Events and Analyst Meet

HIMTEX 2026

India Refining Summit 2026

India EV Show 2026

EV tech India Expo 2026

Auto Tech Asia 2026
Whitepaper
- Middle East & Africa Commercial Security Market Click here to view more.
- Middle East & Africa Fire Safety Systems & Equipment Market Click here to view more.
- GCC Drone Market Click here to view more.
- Middle East Lighting Fixture Market Click here to view more.
- GCC Physical & Perimeter Security Market Click here to view more.