Lithuania Citr Fiber Market (2025-2031) | Drivers, Supply, Size, Demand, Growth, Challenges, Analysis, Restraints, Industry, Share, Competition, Strategy, Investment Trends, Revenue, Pricing Analysis, Consumer Insights, Forecast, Segments, Trends, Outlook, Strategic Insights, Segmentation, Opportunities, Companies, Value, Competitive
Market Forecast By Type (Insoluble Fiber, Soluble Fiber), By Form (Powder, Granules, Others), By Application (Food & Beverages, Personal Care, Pharmaceuticals, Animal Feed, Others), By Function (Water Binder and Fat Replacer, Gelling Gums, Thickening Gums) And Competitive Landscape
| Product Code: ETC11645754 | Publication Date: Apr 2025 | Updated Date: Apr 2026 | Product Type: Market Research Report | |
| Publisher: 6Wresearch | Author: Bhawna Singh | No. of Pages: 65 | No. of Figures: 34 | No. of Tables: 19 |
Lithuania Citr Fiber Market Size (2020-2030)
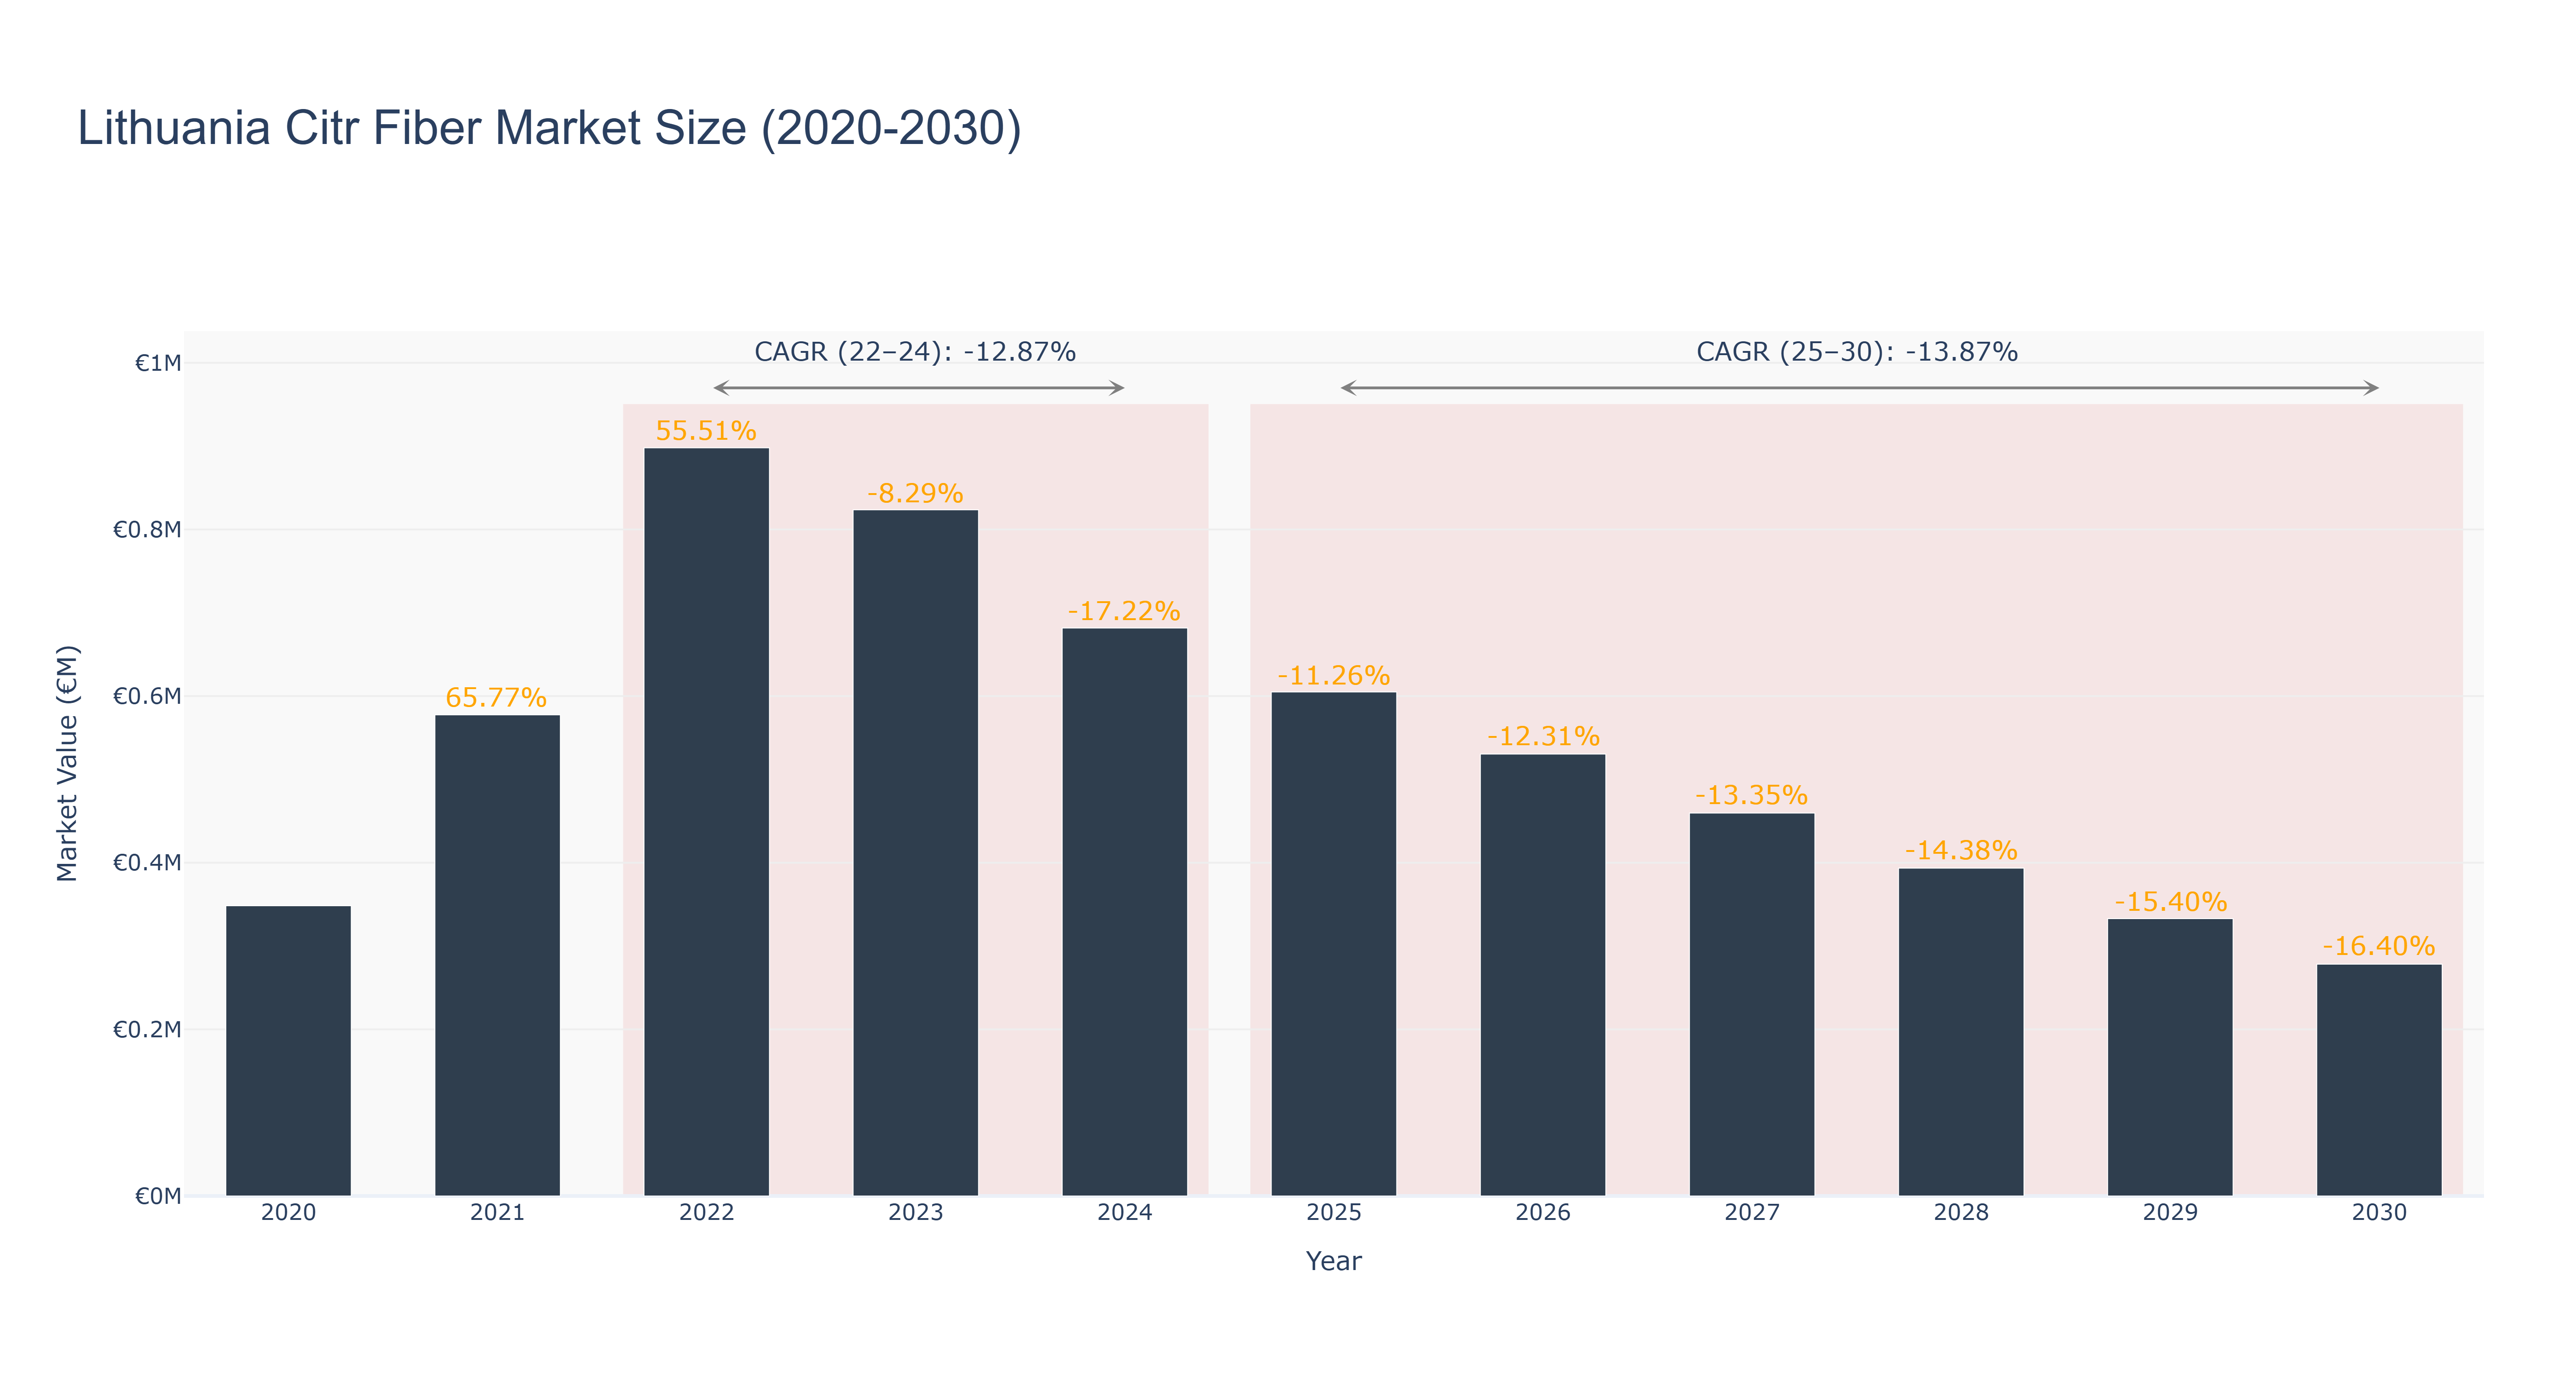
The Lithuania Citr Fiber Market experienced significant growth from 2020 to 2022, peaking at €898.07 thousand in 2022, with a remarkable CAGR of 55.51% in 2021 and an overall CAGR of -12.87% projected from 2022 to 2024. However, the market has faced a downturn, with actual values declining to €681.77 thousand in 2024. The forecast period from 2025 to 2030 anticipates a further contraction, with projected sizes decreasing from €605.01 thousand to €278.32 thousand, reflecting a CAGR of -13.87%. This decline may be attributed to saturation in consumer demand and increasing competition, coupled with potential economic challenges. While specific upcoming projects are not highlighted, the overall market landscape suggests a need for innovative product development and strategic marketing approaches to revive growth and adapt to evolving consumer preferences in the health food sector.
Lithuania Citr Fiber Market: Production & Trade Performance (2019-2025)
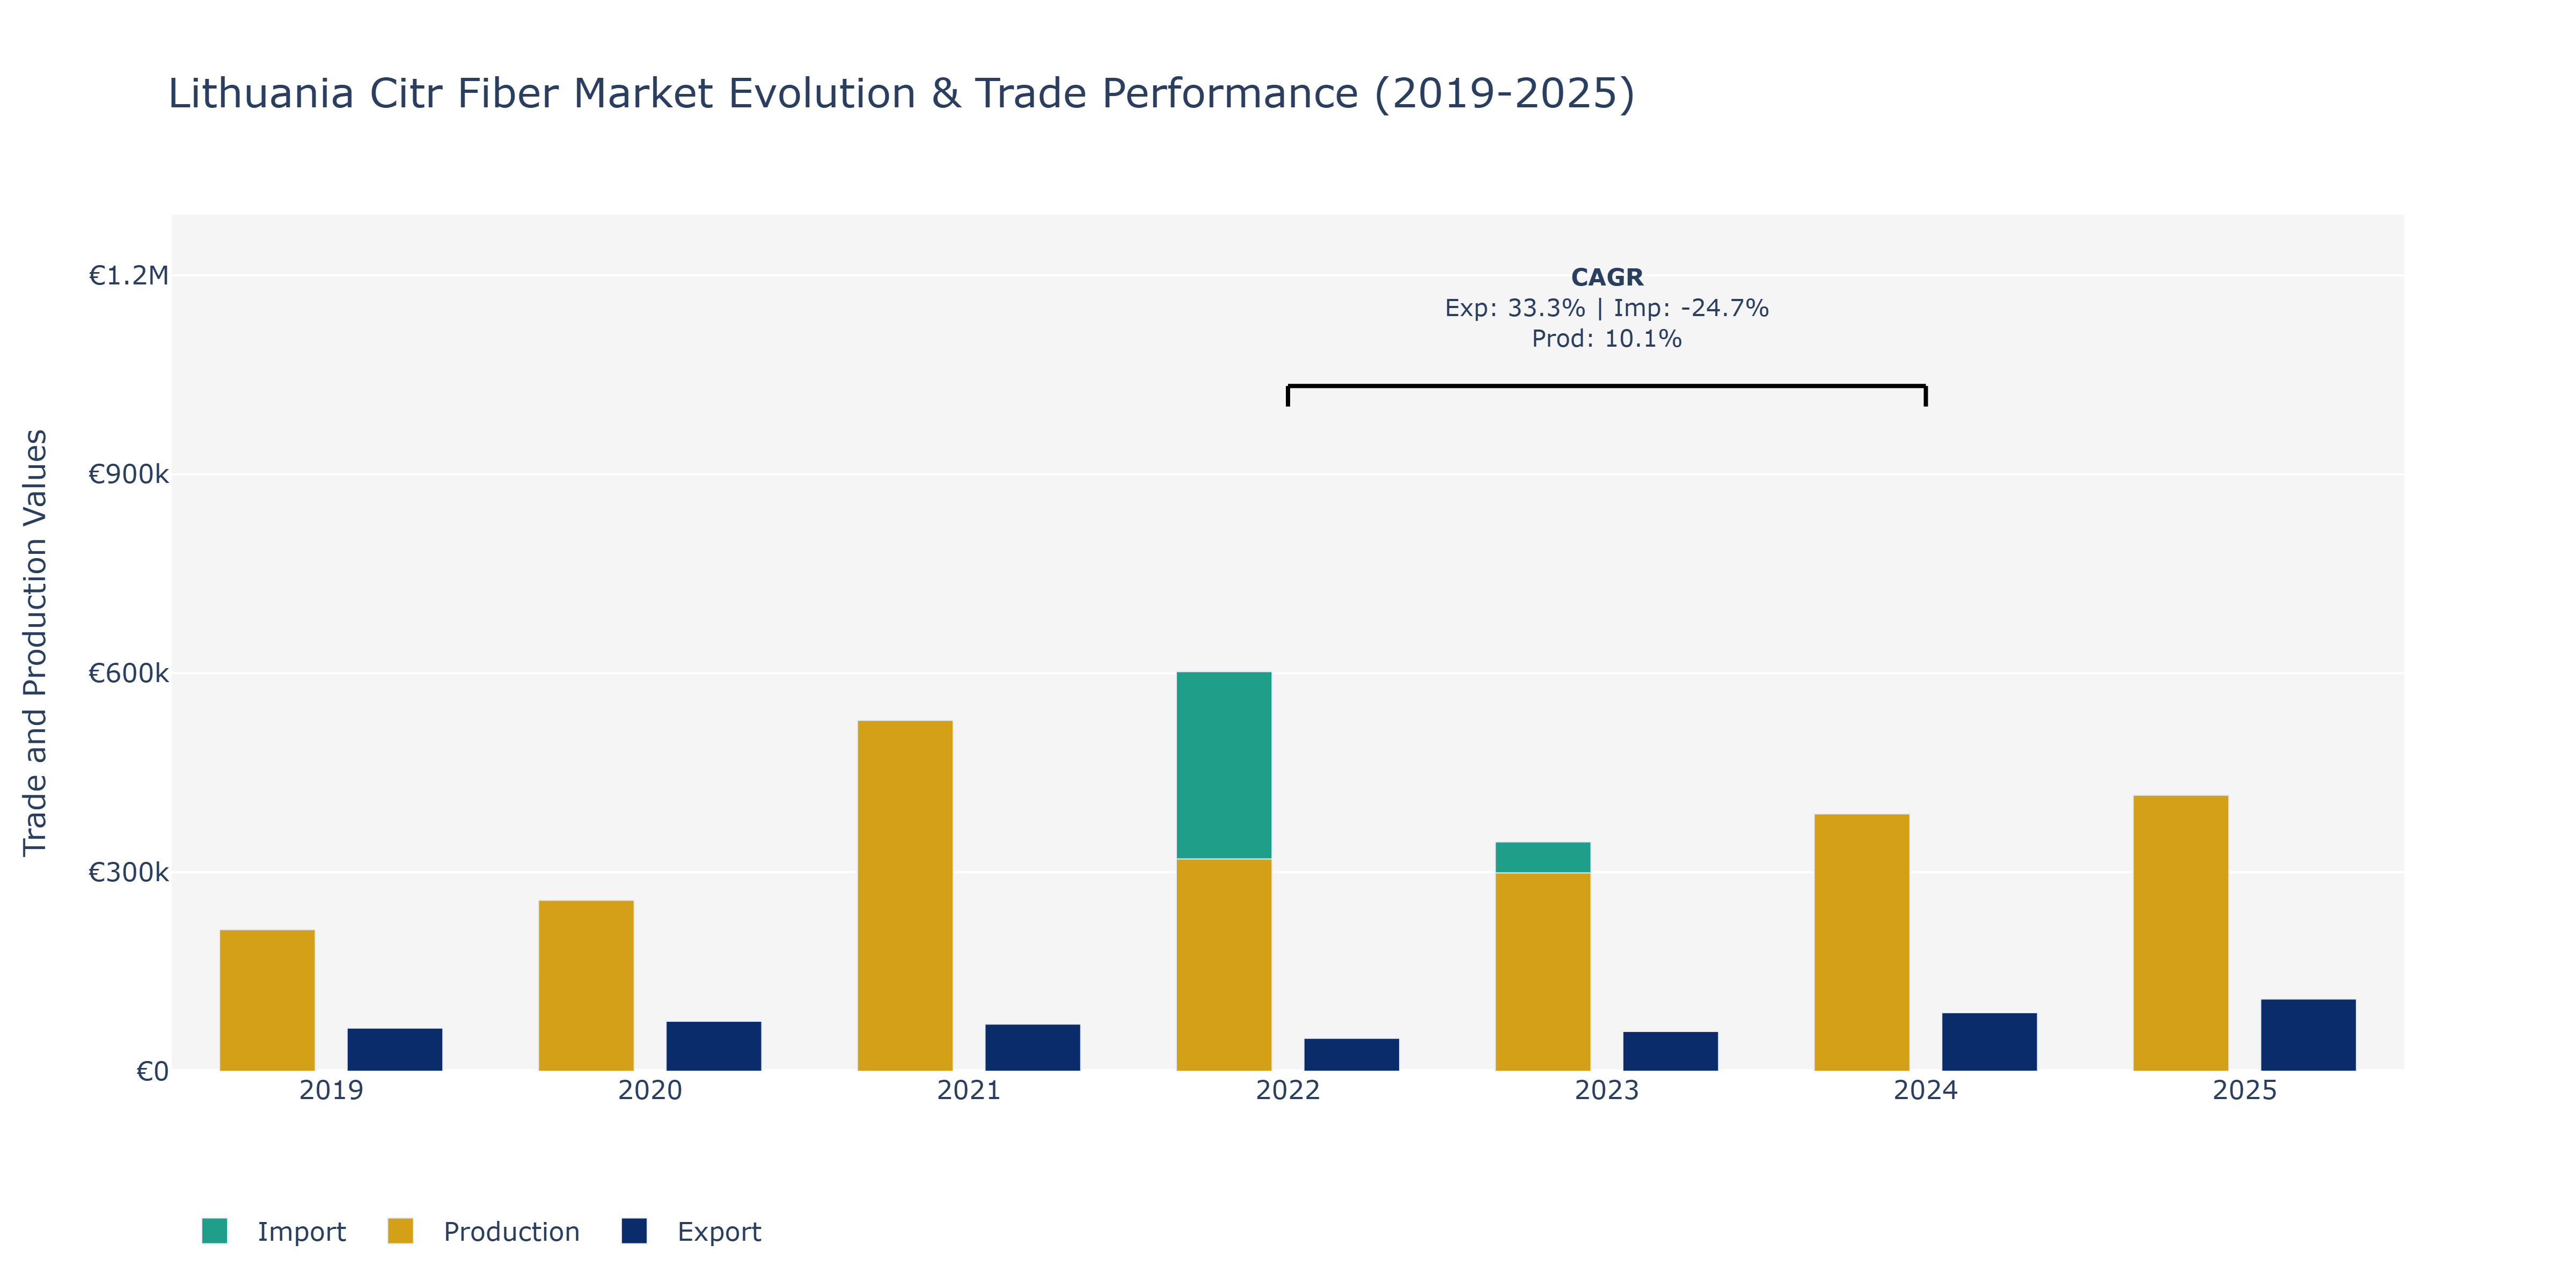
Between 2019 and 2025, Lithuania's Citr Fiber Market witnessed notable trends in exports, imports, and production. Exports started at €64.92 thousand in 2019, showing a consistent growth trend and reaching €108.85 thousand in 2025, indicating an overall upward trajectory. In contrast, imports were highest at €602.37 thousand in 2022, then experienced a decline to €269.24 thousand in 2025, reflecting fluctuating demand or shifts in global supply chains. Production, starting at €213.36 thousand in 2019, saw a steady increase, peaking at €529.00 thousand in 2021 before stabilizing around €416.04 thousand in 2025. The varying trends could be attributed to shifting consumer preferences towards sustainable materials, global economic conditions affecting trade flows, and technological advancements in fiber production processes. The surge in production in 2021 might have been driven by increased investments in manufacturing capacity, aligning with the sector's growth strategies to meet rising demand for Citr Fiber globally.
Key Highlights of the Report:
- Lithuania Citr Fiber Market Outlook
- Market Size of Lithuania Citr Fiber Market, 2024
- Forecast of Lithuania Citr Fiber Market, 2031
- Historical Data and Forecast of Lithuania Citr Fiber Revenues & Volume for the Period 2021-2031
- Lithuania Citr Fiber Market Trend Evolution
- Lithuania Citr Fiber Market Drivers and Challenges
- Lithuania Citr Fiber Price Trends
- Lithuania Citr Fiber Porter's Five Forces
- Lithuania Citr Fiber Industry Life Cycle
- Historical Data and Forecast of Lithuania Citr Fiber Market Revenues & Volume By Type for the Period 2021-2031
- Historical Data and Forecast of Lithuania Citr Fiber Market Revenues & Volume By Insoluble Fiber for the Period 2021-2031
- Historical Data and Forecast of Lithuania Citr Fiber Market Revenues & Volume By Soluble Fiber for the Period 2021-2031
- Historical Data and Forecast of Lithuania Citr Fiber Market Revenues & Volume By Form for the Period 2021-2031
- Historical Data and Forecast of Lithuania Citr Fiber Market Revenues & Volume By Powder for the Period 2021-2031
- Historical Data and Forecast of Lithuania Citr Fiber Market Revenues & Volume By Granules for the Period 2021-2031
- Historical Data and Forecast of Lithuania Citr Fiber Market Revenues & Volume By Others for the Period 2021-2031
- Historical Data and Forecast of Lithuania Citr Fiber Market Revenues & Volume By Application for the Period 2021-2031
- Historical Data and Forecast of Lithuania Citr Fiber Market Revenues & Volume By Food & Beverages for the Period 2021-2031
- Historical Data and Forecast of Lithuania Citr Fiber Market Revenues & Volume By Personal Care for the Period 2021-2031
- Historical Data and Forecast of Lithuania Citr Fiber Market Revenues & Volume By Pharmaceuticals for the Period 2021-2031
- Historical Data and Forecast of Lithuania Citr Fiber Market Revenues & Volume By Animal Feed for the Period 2021-2031
- Historical Data and Forecast of Lithuania Citr Fiber Market Revenues & Volume By Others for the Period 2021 - 2031
- Historical Data and Forecast of Lithuania Citr Fiber Market Revenues & Volume By Function for the Period 2021-2031
- Historical Data and Forecast of Lithuania Citr Fiber Market Revenues & Volume By Water Binder and Fat Replacer for the Period 2021-2031
- Historical Data and Forecast of Lithuania Citr Fiber Market Revenues & Volume By Gelling Gums for the Period 2021-2031
- Historical Data and Forecast of Lithuania Citr Fiber Market Revenues & Volume By Thickening Gums for the Period 2021-2031
- Lithuania Citr Fiber Import Export Trade Statistics
- Market Opportunity Assessment By Type
- Market Opportunity Assessment By Form
- Market Opportunity Assessment By Application
- Market Opportunity Assessment By Function
- Lithuania Citr Fiber Top Companies Market Share
- Lithuania Citr Fiber Competitive Benchmarking By Technical and Operational Parameters
- Lithuania Citr Fiber Company Profiles
- Lithuania Citr Fiber Key Strategic Recommendations
Frequently Asked Questions About the Market Study (FAQs):
6Wresearch actively monitors the Lithuania Citr Fiber Market and publishes its comprehensive annual report, highlighting emerging trends, growth drivers, revenue analysis, and forecast outlook. Our insights help businesses to make data-backed strategic decisions with ongoing market dynamics. Our analysts track relevent industries related to the Lithuania Citr Fiber Market, allowing our clients with actionable intelligence and reliable forecasts tailored to emerging regional needs.
Yes, we provide customisation as per your requirements. To learn more, feel free to contact us on sales@6wresearch.com
1 Executive Summary |
2 Introduction |
2.1 Key Highlights of the Report |
2.2 Report Description |
2.3 Market Scope & Segmentation |
2.4 Research Methodology |
2.5 Assumptions |
3 Lithuania Citr Fiber Market Overview |
3.1 Lithuania Country Macro Economic Indicators |
3.2 Lithuania Citr Fiber Market Revenues & Volume, 2021 & 2031F |
3.3 Lithuania Citr Fiber Market - Industry Life Cycle |
3.4 Lithuania Citr Fiber Market - Porter's Five Forces |
3.5 Lithuania Citr Fiber Market Revenues & Volume Share, By Type, 2021 & 2031F |
3.6 Lithuania Citr Fiber Market Revenues & Volume Share, By Form, 2021 & 2031F |
3.7 Lithuania Citr Fiber Market Revenues & Volume Share, By Application, 2021 & 2031F |
3.8 Lithuania Citr Fiber Market Revenues & Volume Share, By Function, 2021 & 2031F |
4 Lithuania Citr Fiber Market Dynamics |
4.1 Impact Analysis |
4.2 Market Drivers |
4.2.1 Increasing demand for high-speed internet services in Lithuania |
4.2.2 Government initiatives to improve broadband infrastructure |
4.2.3 Growing adoption of digital technologies in businesses and households |
4.3 Market Restraints |
4.3.1 High initial installation costs for fiber optic networks |
4.3.2 Limited availability of skilled workforce for installing and maintaining fiber optic infrastructure |
5 Lithuania Citr Fiber Market Trends |
6 Lithuania Citr Fiber Market, By Types |
6.1 Lithuania Citr Fiber Market, By Type |
6.1.1 Overview and Analysis |
6.1.2 Lithuania Citr Fiber Market Revenues & Volume, By Type, 2021 - 2031F |
6.1.3 Lithuania Citr Fiber Market Revenues & Volume, By Insoluble Fiber, 2021 - 2031F |
6.1.4 Lithuania Citr Fiber Market Revenues & Volume, By Soluble Fiber, 2021 - 2031F |
6.2 Lithuania Citr Fiber Market, By Form |
6.2.1 Overview and Analysis |
6.2.2 Lithuania Citr Fiber Market Revenues & Volume, By Powder, 2021 - 2031F |
6.2.3 Lithuania Citr Fiber Market Revenues & Volume, By Granules, 2021 - 2031F |
6.2.4 Lithuania Citr Fiber Market Revenues & Volume, By Others, 2021 - 2031F |
6.3 Lithuania Citr Fiber Market, By Application |
6.3.1 Overview and Analysis |
6.3.2 Lithuania Citr Fiber Market Revenues & Volume, By Food & Beverages, 2021 - 2031F |
6.3.3 Lithuania Citr Fiber Market Revenues & Volume, By Personal Care, 2021 - 2031F |
6.3.4 Lithuania Citr Fiber Market Revenues & Volume, By Pharmaceuticals, 2021 - 2031F |
6.3.5 Lithuania Citr Fiber Market Revenues & Volume, By Animal Feed, 2021 - 2031F |
6.3.6 Lithuania Citr Fiber Market Revenues & Volume, By Others, 2021 - 2031F |
6.4 Lithuania Citr Fiber Market, By Function |
6.4.1 Overview and Analysis |
6.4.2 Lithuania Citr Fiber Market Revenues & Volume, By Water Binder and Fat Replacer, 2021 - 2031F |
6.4.3 Lithuania Citr Fiber Market Revenues & Volume, By Gelling Gums, 2021 - 2031F |
6.4.4 Lithuania Citr Fiber Market Revenues & Volume, By Thickening Gums, 2021 - 2031F |
7 Lithuania Citr Fiber Market Import-Export Trade Statistics |
7.1 Lithuania Citr Fiber Market Export to Major Countries |
7.2 Lithuania Citr Fiber Market Imports from Major Countries |
8 Lithuania Citr Fiber Market Key Performance Indicators |
8.1 Average internet speed in Lithuania |
8.2 Number of households/businesses connected to fiber optic networks |
8.3 Percentage of GDP invested in broadband infrastructure |
8.4 Number of fiber optic network expansion projects initiated |
8.5 Customer satisfaction rate with fiber optic services |
9 Lithuania Citr Fiber Market - Opportunity Assessment |
9.1 Lithuania Citr Fiber Market Opportunity Assessment, By Type, 2021 & 2031F |
9.2 Lithuania Citr Fiber Market Opportunity Assessment, By Form, 2021 & 2031F |
9.3 Lithuania Citr Fiber Market Opportunity Assessment, By Application, 2021 & 2031F |
9.4 Lithuania Citr Fiber Market Opportunity Assessment, By Function, 2021 & 2031F |
10 Lithuania Citr Fiber Market - Competitive Landscape |
10.1 Lithuania Citr Fiber Market Revenue Share, By Companies, 2024 |
10.2 Lithuania Citr Fiber Market Competitive Benchmarking, By Operating and Technical Parameters |
11 Company Profiles |
12 Recommendations |
13 Disclaimer |
Export potential assessment - trade Analytics for 2030
Export potential enables firms to identify high-growth global markets with greater confidence by combining advanced trade intelligence with a structured quantitative methodology. The framework analyzes emerging demand trends and country-level import patterns while integrating macroeconomic and trade datasets such as GDP and population forecasts, bilateral import–export flows, tariff structures, elasticity differentials between developed and developing economies, geographic distance, and import demand projections. Using weighted trade values from 2020–2024 as the base period to project country-to-country export potential for 2030, these inputs are operationalized through calculated drivers such as gravity model parameters, tariff impact factors, and projected GDP per-capita growth. Through an analysis of hidden potentials, demand hotspots, and market conditions that are most favorable to success, this method enables firms to focus on target countries, maximize returns, and global expansion with data, backed by accuracy.
By factoring in the projected importer demand gap that is currently unmet and could be potential opportunity, it identifies the potential for the Exporter (Country) among 190 countries, against the general trade analysis, which identifies the biggest importer or exporter.
To discover high-growth global markets and optimize your business strategy:
Click Here
Pricing
- Single User License$ 1,995
- Department License$ 2,400
- Site License$ 3,120
- Global License$ 3,795

Search
Thought Leadership and Analyst Meet


Our Clients
Latest Reports
- Canada Cloud CFD Market (2026-2032) | Size & Revenue, Industry, Growth, Competitive Landscape, Forecast, Segmentation, Value, Outlook, Trends, Share, Analysis, Companies
- Taiwan Food Delivery Platform Market (2026-2032) | Companies, Outlook, Analysis, Trends, Value, Revenue, Segmentation, Share, Forecast, Competitive Landscape, Growth, Size & Forecast
- United Kingdom (UK) Long-term Care Insurance Market (2026-2032) | Growth, Share, Consumer Insights, Drivers, Opportunities, Competition, Pricing Analysis, Segments, Restraints, Companies, Competitive, Value, Outlook, Size, Demand, Analysis, Challenges, Strategic Insights, Investment Trends, Revenue, Trends, Supply, Forecast
- United Kingdom (UK) Long Term Care Market (2026-2032) | Companies, Outlook, Analysis, Trends, Value, Revenue, Segmentation, Share, Forecast, Competitive Landscape, Growth, Size & Forecast
- Iraq Insulation and Waterproofing Market (2026-2032) | Outlook, Drivers, Growth, Size, Share, Industry, Revenue, Trends, Demand, Competitive, Strategic Insights, Opportunities, Segments, Companies, Challenges, Strategy, Consumer Insights, Analysis, Investment Trends, Value, Segmentation, Forecast, Restraints
- India Switchgear Market Outlook (2026-2032) | Size, Share, Trends, Growth, Revenue, Forecast, Analysis, Value, Outlook
- Pakistan Contraceptive Implants Market (2025-2031) | Demand, Growth, Size, Share, Industry, Pricing Analysis, Competitive, Strategic Insights, Strategy, Consumer Insights, Analysis, Investment Trends, Opportunities, Revenue, Segments, Value, Segmentation, Supply, Forecast, Restraints, Outlook, Competition, Drivers, Trends, Companies, Challenges
- Sri Lanka Packaging Market (2026-2032) | Outlook, Competition, Drivers, Trends, Demand, Pricing Analysis, Competitive, Strategic Insights, Companies, Challenges, Strategy, Consumer Insights, Analysis, Investment Trends, Opportunities, Growth, Size, Share, Industry, Revenue, Segments, Value, Segmentation, Supply, Forecast, Restraints
- India Kids Watches Market (2026-2032) | Strategy, Consumer Insights, Analysis, Investment Trends, Opportunities, Growth, Size, Share, Industry, Revenue, Segments, Value, Segmentation, Supply, Forecast, Restraints, Outlook, Competition, Drivers, Trends, Demand, Pricing Analysis, Competitive, Strategic Insights, Companies, Challenges
- Saudi Arabia Core Assurance Service Market (2025-2031) | Strategy, Consumer Insights, Analysis, Investment Trends, Opportunities, Growth, Size, Share, Industry, Revenue, Segments, Value, Segmentation, Supply, Forecast, Restraints, Outlook, Competition, Drivers, Trends, Demand, Pricing Analysis, Competitive, Strategic Insights, Companies, Challenges
Industry Events and Analyst Meet

India EV Show 2026

EV tech India Expo 2026

Auto Tech Asia 2026

Battery Tech India 2026

Smart Production Solutions Guangzhou 2026
Whitepaper
- Middle East & Africa Commercial Security Market Click here to view more.
- Middle East & Africa Fire Safety Systems & Equipment Market Click here to view more.
- GCC Drone Market Click here to view more.
- Middle East Lighting Fixture Market Click here to view more.
- GCC Physical & Perimeter Security Market Click here to view more.
6WResearch In News
- Doha a strategic location for EV manufacturing hub: IPA Qatar
- Demand for luxury TVs surging in the GCC, says Samsung
- Empowering Growth: The Thriving Journey of Bangladesh’s Cable Industry
- Demand for luxury TVs surging in the GCC, says Samsung
- Video call with a traditional healer? Once unthinkable, it’s now common in South Africa
- Intelligent Buildings To Smooth GCC’s Path To Net Zero