Lithuania Drinking Chocolate Market (2026-2032) | Trends, Analysis, Size & Revenue, Competitive Landscape, Industry, Companies, Share, Forecast, Segmentation, Growth, Outlook, Value
Market Forecast By Type (Dark chocolate, Milk chocolate, White), By Cocoa content (60-90%, 40-60%, 30-40%, Others), By Distribution channel (Hypermarkets/supermarkets, Specialty store, Convenience stores, Online store, Other), By Application (Chocolate Drinks, Protein Shakes, Energy Drinks, Coffee Mixes, Others), By Flavour (Vanilla, Caramel, Honey, Hazelnut), By Form (Powder, Liquid), By Target customers (Adults, Kids), By End users (Food Service Providers, Household/Domestic, Corporates, Airlines) And Competitive Landscape
| Product Code: ETC8039500 | Publication Date: Sep 2024 | Updated Date: Apr 2026 | Product Type: Market Research Report | |
| Publisher: 6Wresearch | Author: Vasudha | No. of Pages: 75 | No. of Figures: 35 | No. of Tables: 20 |
Lithuania Drinking Chocolate Market Size (2020-2030)
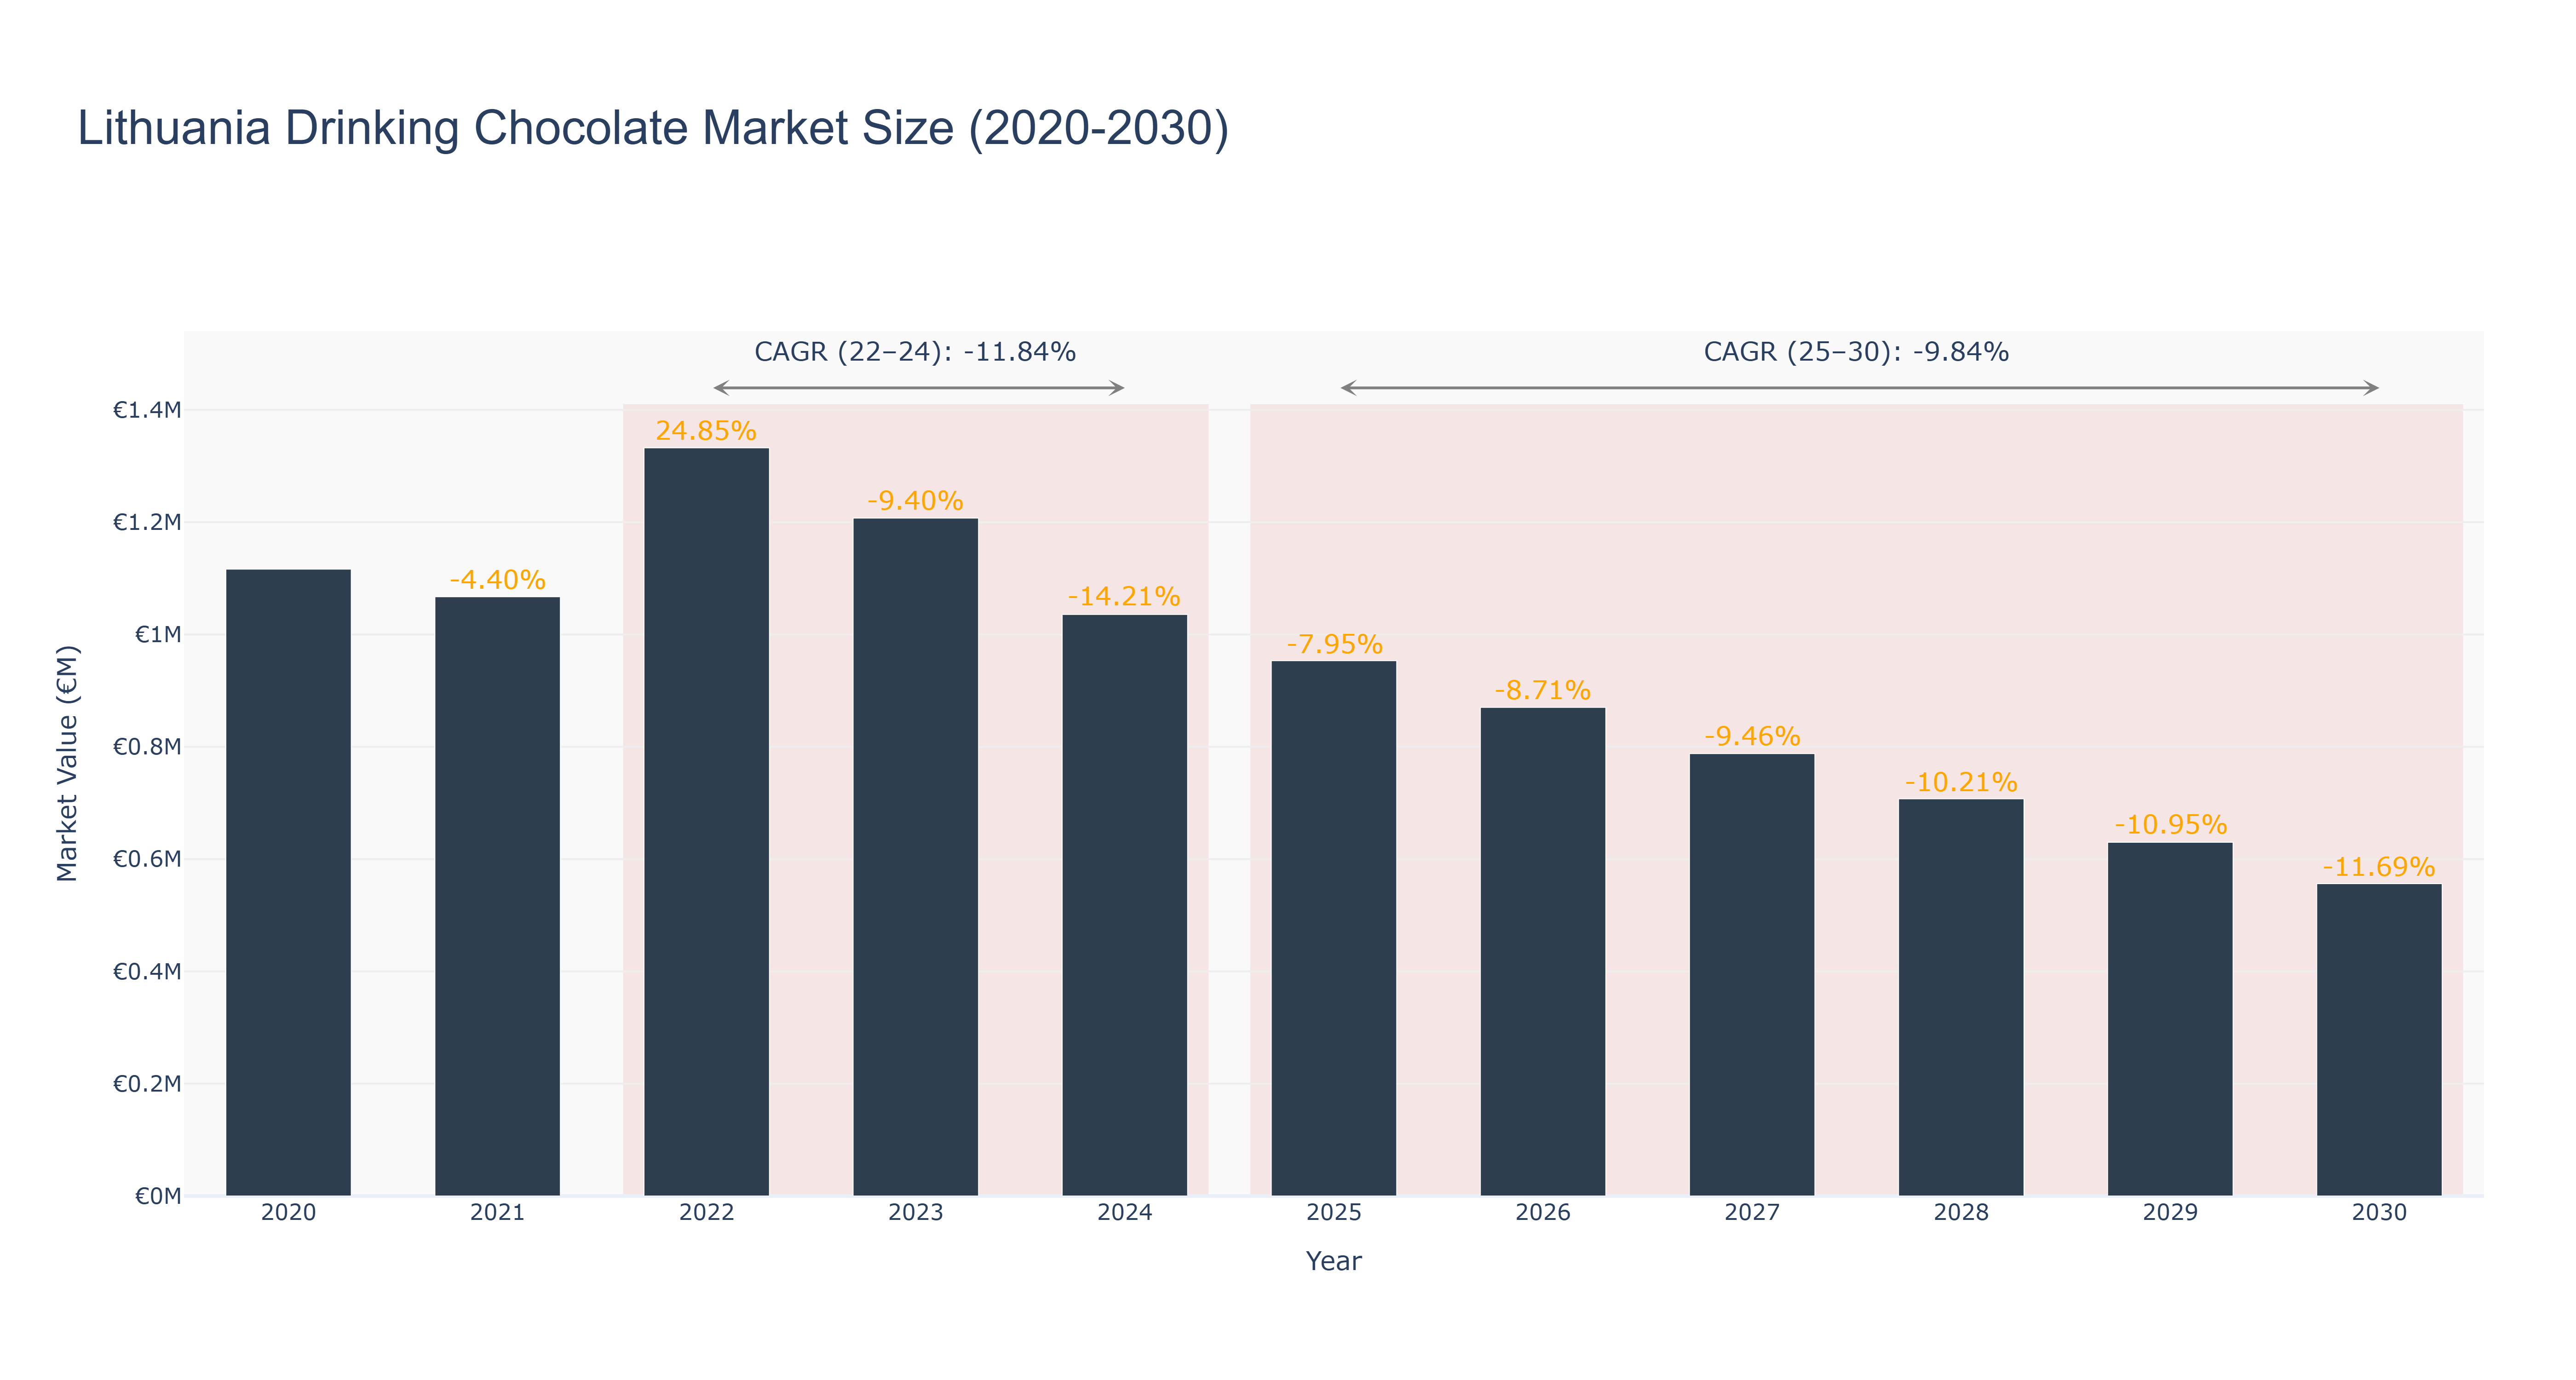
The Lithuania Drinking Chocolate Market experienced its peak market size in 2022, reaching €1.33 million, marking a notable recovery from a decline in 2021. However, this growth was short-lived, as the market contracted to €1.21 million in 2023 and further declined to €1.04 million in 2024, resulting in a compound annual growth rate (CAGR) of -11.84% for the actual period from 2022 to 2024. Looking ahead to the forecasted period of 2025-2030, the market is projected to continue its downward trajectory, with an estimated CAGR of -9.84%, ultimately decreasing to €556.33 thousand by 2030. Contributing factors to this decline may include shifting consumer preferences towards healthier alternatives, increased competition from other beverage categories, and economic pressures. While no specific upcoming projects have been noted, a broader trend towards premiumization and innovative product offerings may provide opportunities for market stabilization in the long term.
Lithuania Drinking Chocolate Market: Production & Trade Performance (2019-2025)
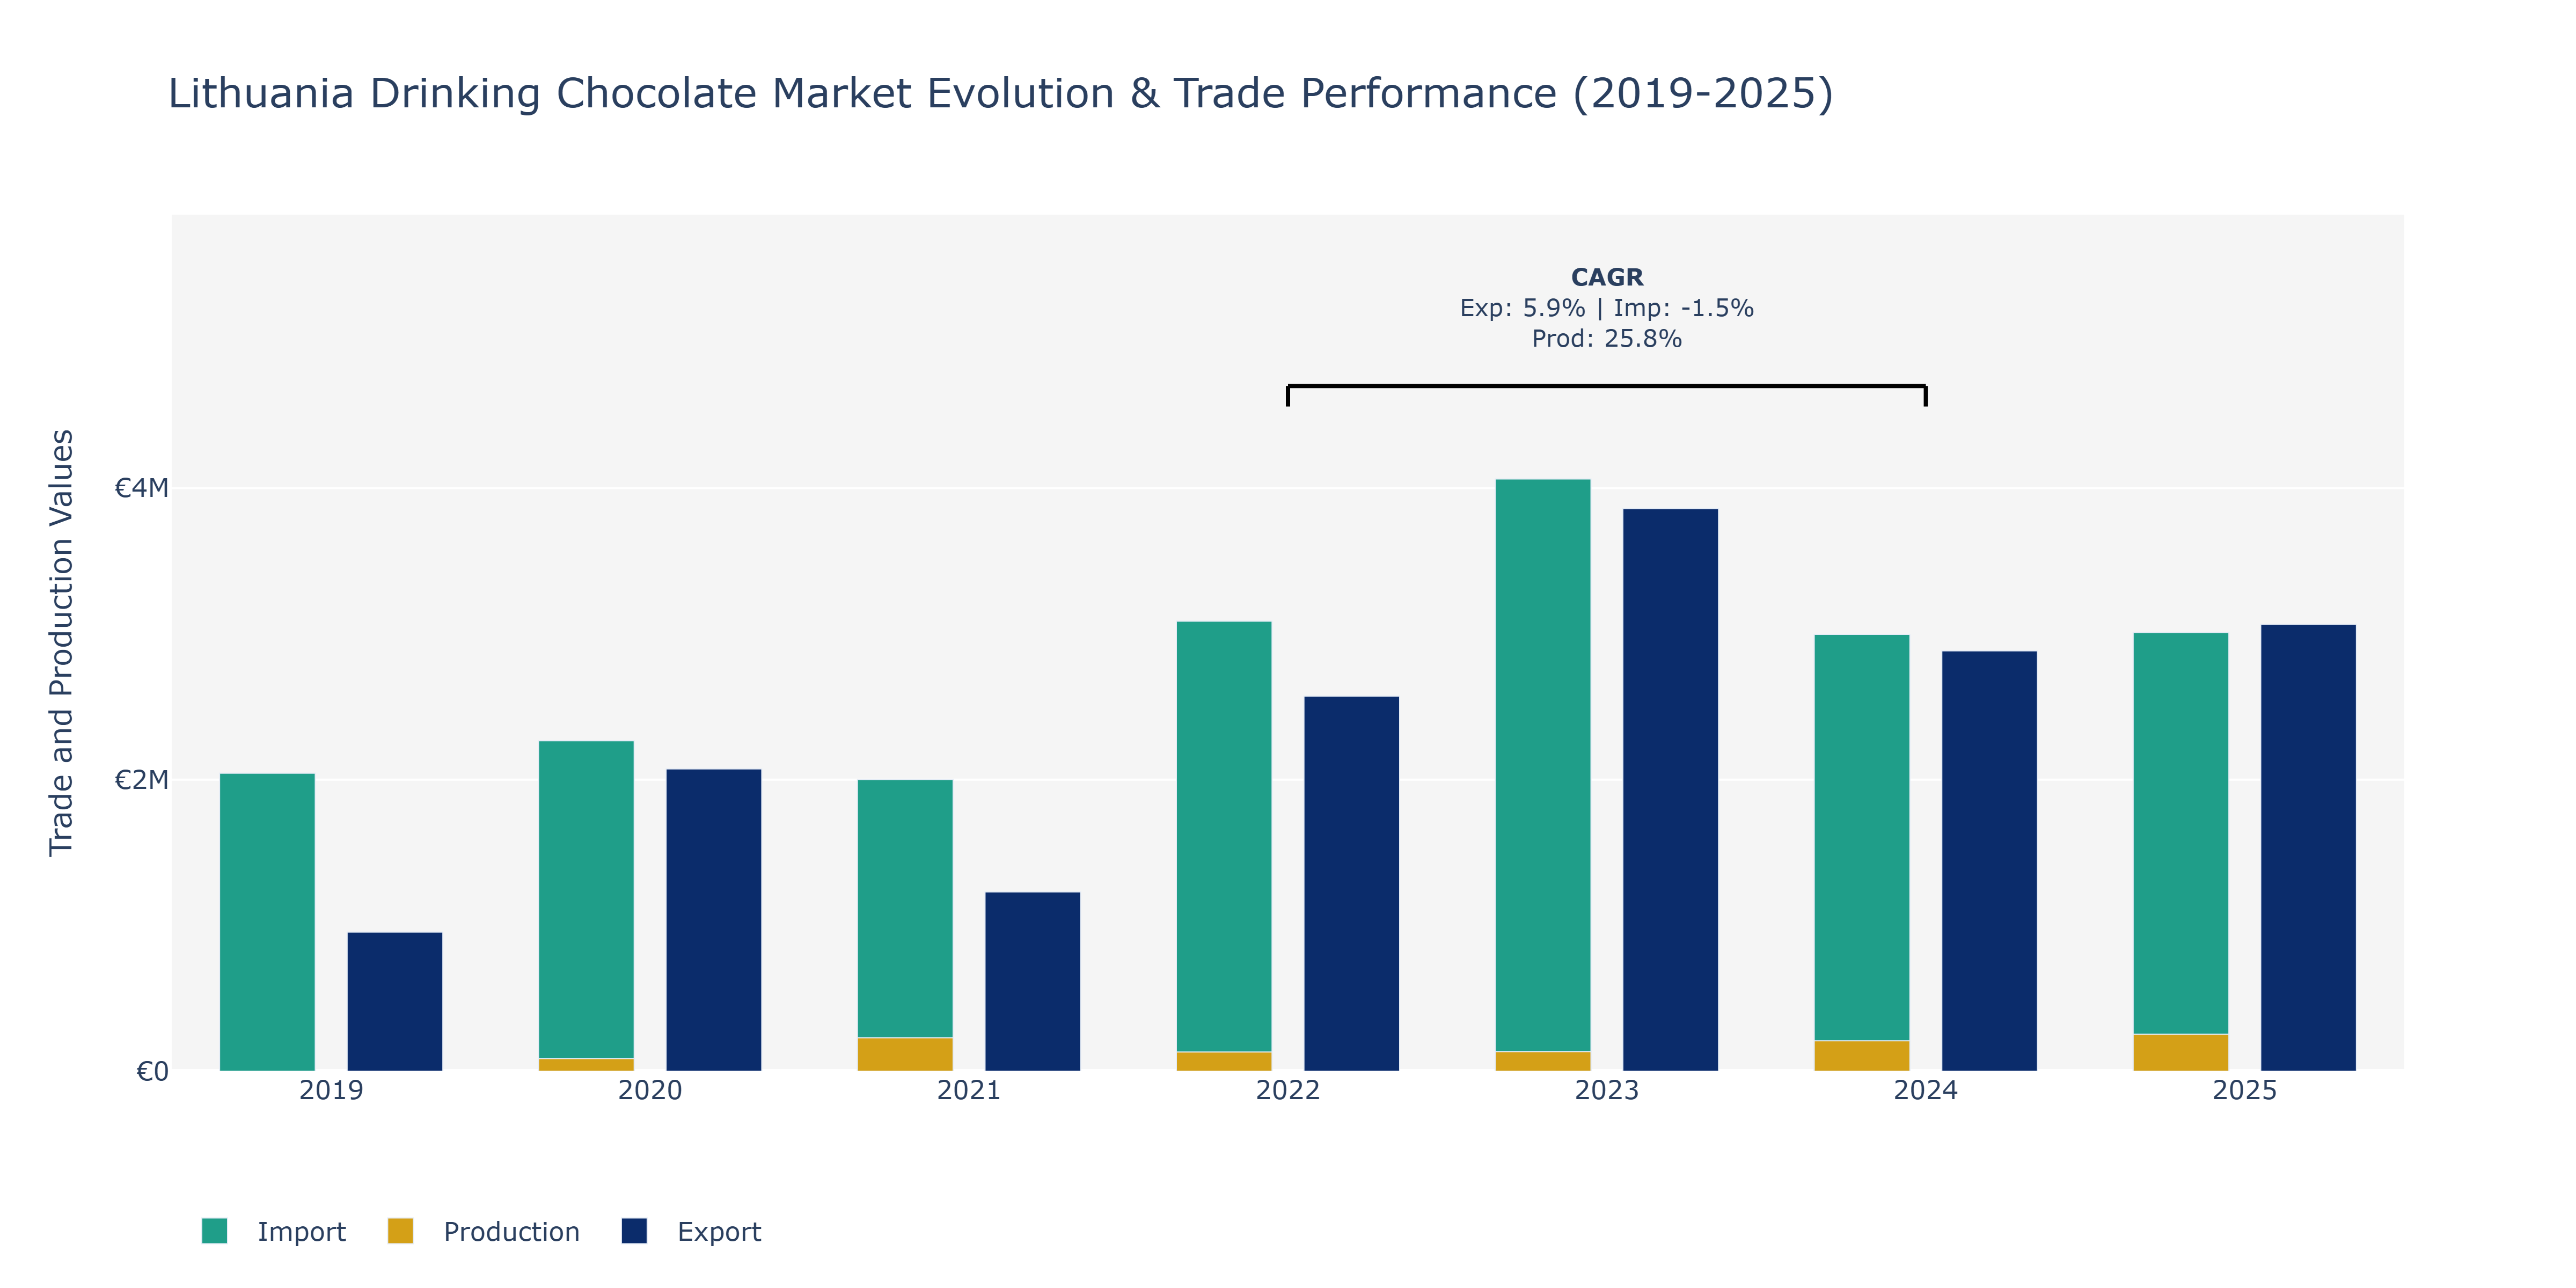
In the Lithuania Drinking Chocolate Market, exports saw a notable increase from €954.19 thousand in 2019 to €3.9 million in 2023, before slightly decreasing to €2.88 million in 2024. This fluctuation could be attributed to changing consumer preferences, global economic conditions, and competitive pricing strategies. Imports remained relatively stable around €2 million annually, with a slight decrease in 2024 to €3 million. Production showed a consistent upward trend, more than doubling from €2.07 million in 2020 to over €254.4 million in 2025. This substantial growth in production may be linked to advancements in technology, improved supply chain efficiencies, and increasing demand for premium drinking chocolate products. The market's robust production growth indicates a positive outlook for the sector, potentially driven by a focus on quality and innovation in response to evolving consumer tastes and preferences.
Key Highlights of the Report:
- Lithuania Drinking Chocolate Market Outlook
- Market Size of Lithuania Drinking Chocolate Market, 2025
- Forecast of Lithuania Drinking Chocolate Market, 2032
- Historical Data and Forecast of Lithuania Drinking Chocolate Revenues & Volume for the Period 2022 - 2032
- Lithuania Drinking Chocolate Market Trend Evolution
- Lithuania Drinking Chocolate Market Drivers and Challenges
- Lithuania Drinking Chocolate Price Trends
- Lithuania Drinking Chocolate Porter's Five Forces
- Lithuania Drinking Chocolate Industry Life Cycle
- Historical Data and Forecast of Lithuania Drinking Chocolate Market Revenues & Volume By Type for the Period 2022 - 2032
- Historical Data and Forecast of Lithuania Drinking Chocolate Market Revenues & Volume By Dark chocolate for the Period 2022 - 2032
- Historical Data and Forecast of Lithuania Drinking Chocolate Market Revenues & Volume By Milk chocolate for the Period 2022 - 2032
- Historical Data and Forecast of Lithuania Drinking Chocolate Market Revenues & Volume By White for the Period 2022 - 2032
- Historical Data and Forecast of Lithuania Drinking Chocolate Market Revenues & Volume By Cocoa content for the Period 2022 - 2032
- Historical Data and Forecast of Lithuania Drinking Chocolate Market Revenues & Volume By 60-90% for the Period 2022 - 2032
- Historical Data and Forecast of Lithuania Drinking Chocolate Market Revenues & Volume By 40-60% for the Period 2022 - 2032
- Historical Data and Forecast of Lithuania Drinking Chocolate Market Revenues & Volume By 30-40% for the Period 2022 - 2032
- Historical Data and Forecast of Lithuania Drinking Chocolate Market Revenues & Volume By Others for the Period 2022 - 2032
- Historical Data and Forecast of Lithuania Drinking Chocolate Market Revenues & Volume By Distribution channel for the Period 2022 - 2032
- Historical Data and Forecast of Lithuania Drinking Chocolate Market Revenues & Volume By Hypermarkets/supermarkets for the Period 2022 - 2032
- Historical Data and Forecast of Lithuania Drinking Chocolate Market Revenues & Volume By Specialty store for the Period 2022 - 2032
- Historical Data and Forecast of Lithuania Drinking Chocolate Market Revenues & Volume By Convenience stores for the Period 2022 - 2032
- Historical Data and Forecast of Lithuania Drinking Chocolate Market Revenues & Volume By Online store for the Period 2022 - 2032
- Historical Data and Forecast of Lithuania Drinking Chocolate Market Revenues & Volume By Other for the Period 2022 - 2032
- Historical Data and Forecast of Lithuania Drinking Chocolate Market Revenues & Volume By Application for the Period 2022 - 2032
- Historical Data and Forecast of Lithuania Drinking Chocolate Market Revenues & Volume By Chocolate Drinks for the Period 2022 - 2032
- Historical Data and Forecast of Lithuania Drinking Chocolate Market Revenues & Volume By Protein Shakes for the Period 2022 - 2032
- Historical Data and Forecast of Lithuania Drinking Chocolate Market Revenues & Volume By Energy Drinks for the Period 2022 - 2032
- Historical Data and Forecast of Lithuania Drinking Chocolate Market Revenues & Volume By Coffee Mixes for the Period 2022 - 2032
- Historical Data and Forecast of Lithuania Drinking Chocolate Market Revenues & Volume By Others for the Period 2022 - 2032
- Historical Data and Forecast of Lithuania Drinking Chocolate Market Revenues & Volume By Flavour for the Period 2022 - 2032
- Historical Data and Forecast of Lithuania Drinking Chocolate Market Revenues & Volume By Vanilla for the Period 2022 - 2032
- Historical Data and Forecast of Lithuania Drinking Chocolate Market Revenues & Volume By Caramel for the Period 2022 - 2032
- Historical Data and Forecast of Lithuania Drinking Chocolate Market Revenues & Volume By Honey for the Period 2022 - 2032
- Historical Data and Forecast of Lithuania Drinking Chocolate Market Revenues & Volume By Hazelnut for the Period 2022 - 2032
- Historical Data and Forecast of Lithuania Drinking Chocolate Market Revenues & Volume By Form for the Period 2022 - 2032
- Historical Data and Forecast of Lithuania Drinking Chocolate Market Revenues & Volume By Powder for the Period 2022 - 2032
- Historical Data and Forecast of Lithuania Drinking Chocolate Market Revenues & Volume By Liquid for the Period 2022 - 2032
- Historical Data and Forecast of Lithuania Drinking Chocolate Market Revenues & Volume By Target customers for the Period 2022 - 2032
- Historical Data and Forecast of Lithuania Drinking Chocolate Market Revenues & Volume By Adults for the Period 2022 - 2032
- Historical Data and Forecast of Lithuania Drinking Chocolate Market Revenues & Volume By Kids for the Period 2022 - 2032
- Historical Data and Forecast of Lithuania Drinking Chocolate Market Revenues & Volume By End users for the Period 2022 - 2032
- Historical Data and Forecast of Lithuania Drinking Chocolate Market Revenues & Volume By Food Service Providers for the Period 2022 - 2032
- Historical Data and Forecast of Lithuania Drinking Chocolate Market Revenues & Volume By Household/Domestic for the Period 2022 - 2032
- Historical Data and Forecast of Lithuania Drinking Chocolate Market Revenues & Volume By Corporates for the Period 2022 - 2032
- Historical Data and Forecast of Lithuania Drinking Chocolate Market Revenues & Volume By Airlines for the Period 2022 - 2032
- Lithuania Drinking Chocolate Import Export Trade Statistics
- Market Opportunity Assessment By Type
- Market Opportunity Assessment By Cocoa content
- Market Opportunity Assessment By Distribution channel
- Market Opportunity Assessment By Application
- Market Opportunity Assessment By Flavour
- Market Opportunity Assessment By Form
- Market Opportunity Assessment By Target customers
- Market Opportunity Assessment By End users
- Lithuania Drinking Chocolate Top Companies Market Share
- Lithuania Drinking Chocolate Competitive Benchmarking By Technical and Operational Parameters
- Lithuania Drinking Chocolate Company Profiles
- Lithuania Drinking Chocolate Key Strategic Recommendations
Frequently Asked Questions About the Market Study (FAQs):
6Wresearch actively monitors the Lithuania Drinking Chocolate Market and publishes its comprehensive annual report, highlighting emerging trends, growth drivers, revenue analysis, and forecast outlook. Our insights help businesses to make data-backed strategic decisions with ongoing market dynamics. Our analysts track relevent industries related to the Lithuania Drinking Chocolate Market, allowing our clients with actionable intelligence and reliable forecasts tailored to emerging regional needs.
Yes, we provide customisation as per your requirements. To learn more, feel free to contact us on sales@6wresearch.com
1 Executive Summary |
2 Introduction |
2.1 Key Highlights of the Report |
2.2 Report Description |
2.3 Market Scope & Segmentation |
2.4 Research Methodology |
2.5 Assumptions |
3 Lithuania Drinking Chocolate Market Overview |
3.1 Lithuania Country Macro Economic Indicators |
3.2 Lithuania Drinking Chocolate Market Revenues & Volume, 2022 & 2032F |
3.3 Lithuania Drinking Chocolate Market - Industry Life Cycle |
3.4 Lithuania Drinking Chocolate Market - Porter's Five Forces |
3.5 Lithuania Drinking Chocolate Market Revenues & Volume Share, By Type, 2022 & 2032F |
3.6 Lithuania Drinking Chocolate Market Revenues & Volume Share, By Cocoa content, 2022 & 2032F |
3.7 Lithuania Drinking Chocolate Market Revenues & Volume Share, By Distribution channel, 2022 & 2032F |
3.8 Lithuania Drinking Chocolate Market Revenues & Volume Share, By Application, 2022 & 2032F |
3.9 Lithuania Drinking Chocolate Market Revenues & Volume Share, By Flavour, 2022 & 2032F |
3.10 Lithuania Drinking Chocolate Market Revenues & Volume Share, By Form, 2022 & 2032F |
3.11 Lithuania Drinking Chocolate Market Revenues & Volume Share, By Target customers, 2022 & 2032F |
4 Lithuania Drinking Chocolate Market Dynamics |
4.1 Impact Analysis |
4.2 Market Drivers |
4.2.1 Increasing consumer awareness about the health benefits of dark chocolate |
4.2.2 Growing demand for premium and gourmet chocolate products |
4.2.3 Rising popularity of hot beverages and indulgent treats |
4.3 Market Restraints |
4.3.1 Fluctuating prices of raw materials such as cocoa |
4.3.2 Competition from other hot beverage categories like coffee and tea |
4.3.3 Health concerns related to sugar content in drinking chocolate |
5 Lithuania Drinking Chocolate Market Trends |
6 Lithuania Drinking Chocolate Market, By Types |
6.1 Lithuania Drinking Chocolate Market, By Type |
6.1.1 Overview and Analysis |
6.1.2 Lithuania Drinking Chocolate Market Revenues & Volume, By Type, 2022 - 2032F |
6.1.3 Lithuania Drinking Chocolate Market Revenues & Volume, By Dark chocolate, 2022 - 2032F |
6.1.4 Lithuania Drinking Chocolate Market Revenues & Volume, By Milk chocolate, 2022 - 2032F |
6.1.5 Lithuania Drinking Chocolate Market Revenues & Volume, By White, 2022 - 2032F |
6.2 Lithuania Drinking Chocolate Market, By Cocoa content |
6.2.1 Overview and Analysis |
6.2.2 Lithuania Drinking Chocolate Market Revenues & Volume, By 60-90%, 2022 - 2032F |
6.2.3 Lithuania Drinking Chocolate Market Revenues & Volume, By 40-60%, 2022 - 2032F |
6.2.4 Lithuania Drinking Chocolate Market Revenues & Volume, By 30-40%, 2022 - 2032F |
6.2.5 Lithuania Drinking Chocolate Market Revenues & Volume, By Others, 2022 - 2032F |
6.3 Lithuania Drinking Chocolate Market, By Distribution channel |
6.3.1 Overview and Analysis |
6.3.2 Lithuania Drinking Chocolate Market Revenues & Volume, By Hypermarkets/supermarkets, 2022 - 2032F |
6.3.3 Lithuania Drinking Chocolate Market Revenues & Volume, By Specialty store, 2022 - 2032F |
6.3.4 Lithuania Drinking Chocolate Market Revenues & Volume, By Convenience stores, 2022 - 2032F |
6.3.5 Lithuania Drinking Chocolate Market Revenues & Volume, By Online store, 2022 - 2032F |
6.3.6 Lithuania Drinking Chocolate Market Revenues & Volume, By Other, 2022 - 2032F |
6.4 Lithuania Drinking Chocolate Market, By Application |
6.4.1 Overview and Analysis |
6.4.2 Lithuania Drinking Chocolate Market Revenues & Volume, By Chocolate Drinks, 2022 - 2032F |
6.4.3 Lithuania Drinking Chocolate Market Revenues & Volume, By Protein Shakes, 2022 - 2032F |
6.4.4 Lithuania Drinking Chocolate Market Revenues & Volume, By Energy Drinks, 2022 - 2032F |
6.4.5 Lithuania Drinking Chocolate Market Revenues & Volume, By Coffee Mixes, 2022 - 2032F |
6.4.6 Lithuania Drinking Chocolate Market Revenues & Volume, By Others, 2022 - 2032F |
6.5 Lithuania Drinking Chocolate Market, By Flavour |
6.5.1 Overview and Analysis |
6.5.2 Lithuania Drinking Chocolate Market Revenues & Volume, By Vanilla, 2022 - 2032F |
6.5.3 Lithuania Drinking Chocolate Market Revenues & Volume, By Caramel, 2022 - 2032F |
6.5.4 Lithuania Drinking Chocolate Market Revenues & Volume, By Honey, 2022 - 2032F |
6.5.5 Lithuania Drinking Chocolate Market Revenues & Volume, By Hazelnut, 2022 - 2032F |
6.6 Lithuania Drinking Chocolate Market, By Form |
6.6.1 Overview and Analysis |
6.6.2 Lithuania Drinking Chocolate Market Revenues & Volume, By Powder, 2022 - 2032F |
6.6.3 Lithuania Drinking Chocolate Market Revenues & Volume, By Liquid, 2022 - 2032F |
6.7 Lithuania Drinking Chocolate Market, By Target customers |
6.7.1 Overview and Analysis |
6.7.2 Lithuania Drinking Chocolate Market Revenues & Volume, By Adults, 2022 - 2032F |
6.7.3 Lithuania Drinking Chocolate Market Revenues & Volume, By Kids, 2022 - 2032F |
6.8 Lithuania Drinking Chocolate Market, By End users |
6.8.1 Overview and Analysis |
6.8.2 Lithuania Drinking Chocolate Market Revenues & Volume, By Food Service Providers, 2022 - 2032F |
6.8.3 Lithuania Drinking Chocolate Market Revenues & Volume, By Household/Domestic, 2022 - 2032F |
6.8.4 Lithuania Drinking Chocolate Market Revenues & Volume, By Airlines, 2022 - 2032F |
6.8.5 Lithuania Drinking Chocolate Market Revenues & Volume, By Airlines, 2022 - 2032F |
7 Lithuania Drinking Chocolate Market Import-Export Trade Statistics |
7.1 Lithuania Drinking Chocolate Market Export to Major Countries |
7.2 Lithuania Drinking Chocolate Market Imports from Major Countries |
8 Lithuania Drinking Chocolate Market Key Performance Indicators |
8.1 Percentage growth in the consumption of dark chocolate products |
8.2 Number of new product launches in the premium drinking chocolate segment |
8.3 Customer satisfaction levels with packaging and branding of drinking chocolate products |
9 Lithuania Drinking Chocolate Market - Opportunity Assessment |
9.1 Lithuania Drinking Chocolate Market Opportunity Assessment, By Type, 2022 & 2032F |
9.2 Lithuania Drinking Chocolate Market Opportunity Assessment, By Cocoa content, 2022 & 2032F |
9.3 Lithuania Drinking Chocolate Market Opportunity Assessment, By Distribution channel, 2022 & 2032F |
9.4 Lithuania Drinking Chocolate Market Opportunity Assessment, By Application, 2022 & 2032F |
9.5 Lithuania Drinking Chocolate Market Opportunity Assessment, By Flavour, 2022 & 2032F |
9.6 Lithuania Drinking Chocolate Market Opportunity Assessment, By Form, 2022 & 2032F |
9.7 Lithuania Drinking Chocolate Market Opportunity Assessment, By Target customers, 2022 & 2032F |
9.7 Lithuania Drinking Chocolate Market Opportunity Assessment, By End users, 2022 & 2032F |
10 Lithuania Drinking Chocolate Market - Competitive Landscape |
10.1 Lithuania Drinking Chocolate Market Revenue Share, By Companies, 2025 |
10.2 Lithuania Drinking Chocolate Market Competitive Benchmarking, By Operating and Technical Parameters |
11 Company Profiles |
12 Recommendations |
13 Disclaimer |
Global Go To Market Strategy - 2030
Export potential enables firms to identify high-growth global markets with greater confidence by combining advanced trade intelligence with a structured quantitative methodology. The framework analyzes emerging demand trends and country-level import patterns while integrating macroeconomic and trade datasets such as GDP and population forecasts, bilateral import–export flows, tariff structures, elasticity differentials between developed and developing economies, geographic distance, and import demand projections. Using weighted trade values from 2020–2024 as the base period to project country-to-country export potential for 2030, these inputs are operationalized through calculated drivers such as gravity model parameters, tariff impact factors, and projected GDP per-capita growth. Through an analysis of hidden potentials, demand hotspots, and market conditions that are most favorable to success, this method enables firms to focus on target countries, maximize returns, and global expansion with data, backed by accuracy.
By factoring in the projected importer demand gap that is currently unmet and could be potential opportunity, it identifies the potential for the Exporter (Country) among 190 countries, against the general trade analysis, which identifies the biggest importer or exporter.
To discover high-growth global markets and optimize your business strategy:
Click Here
Pricing
- Single User License$ 1,995
- Department License$ 2,400
- Site License$ 3,120
- Global License$ 3,795

Leadership Perspectives from Industry Events
Search
Thought Leadership and Analyst Meet


Our Clients
6WResearch In News
- India Export Attractiveness Tracker 2026
- India Air Conditioner Market Set for Strong Rebound in 2026 After Weather-Led Correction and GST-Driven Recovery: 6Wresearch
- ADAS in India: How Automatic Emergency Braking, Blind Spot Detection & Driver Monitoring are Transforming Road Safety
- Doha a strategic location for EV manufacturing hub: IPA Qatar
- Demand for luxury TVs surging in the GCC, says Samsung
- Empowering Growth: The Thriving Journey of Bangladesh’s Cable Industry
Latest Reports
- Qatar Access and Home Network Market (2026-2032)
- Nicaragua RPG Gaming Market (2026-2032)
- New Zealand RPG Gaming Market (2026-2032)
- Netherlands RPG Gaming Market (2026-2032)
- Nauru RPG Gaming Market (2026-2032)
- Namibia RPG Gaming Market (2026-2032)
- Mozambique RPG Gaming Market (2026-2032)
- Montenegro RPG Gaming Market (2026-2032)
- Mongolia RPG Gaming Market (2026-2032)
- Monaco RPG Gaming Market (2026-2032)
Industry Events and Analyst Meet

EV India Expo 2026

HIMTEX 2026

India Refining Summit 2026

India EV Show 2026

EV tech India Expo 2026
Whitepaper
- Middle East & Africa Commercial Security Market Click here to view more.
- Middle East & Africa Fire Safety Systems & Equipment Market Click here to view more.
- GCC Drone Market Click here to view more.
- Middle East Lighting Fixture Market Click here to view more.
- GCC Physical & Perimeter Security Market Click here to view more.