Romania Drinking Chocolate Market (2026-2032) | Analysis, Companies, Outlook, Forecast, Size & Revenue, Value, Segmentation, Trends, Competitive Landscape, Industry, Share, Growth
Market Forecast By Type (Dark chocolate, Milk chocolate, White), By Cocoa content (60-90%, 40-60%, 30-40%, Others), By Distribution channel (Hypermarkets/supermarkets, Specialty store, Convenience stores, Online store, Other), By Application (Chocolate Drinks, Protein Shakes, Energy Drinks, Coffee Mixes, Others), By Flavour (Vanilla, Caramel, Honey, Hazelnut), By Form (Powder, Liquid), By Target customers (Adults, Kids), By End users (Food Service Providers, Household/Domestic, Corporates, Airlines) And Competitive Landscape
| Product Code: ETC8969590 | Publication Date: Sep 2024 | Updated Date: Apr 2026 | Product Type: Market Research Report | |
| Publisher: 6Wresearch | Author: Vasudha | No. of Pages: 75 | No. of Figures: 35 | No. of Tables: 20 |
Romania Drinking Chocolate Market Size (2020-2030)
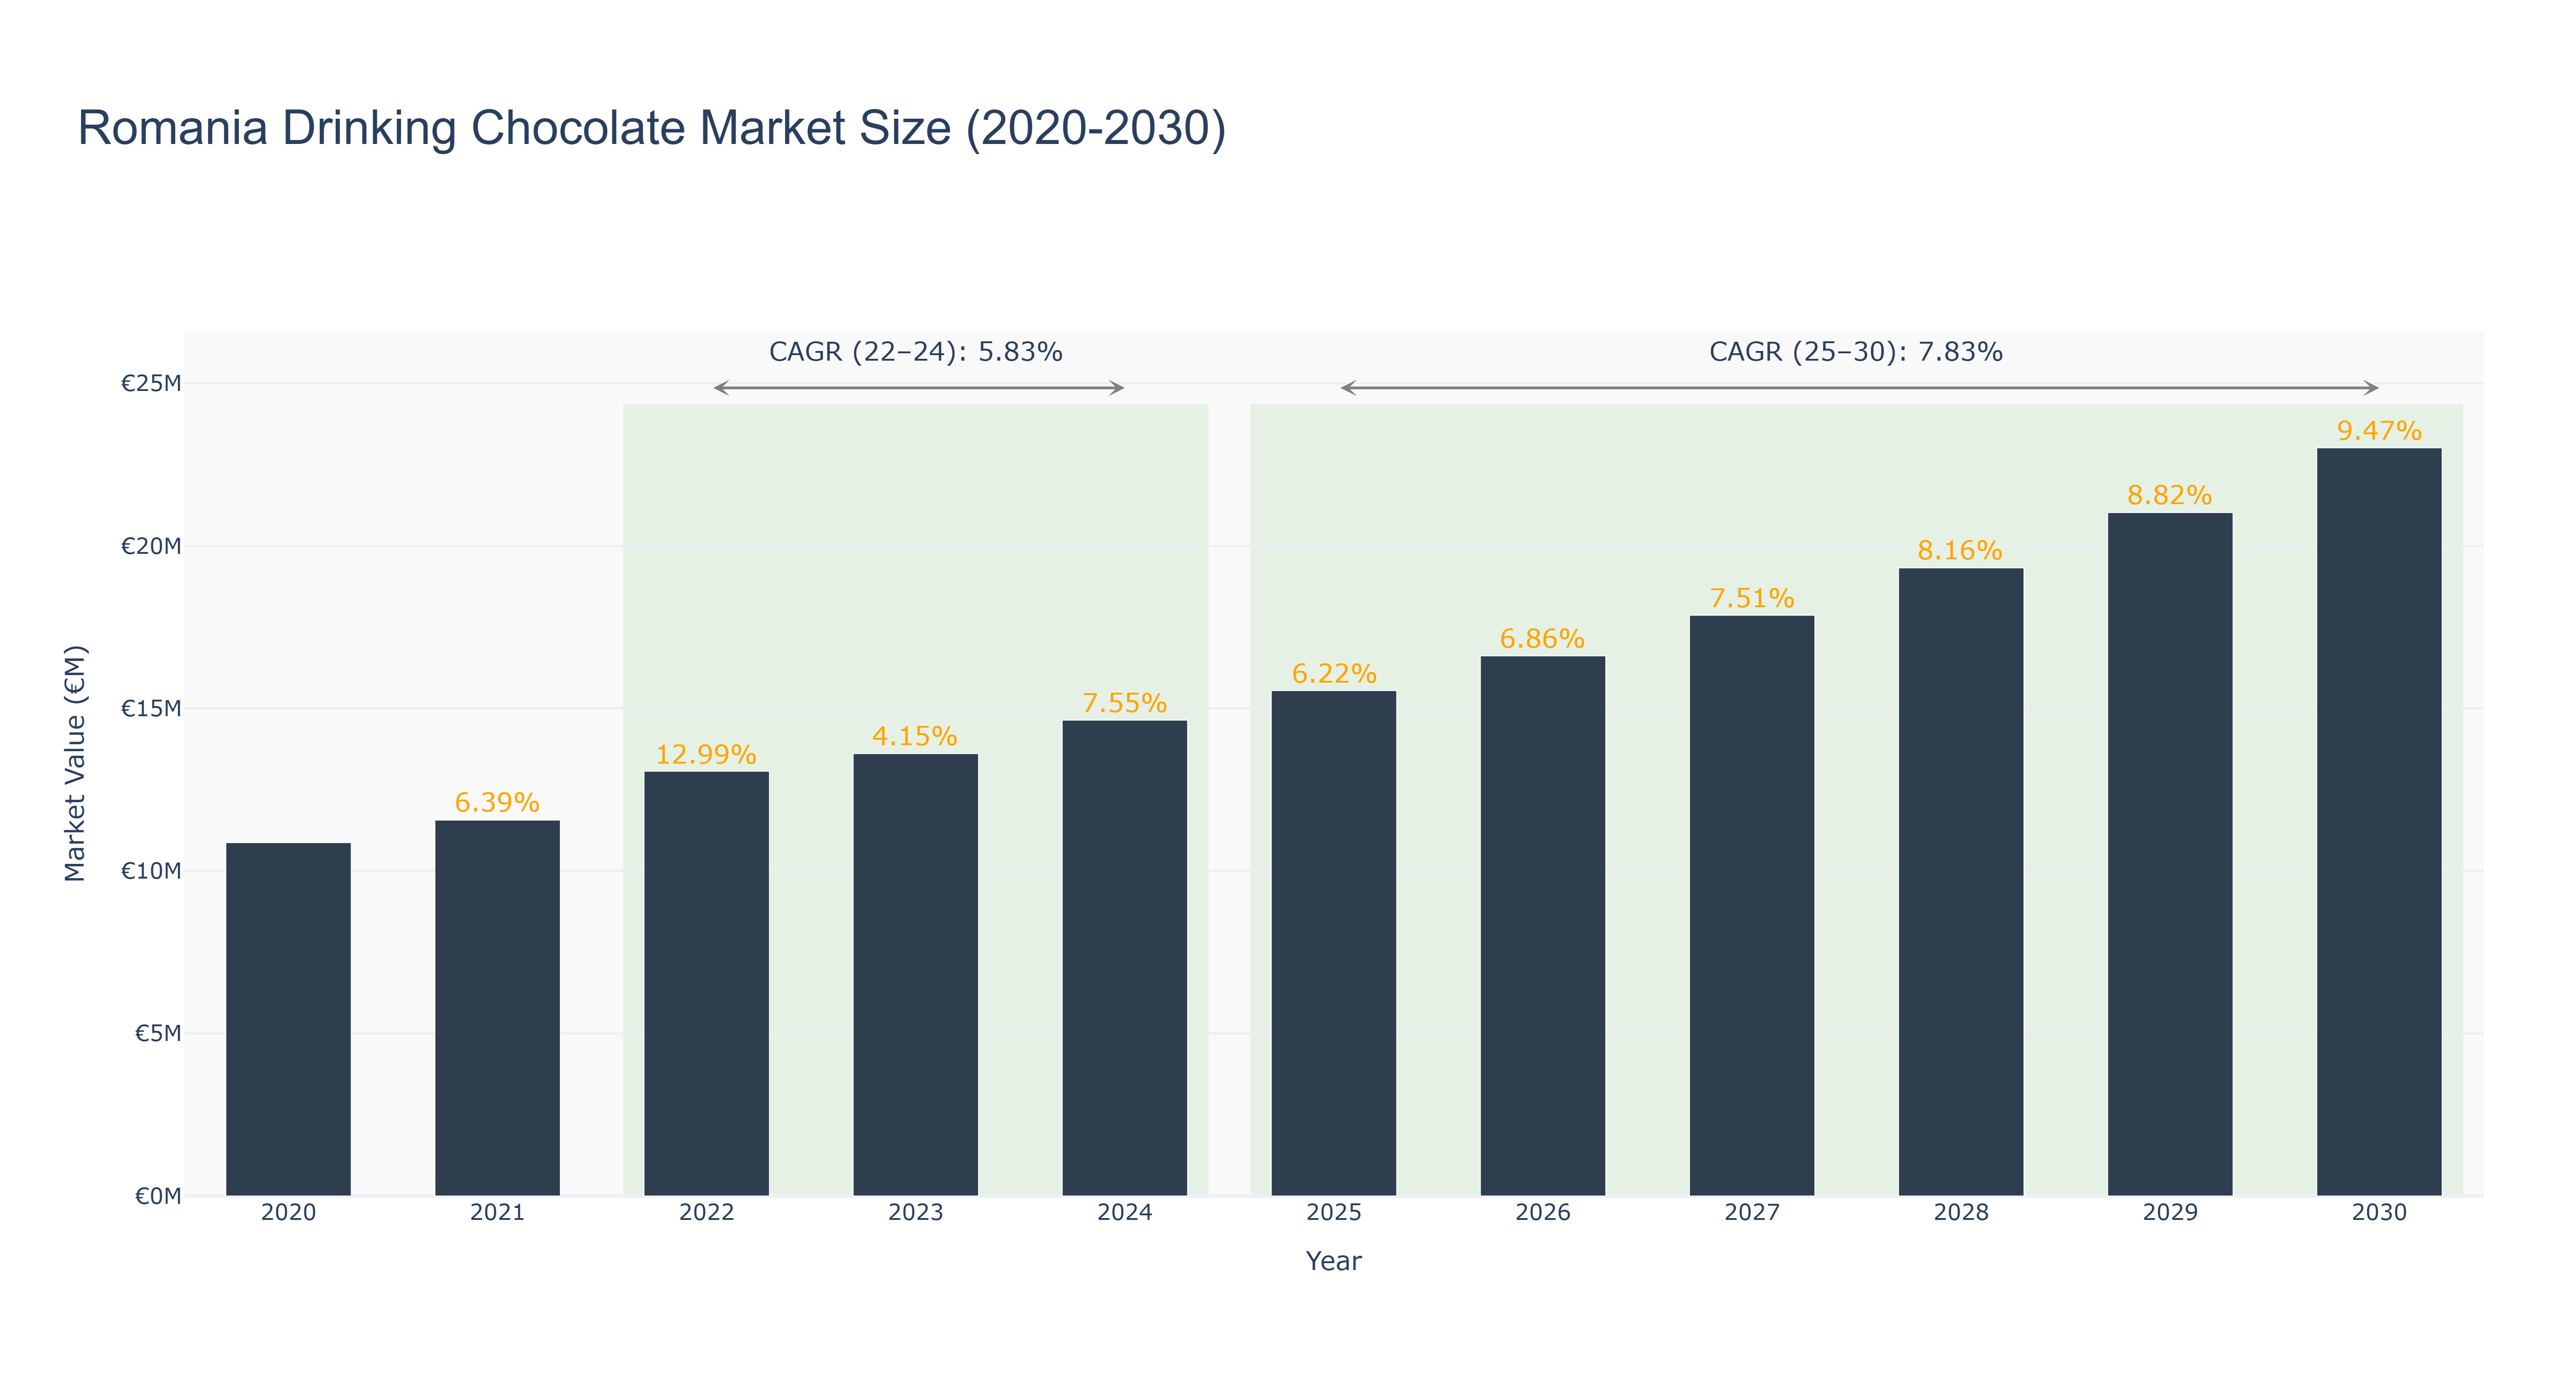
The Romania Drinking Chocolate Market experienced notable growth, peaking at a market size of €14.64 million in 2024, following an actual growth trajectory from €10.87 million in 2020 to €13.61 million in 2023, with a compound annual growth rate (CAGR) of 5.83% from 2022 to 2024. This growth can be attributed to increasing consumer preferences for premium and indulgent products, alongside a rising trend towards comfort food during challenging economic times. Looking ahead, the forecasted period from 2025 to 2030 anticipates a market expansion to €23.02 million, driven by a projected CAGR of 7.83%. Factors such as innovative product offerings, enhanced distribution channels, and growing health consciousness among consumers are expected to propel this growth. Additionally, the market may benefit from upcoming promotional campaigns and sustainability initiatives, which could further enhance consumer engagement and market penetration in the years to come.
Romania Drinking Chocolate Market: Production & Trade Performance (2019-2025)
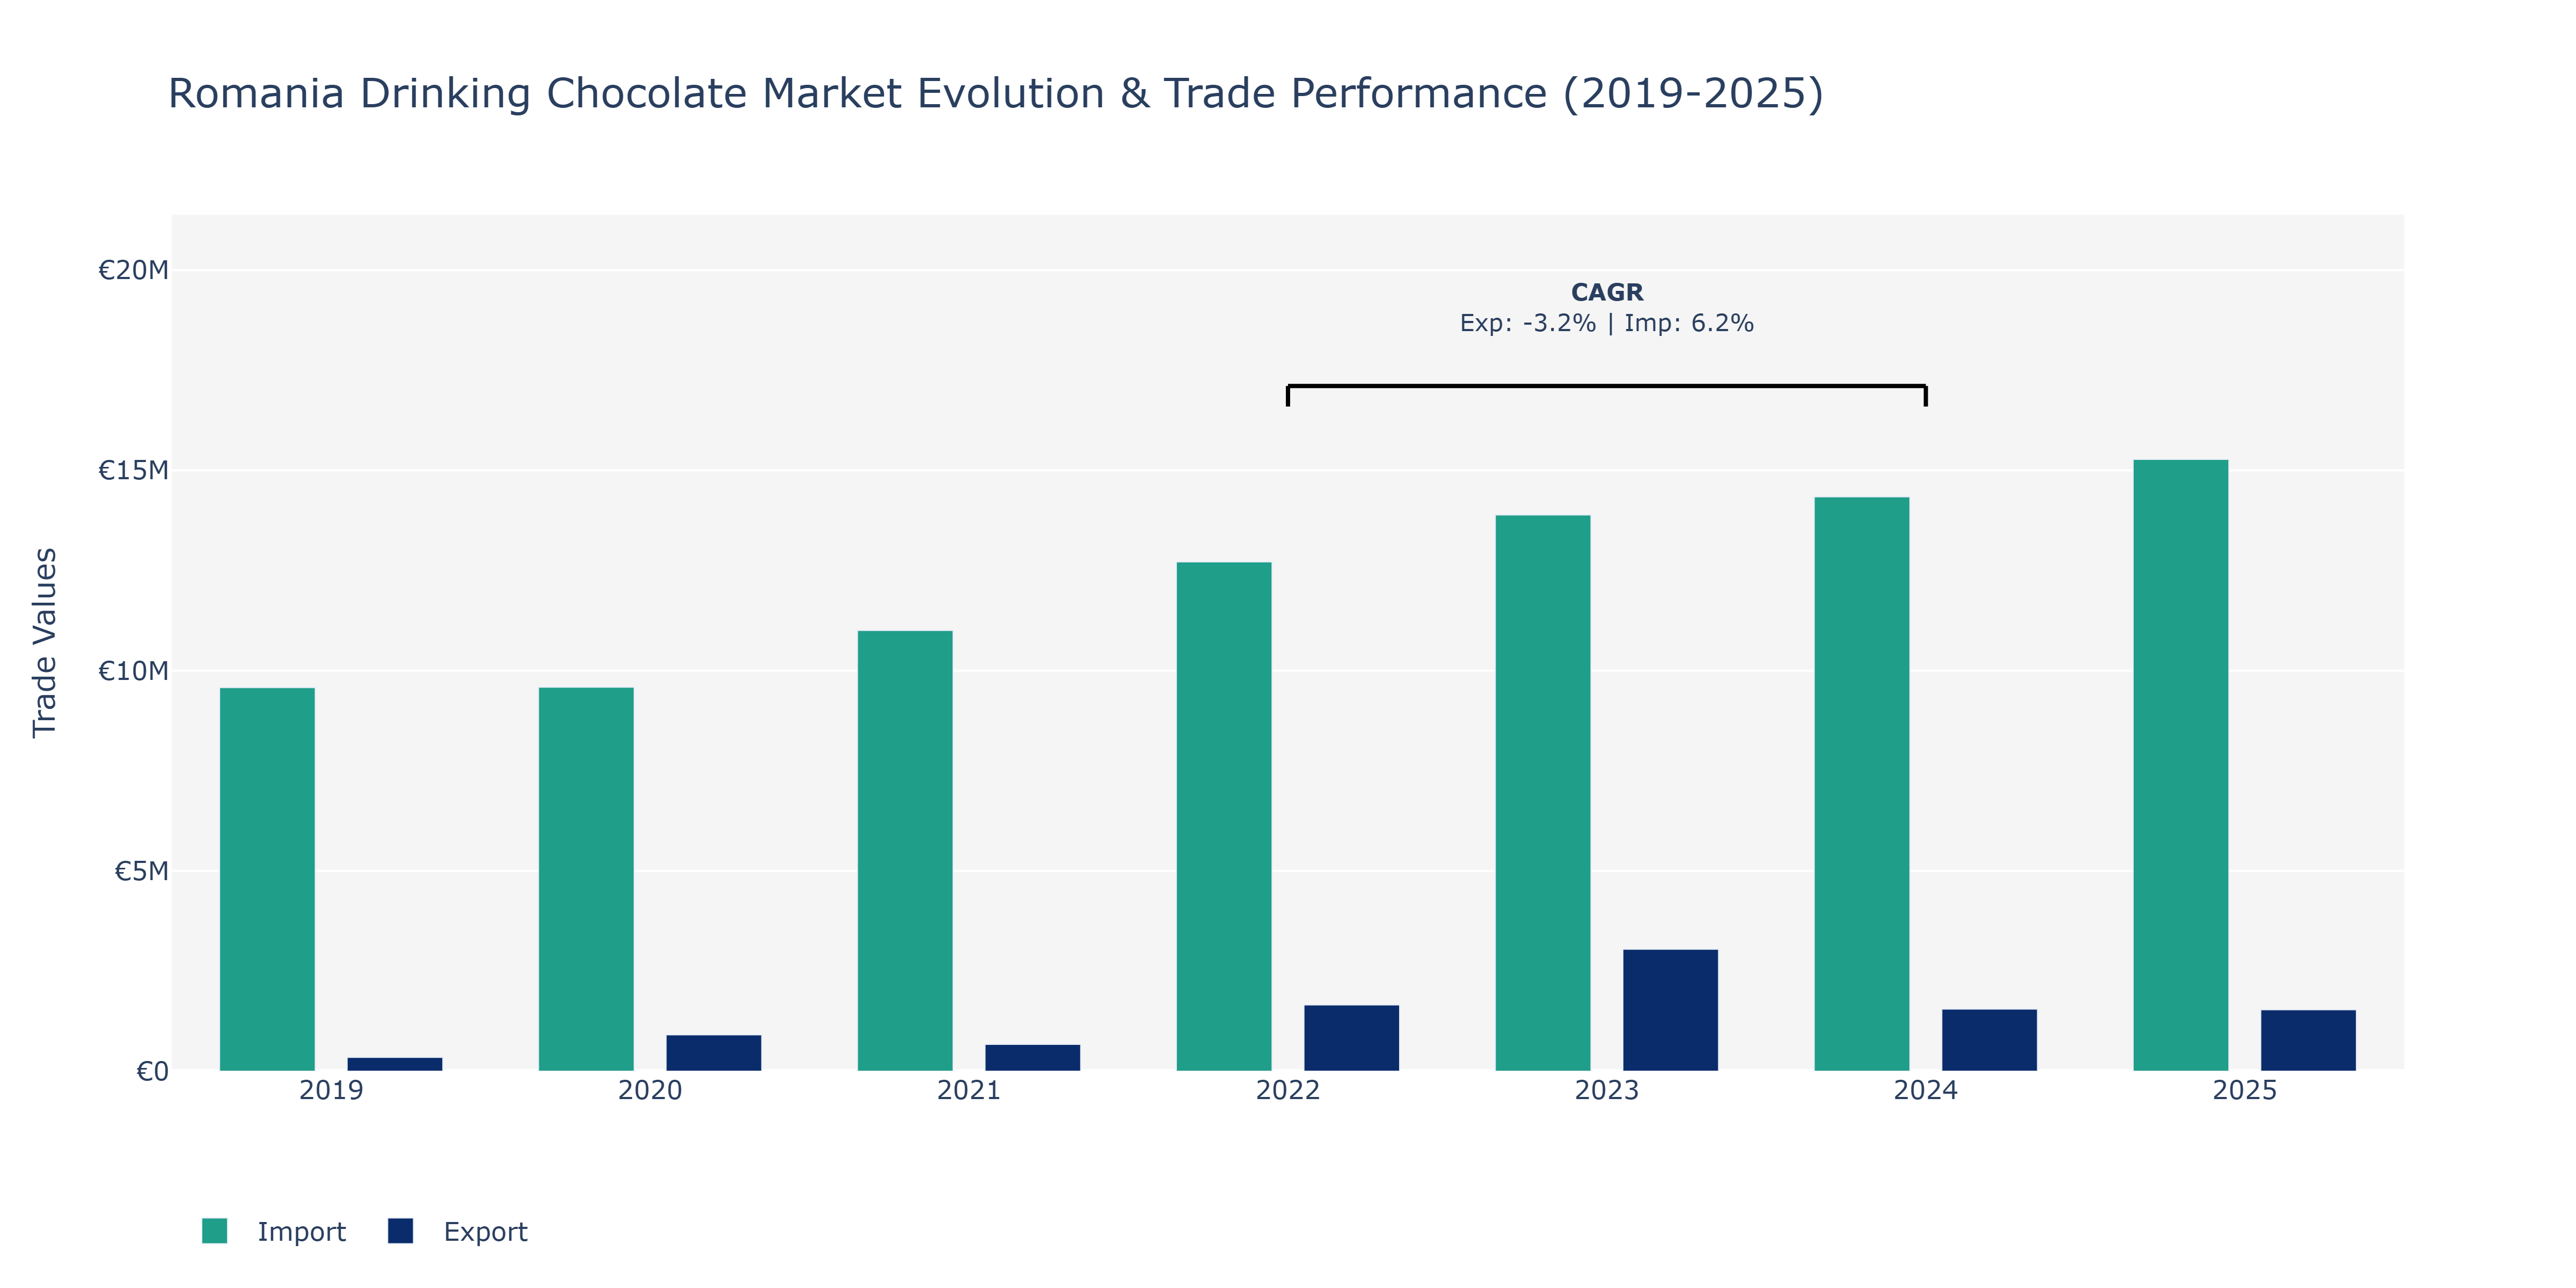
Between 2019 and 2025, Romania's Drinking Chocolate Market showed notable shifts in both Exports and Imports. The data reveals that Exports experienced dramatic growth, starting at €346.39 thousand in 2019, peaking at €3.05 million in 2023, before declining to €1.54 million in 2024 and slightly dropping further in 2025 to €1.54 million. On the Imports side, there was a steady increase in values over the years, rising from €9.58 million in 2019 to €15.28 million in 2025. The surge in Imports could be attributed to the growing demand for premium chocolate products in Romania, possibly influenced by changing consumer preferences towards higher-quality ingredients. Conversely, the fluctuations in Exports might reflect market saturation or shifts in production capacities within the country. These trends suggest a dynamic market landscape with opportunities for domestic producers to cater to the increasing demand for premium chocolate products.
Key Highlights of the Report:
- Romania Drinking Chocolate Market Outlook
- Market Size of Romania Drinking Chocolate Market, 2025
- Forecast of Romania Drinking Chocolate Market, 2032
- Historical Data and Forecast of Romania Drinking Chocolate Revenues & Volume for the Period 2022-2032F
- Romania Drinking Chocolate Market Trend Evolution
- Romania Drinking Chocolate Market Drivers and Challenges
- Romania Drinking Chocolate Price Trends
- Romania Drinking Chocolate Porter's Five Forces
- Romania Drinking Chocolate Industry Life Cycle
- Historical Data and Forecast of Romania Drinking Chocolate Market Revenues & Volume By Type for the Period 2022-2032F
- Historical Data and Forecast of Romania Drinking Chocolate Market Revenues & Volume By Dark chocolate for the Period 2022-2032F
- Historical Data and Forecast of Romania Drinking Chocolate Market Revenues & Volume By Milk chocolate for the Period 2022-2032F
- Historical Data and Forecast of Romania Drinking Chocolate Market Revenues & Volume By White for the Period 2022-2032F
- Historical Data and Forecast of Romania Drinking Chocolate Market Revenues & Volume By Cocoa content for the Period 2022-2032F
- Historical Data and Forecast of Romania Drinking Chocolate Market Revenues & Volume By 60-90% for the Period 2022-2032F
- Historical Data and Forecast of Romania Drinking Chocolate Market Revenues & Volume By 40-60% for the Period 2022-2032F
- Historical Data and Forecast of Romania Drinking Chocolate Market Revenues & Volume By 30-40% for the Period 2022-2032F
- Historical Data and Forecast of Romania Drinking Chocolate Market Revenues & Volume By Others for the Period 2022-2032F
- Historical Data and Forecast of Romania Drinking Chocolate Market Revenues & Volume By Distribution channel for the Period 2022-2032F
- Historical Data and Forecast of Romania Drinking Chocolate Market Revenues & Volume By Hypermarkets/supermarkets for the Period 2022-2032F
- Historical Data and Forecast of Romania Drinking Chocolate Market Revenues & Volume By Specialty store for the Period 2022-2032F
- Historical Data and Forecast of Romania Drinking Chocolate Market Revenues & Volume By Convenience stores for the Period 2022-2032F
- Historical Data and Forecast of Romania Drinking Chocolate Market Revenues & Volume By Online store for the Period 2022-2032F
- Historical Data and Forecast of Romania Drinking Chocolate Market Revenues & Volume By Other for the Period 2022-2032F
- Historical Data and Forecast of Romania Drinking Chocolate Market Revenues & Volume By Application for the Period 2022-2032F
- Historical Data and Forecast of Romania Drinking Chocolate Market Revenues & Volume By Chocolate Drinks for the Period 2022-2032F
- Historical Data and Forecast of Romania Drinking Chocolate Market Revenues & Volume By Protein Shakes for the Period 2022-2032F
- Historical Data and Forecast of Romania Drinking Chocolate Market Revenues & Volume By Energy Drinks for the Period 2022-2032F
- Historical Data and Forecast of Romania Drinking Chocolate Market Revenues & Volume By Coffee Mixes for the Period 2022-2032F
- Historical Data and Forecast of Romania Drinking Chocolate Market Revenues & Volume By Others for the Period 2022-2032F
- Historical Data and Forecast of Romania Drinking Chocolate Market Revenues & Volume By Flavour for the Period 2022-2032F
- Historical Data and Forecast of Romania Drinking Chocolate Market Revenues & Volume By Vanilla for the Period 2022-2032F
- Historical Data and Forecast of Romania Drinking Chocolate Market Revenues & Volume By Caramel for the Period 2022-2032F
- Historical Data and Forecast of Romania Drinking Chocolate Market Revenues & Volume By Honey for the Period 2022-2032F
- Historical Data and Forecast of Romania Drinking Chocolate Market Revenues & Volume By Hazelnut for the Period 2022-2032F
- Historical Data and Forecast of Romania Drinking Chocolate Market Revenues & Volume By Form for the Period 2022-2032F
- Historical Data and Forecast of Romania Drinking Chocolate Market Revenues & Volume By Powder for the Period 2022-2032F
- Historical Data and Forecast of Romania Drinking Chocolate Market Revenues & Volume By Liquid for the Period 2022-2032F
- Historical Data and Forecast of Romania Drinking Chocolate Market Revenues & Volume By Target customers for the Period 2022-2032F
- Historical Data and Forecast of Romania Drinking Chocolate Market Revenues & Volume By Adults for the Period 2022-2032F
- Historical Data and Forecast of Romania Drinking Chocolate Market Revenues & Volume By Kids for the Period 2022-2032F
- Historical Data and Forecast of Romania Drinking Chocolate Market Revenues & Volume By End users for the Period 2022-2032F
- Historical Data and Forecast of Romania Drinking Chocolate Market Revenues & Volume By Food Service Providers for the Period 2022-2032F
- Historical Data and Forecast of Romania Drinking Chocolate Market Revenues & Volume By Household/Domestic for the Period 2022-2032F
- Historical Data and Forecast of Romania Drinking Chocolate Market Revenues & Volume By Corporates for the Period 2022-2032F
- Historical Data and Forecast of Romania Drinking Chocolate Market Revenues & Volume By Airlines for the Period 2022-2032F
- Romania Drinking Chocolate Import Export Trade Statistics
- Market Opportunity Assessment By Type
- Market Opportunity Assessment By Cocoa content
- Market Opportunity Assessment By Distribution channel
- Market Opportunity Assessment By Application
- Market Opportunity Assessment By Flavour
- Market Opportunity Assessment By Form
- Market Opportunity Assessment By Target customers
- Market Opportunity Assessment By End users
- Romania Drinking Chocolate Top Companies Market Share
- Romania Drinking Chocolate Competitive Benchmarking By Technical and Operational Parameters
- Romania Drinking Chocolate Company Profiles
- Romania Drinking Chocolate Key Strategic Recommendations
Frequently Asked Questions About the Market Study (FAQs):
6Wresearch actively monitors the Romania Drinking Chocolate Market and publishes its comprehensive annual report, highlighting emerging trends, growth drivers, revenue analysis, and forecast outlook. Our insights help businesses to make data-backed strategic decisions with ongoing market dynamics. Our analysts track relevent industries related to the Romania Drinking Chocolate Market, allowing our clients with actionable intelligence and reliable forecasts tailored to emerging regional needs.
Yes, we provide customisation as per your requirements. To learn more, feel free to contact us on sales@6wresearch.com
1 Executive Summary |
2 Introduction |
2.1 Key Highlights of the Report |
2.2 Report Description |
2.3 Market Scope & Segmentation |
2.4 Research Methodology |
2.5 Assumptions |
3 Romania Drinking Chocolate Market Overview |
3.1 Romania Country Macro Economic Indicators |
3.2 Romania Drinking Chocolate Market Revenues & Volume, 2022 & 2032F |
3.3 Romania Drinking Chocolate Market - Industry Life Cycle |
3.4 Romania Drinking Chocolate Market - Porter's Five Forces |
3.5 Romania Drinking Chocolate Market Revenues & Volume Share, By Type, 2022 & 2032F |
3.6 Romania Drinking Chocolate Market Revenues & Volume Share, By Cocoa content, 2022 & 2032F |
3.7 Romania Drinking Chocolate Market Revenues & Volume Share, By Distribution channel, 2022 & 2032F |
3.8 Romania Drinking Chocolate Market Revenues & Volume Share, By Application, 2022 & 2032F |
3.9 Romania Drinking Chocolate Market Revenues & Volume Share, By Flavour, 2022 & 2032F |
3.10 Romania Drinking Chocolate Market Revenues & Volume Share, By Form, 2022 & 2032F |
3.11 Romania Drinking Chocolate Market Revenues & Volume Share, By Target customers, 2022 & 2032F |
4 Romania Drinking Chocolate Market Dynamics |
4.1 Impact Analysis |
4.2 Market Drivers |
4.2.1 Increasing consumer awareness about the health benefits of drinking chocolate |
4.2.2 Growing demand for premium and artisanal drinking chocolate products |
4.2.3 Rising disposable income leading to higher spending on indulgent food and beverages |
4.3 Market Restraints |
4.3.1 Fluctuating prices of cocoa and other raw materials impacting production costs |
4.3.2 Intense competition from other hot beverage options like coffee and tea |
4.3.3 Stringent regulations and labeling requirements affecting product development and marketing |
5 Romania Drinking Chocolate Market Trends |
6 Romania Drinking Chocolate Market, By Types |
6.1 Romania Drinking Chocolate Market, By Type |
6.1.1 Overview and Analysis |
6.1.2 Romania Drinking Chocolate Market Revenues & Volume, By Type, 2022-2032F |
6.1.3 Romania Drinking Chocolate Market Revenues & Volume, By Dark chocolate, 2022-2032F |
6.1.4 Romania Drinking Chocolate Market Revenues & Volume, By Milk chocolate, 2022-2032F |
6.1.5 Romania Drinking Chocolate Market Revenues & Volume, By White, 2022-2032F |
6.2 Romania Drinking Chocolate Market, By Cocoa content |
6.2.1 Overview and Analysis |
6.2.2 Romania Drinking Chocolate Market Revenues & Volume, By 60-90%, 2022-2032F |
6.2.3 Romania Drinking Chocolate Market Revenues & Volume, By 40-60%, 2022-2032F |
6.2.4 Romania Drinking Chocolate Market Revenues & Volume, By 30-40%, 2022-2032F |
6.2.5 Romania Drinking Chocolate Market Revenues & Volume, By Others, 2022-2032F |
6.3 Romania Drinking Chocolate Market, By Distribution channel |
6.3.1 Overview and Analysis |
6.3.2 Romania Drinking Chocolate Market Revenues & Volume, By Hypermarkets/supermarkets, 2022-2032F |
6.3.3 Romania Drinking Chocolate Market Revenues & Volume, By Specialty store, 2022-2032F |
6.3.4 Romania Drinking Chocolate Market Revenues & Volume, By Convenience stores, 2022-2032F |
6.3.5 Romania Drinking Chocolate Market Revenues & Volume, By Online store, 2022-2032F |
6.3.6 Romania Drinking Chocolate Market Revenues & Volume, By Other, 2022-2032F |
6.4 Romania Drinking Chocolate Market, By Application |
6.4.1 Overview and Analysis |
6.4.2 Romania Drinking Chocolate Market Revenues & Volume, By Chocolate Drinks, 2022-2032F |
6.4.3 Romania Drinking Chocolate Market Revenues & Volume, By Protein Shakes, 2022-2032F |
6.4.4 Romania Drinking Chocolate Market Revenues & Volume, By Energy Drinks, 2022-2032F |
6.4.5 Romania Drinking Chocolate Market Revenues & Volume, By Coffee Mixes, 2022-2032F |
6.4.6 Romania Drinking Chocolate Market Revenues & Volume, By Others, 2022-2032F |
6.5 Romania Drinking Chocolate Market, By Flavour |
6.5.1 Overview and Analysis |
6.5.2 Romania Drinking Chocolate Market Revenues & Volume, By Vanilla, 2022-2032F |
6.5.3 Romania Drinking Chocolate Market Revenues & Volume, By Caramel, 2022-2032F |
6.5.4 Romania Drinking Chocolate Market Revenues & Volume, By Honey, 2022-2032F |
6.5.5 Romania Drinking Chocolate Market Revenues & Volume, By Hazelnut, 2022-2032F |
6.6 Romania Drinking Chocolate Market, By Form |
6.6.1 Overview and Analysis |
6.6.2 Romania Drinking Chocolate Market Revenues & Volume, By Powder, 2022-2032F |
6.6.3 Romania Drinking Chocolate Market Revenues & Volume, By Liquid, 2022-2032F |
6.7 Romania Drinking Chocolate Market, By Target customers |
6.7.1 Overview and Analysis |
6.7.2 Romania Drinking Chocolate Market Revenues & Volume, By Adults, 2022-2032F |
6.7.3 Romania Drinking Chocolate Market Revenues & Volume, By Kids, 2022-2032F |
6.8 Romania Drinking Chocolate Market, By End users |
6.8.1 Overview and Analysis |
6.8.2 Romania Drinking Chocolate Market Revenues & Volume, By Food Service Providers, 2022-2032F |
6.8.3 Romania Drinking Chocolate Market Revenues & Volume, By Household/Domestic, 2022-2032F |
6.8.4 Romania Drinking Chocolate Market Revenues & Volume, By Airlines, 2022-2032F |
6.8.5 Romania Drinking Chocolate Market Revenues & Volume, By Airlines, 2022-2032F |
7 Romania Drinking Chocolate Market Import-Export Trade Statistics |
7.1 Romania Drinking Chocolate Market Export to Major Countries |
7.2 Romania Drinking Chocolate Market Imports from Major Countries |
8 Romania Drinking Chocolate Market Key Performance Indicators |
8.1 Consumer engagement on social media platforms for drinking chocolate brands |
8.2 Number of new product launches and innovations in the drinking chocolate market |
8.3 Growth in online sales and distribution channels for drinking chocolate products |
9 Romania Drinking Chocolate Market - Opportunity Assessment |
9.1 Romania Drinking Chocolate Market Opportunity Assessment, By Type, 2022 & 2032F |
9.2 Romania Drinking Chocolate Market Opportunity Assessment, By Cocoa content, 2022 & 2032F |
9.3 Romania Drinking Chocolate Market Opportunity Assessment, By Distribution channel, 2022 & 2032F |
9.4 Romania Drinking Chocolate Market Opportunity Assessment, By Application, 2022 & 2032F |
9.5 Romania Drinking Chocolate Market Opportunity Assessment, By Flavour, 2022 & 2032F |
9.6 Romania Drinking Chocolate Market Opportunity Assessment, By Form, 2022 & 2032F |
9.7 Romania Drinking Chocolate Market Opportunity Assessment, By Target customers, 2022 & 2032F |
9.7 Romania Drinking Chocolate Market Opportunity Assessment, By End users, 2022 & 2032F |
10 Romania Drinking Chocolate Market - Competitive Landscape |
10.1 Romania Drinking Chocolate Market Revenue Share, By Companies, 2025 |
10.2 Romania Drinking Chocolate Market Competitive Benchmarking, By Operating and Technical Parameters |
11 Company Profiles |
12 Recommendations |
13 Disclaimer |
Global Go To Market Strategy - 2030
Export potential enables firms to identify high-growth global markets with greater confidence by combining advanced trade intelligence with a structured quantitative methodology. The framework analyzes emerging demand trends and country-level import patterns while integrating macroeconomic and trade datasets such as GDP and population forecasts, bilateral import–export flows, tariff structures, elasticity differentials between developed and developing economies, geographic distance, and import demand projections. Using weighted trade values from 2020–2024 as the base period to project country-to-country export potential for 2030, these inputs are operationalized through calculated drivers such as gravity model parameters, tariff impact factors, and projected GDP per-capita growth. Through an analysis of hidden potentials, demand hotspots, and market conditions that are most favorable to success, this method enables firms to focus on target countries, maximize returns, and global expansion with data, backed by accuracy.
By factoring in the projected importer demand gap that is currently unmet and could be potential opportunity, it identifies the potential for the Exporter (Country) among 190 countries, against the general trade analysis, which identifies the biggest importer or exporter.
To discover high-growth global markets and optimize your business strategy:
Click Here
Pricing
- Single User License$ 1,995
- Department License$ 2,400
- Site License$ 3,120
- Global License$ 3,795

Leadership Perspectives from Industry Events
Search
Thought Leadership and Analyst Meet


Our Clients
6WResearch In News
- India Export Attractiveness Tracker 2026
- India Air Conditioner Market Set for Strong Rebound in 2026 After Weather-Led Correction and GST-Driven Recovery: 6Wresearch
- ADAS in India: How Automatic Emergency Braking, Blind Spot Detection & Driver Monitoring are Transforming Road Safety
- Doha a strategic location for EV manufacturing hub: IPA Qatar
- Demand for luxury TVs surging in the GCC, says Samsung
- Empowering Growth: The Thriving Journey of Bangladesh’s Cable Industry
Latest Reports
- Qatar Access and Home Network Market (2026-2032)
- Nicaragua RPG Gaming Market (2026-2032)
- New Zealand RPG Gaming Market (2026-2032)
- Netherlands RPG Gaming Market (2026-2032)
- Nauru RPG Gaming Market (2026-2032)
- Namibia RPG Gaming Market (2026-2032)
- Mozambique RPG Gaming Market (2026-2032)
- Montenegro RPG Gaming Market (2026-2032)
- Mongolia RPG Gaming Market (2026-2032)
- Monaco RPG Gaming Market (2026-2032)
Industry Events and Analyst Meet

EV India Expo 2026

HIMTEX 2026

India Refining Summit 2026

India EV Show 2026

EV tech India Expo 2026
Whitepaper
- Middle East & Africa Commercial Security Market Click here to view more.
- Middle East & Africa Fire Safety Systems & Equipment Market Click here to view more.
- GCC Drone Market Click here to view more.
- Middle East Lighting Fixture Market Click here to view more.
- GCC Physical & Perimeter Security Market Click here to view more.