Lithuania Dyes Market (2026-2032) | Value, Industry, Analysis, Share, Competitive Landscape, Forecast, Companies, Size & Revenue, Growth, Segmentation, Outlook, Trends
Market Forecast By Product Type (Reactive Dyes, Disperse Dyes, Vat Dyes, Direct Dyes, Acid Dyes, Other Dyes), By Application (Textile, Leather, Paper, Printing Inks, Other) And Competitive Landscape
| Product Code: ETC8039630 | Publication Date: Sep 2024 | Updated Date: Apr 2026 | Product Type: Market Research Report | |
| Publisher: 6Wresearch | Author: Vasudha | No. of Pages: 75 | No. of Figures: 35 | No. of Tables: 20 |
Lithuania Dyes Market Size (2020-2030)
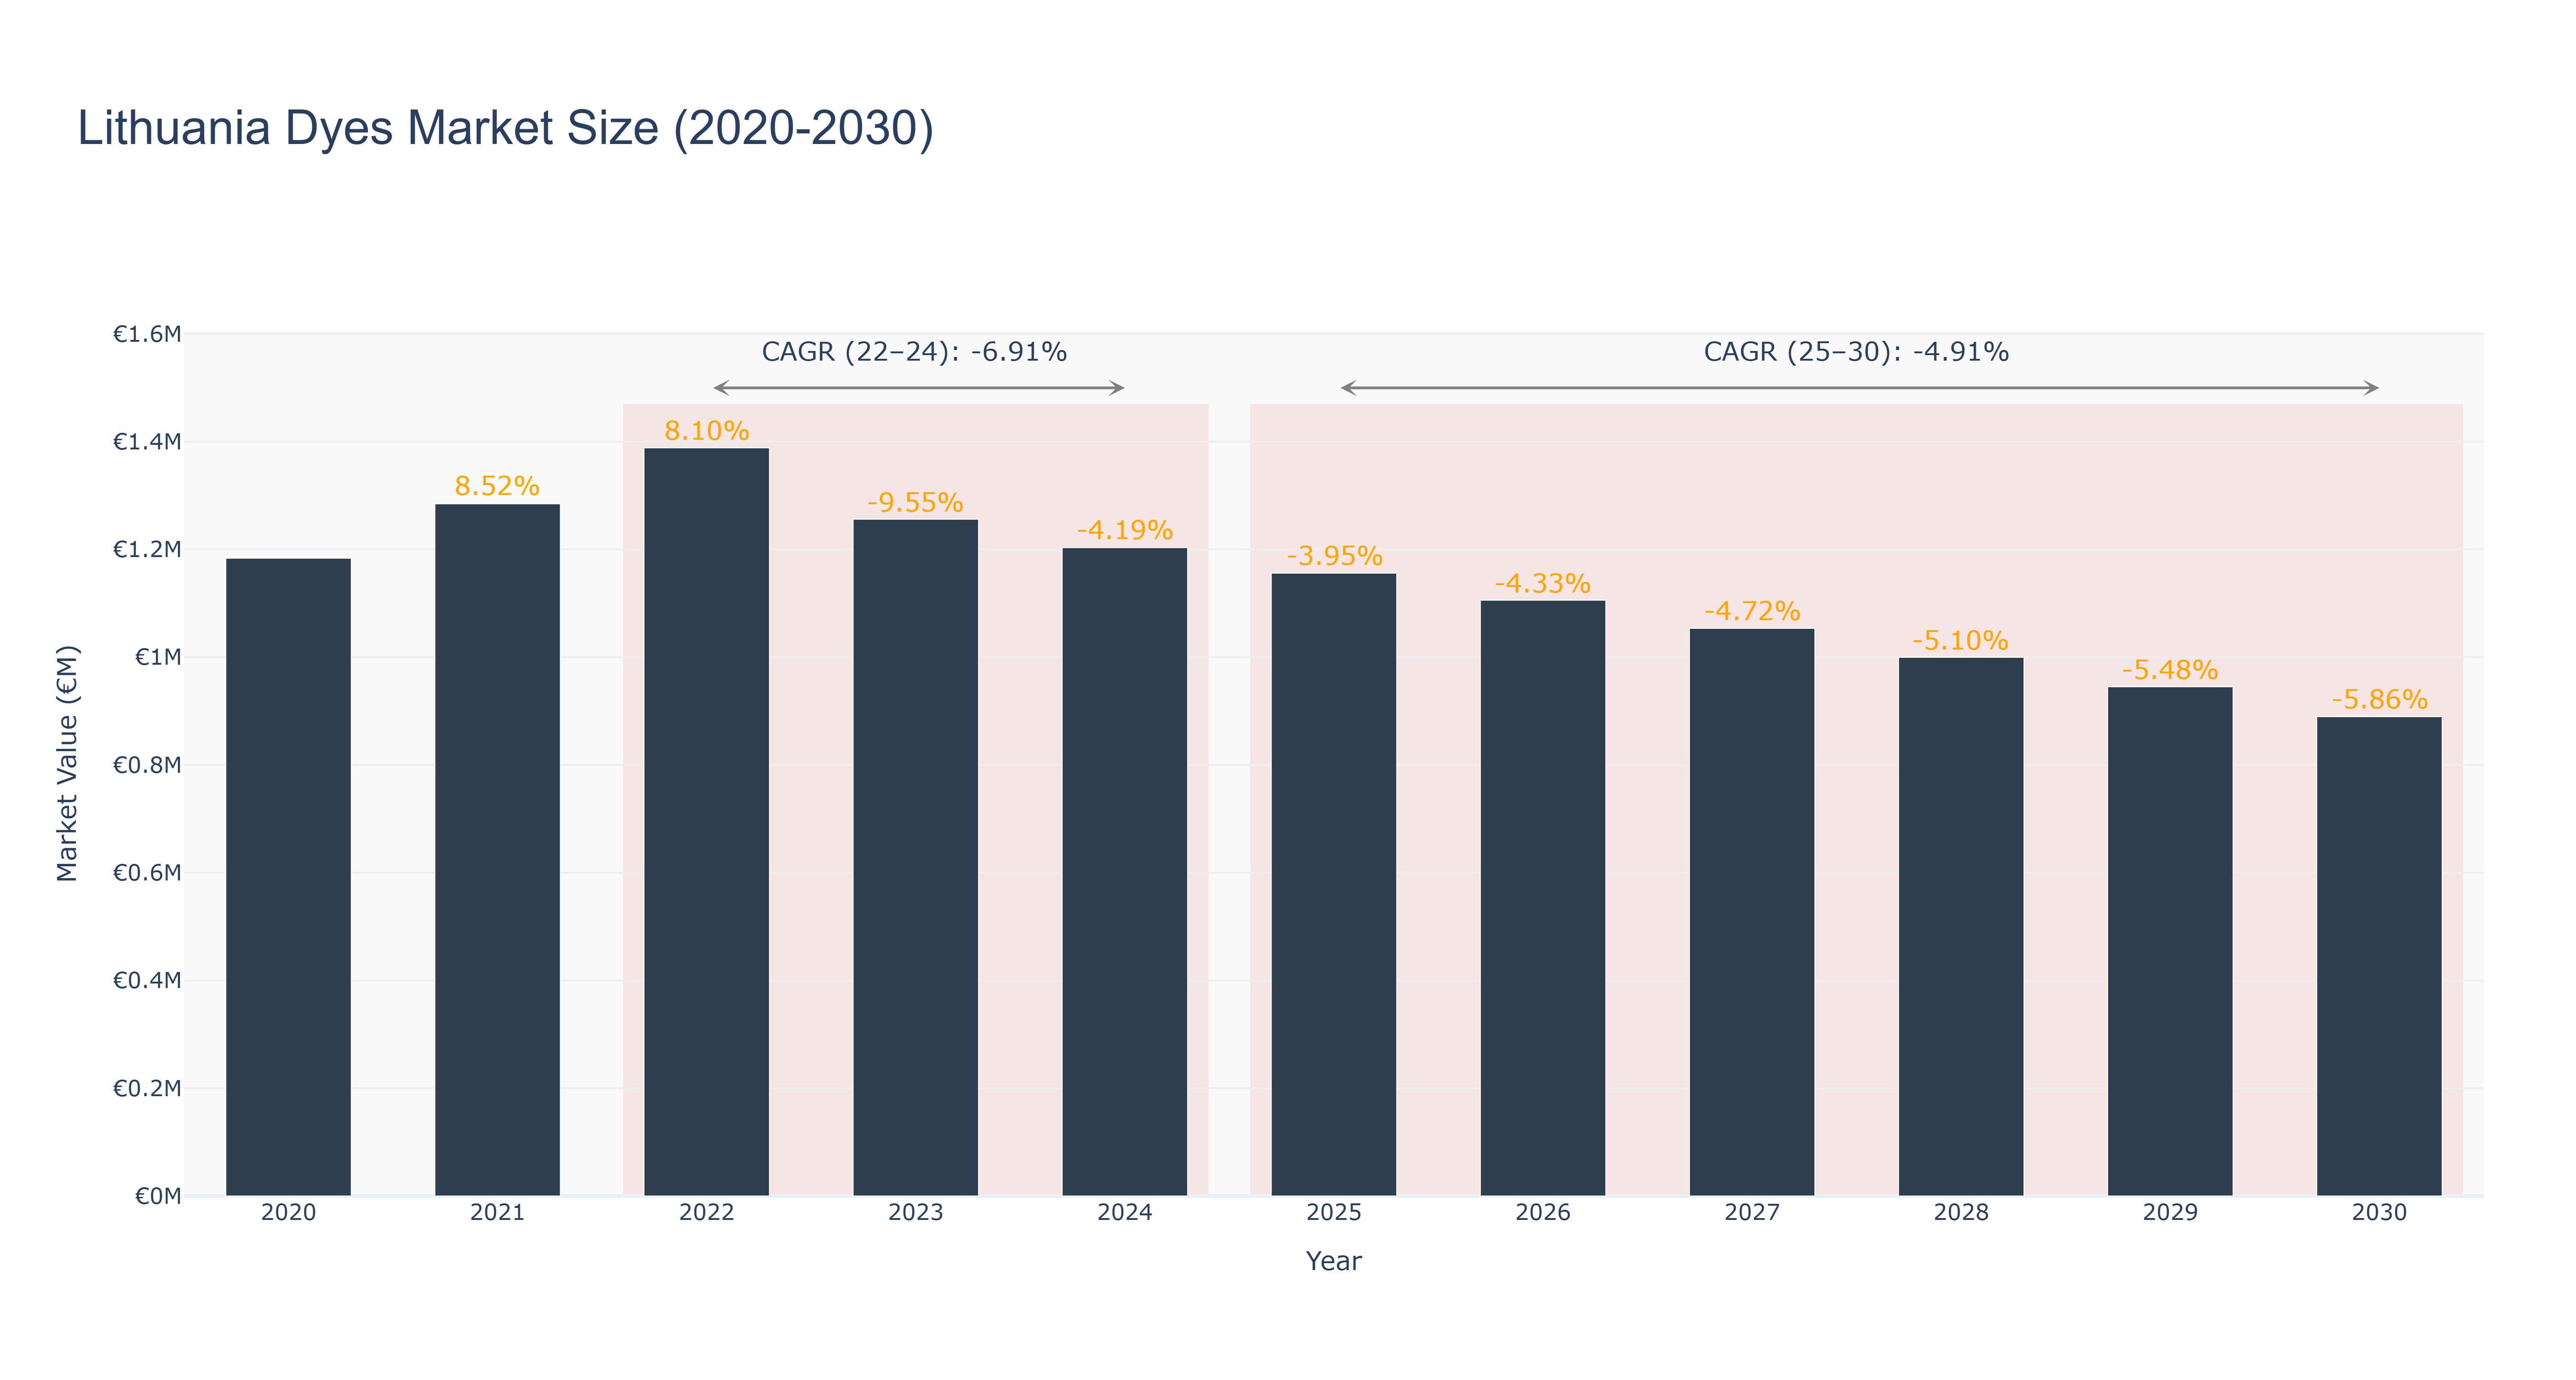
The Lithuania Dyes Market has shown a downward trend in recent years. The peak market size of €1.39 million was recorded in 2022, with a subsequent decline to €0.94 million in 2029. The market is forecasted to further decrease to €0.89 million by 2030, with a CAGR of -4.91% from 2025 to 2030. The decline can be attributed to factors such as changing consumer preferences, increasing competition, and economic uncertainties. The market is actively seeking innovative solutions to revitalize growth, with upcoming projects focusing on sustainable and eco-friendly dyeing processes. Industry drivers include environmental regulations, technological advancements, and shifting market dynamics. Moving forward, the market's success will depend on its ability to adapt to changing trends and embrace sustainable practices to meet consumer demands.
Lithuania Dyes Market: Production & Trade Performance (2019-2025)
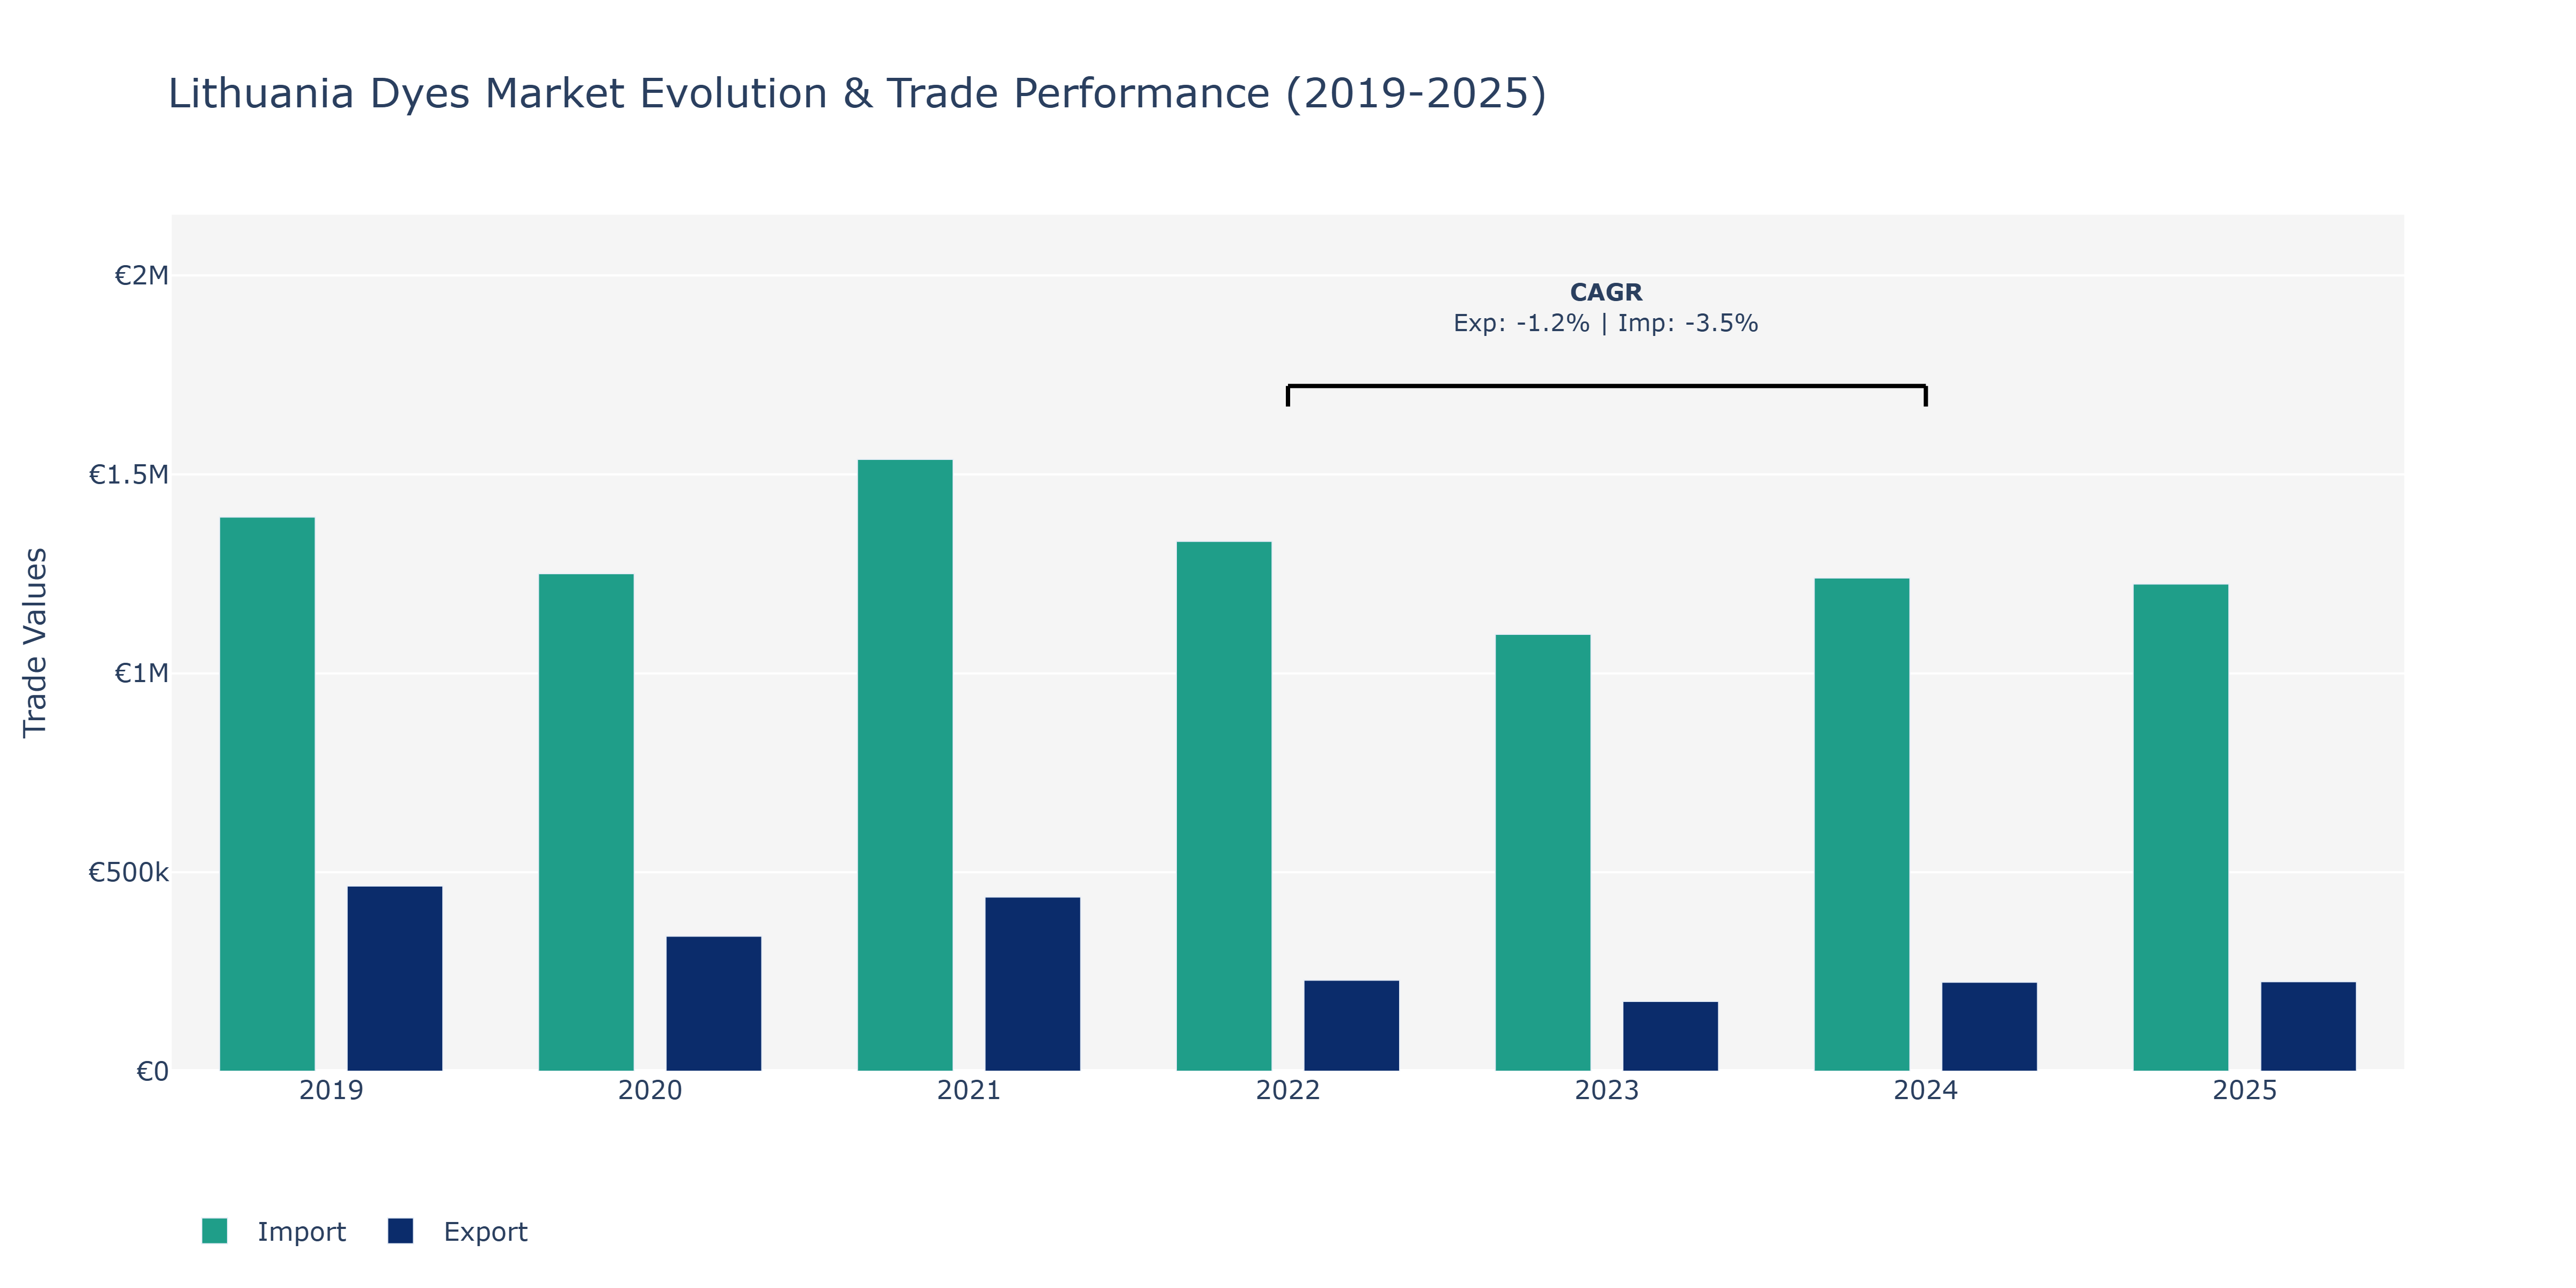
Between 2019 and 2025, Lithuania's Dyes Market experienced notable fluctuations in both exports and imports. In 2019, exports stood at €465.56 thousand, dropping to €339.15 thousand in 2020 before rebounding to €437.84 thousand in 2021. The trend reversed again in the following years, with exports declining to €175.22 thousand in 2023, before recovering slightly in 2024 to €223.43 thousand, and reaching €224.91 thousand in 2025. Imports followed a similar pattern, starting at €1.39 million in 2019 and fluctuating until 2025, where they totaled €1.22 million. The decrease in exports and imports in 2023 could be attributed to various factors, such as global economic conditions impacting consumer demand for dyes or fluctuations in raw material prices affecting production costs. The recovery in 2024 and 2025 might be linked to strategic market positioning efforts by Lithuanian dye manufacturers to enhance competitiveness and expand their market reach, aligning with the industry's overall recovery post-2020 disruptions.
Key Highlights of the Report:
- Lithuania Dyes Market Outlook
- Market Size of Lithuania Dyes Market, 2025
- Forecast of Lithuania Dyes Market, 2032
- Historical Data and Forecast of Lithuania Dyes Revenues & Volume for the Period 2022 - 2032
- Lithuania Dyes Market Trend Evolution
- Lithuania Dyes Market Drivers and Challenges
- Lithuania Dyes Price Trends
- Lithuania Dyes Porter's Five Forces
- Lithuania Dyes Industry Life Cycle
- Historical Data and Forecast of Lithuania Dyes Market Revenues & Volume By Product Type for the Period 2022 - 2032
- Historical Data and Forecast of Lithuania Dyes Market Revenues & Volume By Reactive Dyes for the Period 2022 - 2032
- Historical Data and Forecast of Lithuania Dyes Market Revenues & Volume By Disperse Dyes for the Period 2022 - 2032
- Historical Data and Forecast of Lithuania Dyes Market Revenues & Volume By Vat Dyes for the Period 2022 - 2032
- Historical Data and Forecast of Lithuania Dyes Market Revenues & Volume By Direct Dyes for the Period 2022 - 2032
- Historical Data and Forecast of Lithuania Dyes Market Revenues & Volume By Acid Dyes for the Period 2022 - 2032
- Historical Data and Forecast of Lithuania Dyes Market Revenues & Volume By Other Dyes for the Period 2022 - 2032
- Historical Data and Forecast of Lithuania Dyes Market Revenues & Volume By Application for the Period 2022 - 2032
- Historical Data and Forecast of Lithuania Dyes Market Revenues & Volume By Textile for the Period 2022 - 2032
- Historical Data and Forecast of Lithuania Dyes Market Revenues & Volume By Leather for the Period 2022 - 2032
- Historical Data and Forecast of Lithuania Dyes Market Revenues & Volume By Paper for the Period 2022 - 2032
- Historical Data and Forecast of Lithuania Dyes Market Revenues & Volume By Printing Inks for the Period 2022 - 2032
- Historical Data and Forecast of Lithuania Dyes Market Revenues & Volume By Other for the Period 2022 - 2032
- Lithuania Dyes Import Export Trade Statistics
- Market Opportunity Assessment By Product Type
- Market Opportunity Assessment By Application
- Lithuania Dyes Top Companies Market Share
- Lithuania Dyes Competitive Benchmarking By Technical and Operational Parameters
- Lithuania Dyes Company Profiles
- Lithuania Dyes Key Strategic Recommendations
Frequently Asked Questions About the Market Study (FAQs):
6Wresearch actively monitors the Lithuania Dyes Market and publishes its comprehensive annual report, highlighting emerging trends, growth drivers, revenue analysis, and forecast outlook. Our insights help businesses to make data-backed strategic decisions with ongoing market dynamics. Our analysts track relevent industries related to the Lithuania Dyes Market, allowing our clients with actionable intelligence and reliable forecasts tailored to emerging regional needs.
Yes, we provide customisation as per your requirements. To learn more, feel free to contact us on sales@6wresearch.com
1 Executive Summary |
2 Introduction |
2.1 Key Highlights of the Report |
2.2 Report Description |
2.3 Market Scope & Segmentation |
2.4 Research Methodology |
2.5 Assumptions |
3 Lithuania Dyes Market Overview |
3.1 Lithuania Country Macro Economic Indicators |
3.2 Lithuania Dyes Market Revenues & Volume, 2022 & 2032F |
3.3 Lithuania Dyes Market - Industry Life Cycle |
3.4 Lithuania Dyes Market - Porter's Five Forces |
3.5 Lithuania Dyes Market Revenues & Volume Share, By Product Type, 2022 & 2032F |
3.6 Lithuania Dyes Market Revenues & Volume Share, By Application, 2022 & 2032F |
4 Lithuania Dyes Market Dynamics |
4.1 Impact Analysis |
4.2 Market Drivers |
4.2.1 Increasing demand for eco-friendly and sustainable dyes in Lithuania |
4.2.2 Growth in the textile and leather industries in Lithuania |
4.2.3 Innovation in dye technologies leading to improved product performance |
4.3 Market Restraints |
4.3.1 Fluctuating raw material prices impacting production costs |
4.3.2 Stringent environmental regulations affecting the use of certain dyes in Lithuania |
5 Lithuania Dyes Market Trends |
6 Lithuania Dyes Market, By Types |
6.1 Lithuania Dyes Market, By Product Type |
6.1.1 Overview and Analysis |
6.1.2 Lithuania Dyes Market Revenues & Volume, By Product Type, 2022 - 2032F |
6.1.3 Lithuania Dyes Market Revenues & Volume, By Reactive Dyes, 2022 - 2032F |
6.1.4 Lithuania Dyes Market Revenues & Volume, By Disperse Dyes, 2022 - 2032F |
6.1.5 Lithuania Dyes Market Revenues & Volume, By Vat Dyes, 2022 - 2032F |
6.1.6 Lithuania Dyes Market Revenues & Volume, By Direct Dyes, 2022 - 2032F |
6.1.7 Lithuania Dyes Market Revenues & Volume, By Acid Dyes, 2022 - 2032F |
6.1.8 Lithuania Dyes Market Revenues & Volume, By Other Dyes, 2022 - 2032F |
6.2 Lithuania Dyes Market, By Application |
6.2.1 Overview and Analysis |
6.2.2 Lithuania Dyes Market Revenues & Volume, By Textile, 2022 - 2032F |
6.2.3 Lithuania Dyes Market Revenues & Volume, By Leather, 2022 - 2032F |
6.2.4 Lithuania Dyes Market Revenues & Volume, By Paper, 2022 - 2032F |
6.2.5 Lithuania Dyes Market Revenues & Volume, By Printing Inks, 2022 - 2032F |
6.2.6 Lithuania Dyes Market Revenues & Volume, By Other, 2022 - 2032F |
7 Lithuania Dyes Market Import-Export Trade Statistics |
7.1 Lithuania Dyes Market Export to Major Countries |
7.2 Lithuania Dyes Market Imports from Major Countries |
8 Lithuania Dyes Market Key Performance Indicators |
8.1 Adoption rate of eco-friendly dyes in the Lithuanian market |
8.2 Research and development investment in new dye technologies |
8.3 Percentage of textile and leather companies in Lithuania using advanced dyeing processes |
9 Lithuania Dyes Market - Opportunity Assessment |
9.1 Lithuania Dyes Market Opportunity Assessment, By Product Type, 2022 & 2032F |
9.2 Lithuania Dyes Market Opportunity Assessment, By Application, 2022 & 2032F |
10 Lithuania Dyes Market - Competitive Landscape |
10.1 Lithuania Dyes Market Revenue Share, By Companies, 2025 |
10.2 Lithuania Dyes Market Competitive Benchmarking, By Operating and Technical Parameters |
11 Company Profiles |
12 Recommendations |
13 Disclaimer |
Global Go To Market Strategy - 2030
Export potential enables firms to identify high-growth global markets with greater confidence by combining advanced trade intelligence with a structured quantitative methodology. The framework analyzes emerging demand trends and country-level import patterns while integrating macroeconomic and trade datasets such as GDP and population forecasts, bilateral import–export flows, tariff structures, elasticity differentials between developed and developing economies, geographic distance, and import demand projections. Using weighted trade values from 2020–2024 as the base period to project country-to-country export potential for 2030, these inputs are operationalized through calculated drivers such as gravity model parameters, tariff impact factors, and projected GDP per-capita growth. Through an analysis of hidden potentials, demand hotspots, and market conditions that are most favorable to success, this method enables firms to focus on target countries, maximize returns, and global expansion with data, backed by accuracy.
By factoring in the projected importer demand gap that is currently unmet and could be potential opportunity, it identifies the potential for the Exporter (Country) among 190 countries, against the general trade analysis, which identifies the biggest importer or exporter.
To discover high-growth global markets and optimize your business strategy:
Click Here
Pricing
- Single User License$ 1,995
- Department License$ 2,400
- Site License$ 3,120
- Global License$ 3,795

Leadership Perspectives from Industry Events
Search
Thought Leadership and Analyst Meet


Our Clients
6WResearch In News
- Doha a strategic location for EV manufacturing hub: IPA Qatar
- Demand for luxury TVs surging in the GCC, says Samsung
- Empowering Growth: The Thriving Journey of Bangladesh’s Cable Industry
- Demand for luxury TVs surging in the GCC, says Samsung
- Video call with a traditional healer? Once unthinkable, it’s now common in South Africa
- Intelligent Buildings To Smooth GCC’s Path To Net Zero
Latest Reports
- Taiwan Airport Wireless Infrastructure Market (2026-2032)
- Vietnam Airport Wireless Infrastructure Market (2026-2032)
- Thailand Airport Wireless Infrastructure Market (2026-2032)
- South Korea Airport Wireless Infrastructure Market (2026-2032)
- Romania Airport Wireless Infrastructure Market (2026-2032)
- Qatar Airport Wireless Infrastructure Market (2026-2032)
- Philippines Airport Wireless Infrastructure Market (2026-2032)
- Japan Airport Wireless Infrastructure Market (2026-2032)
- Taiwan Airport Winter Services Market (2026-2032)
- Vietnam Airport Winter Services Market (2026-2032)
Industry Events and Analyst Meet

HIMTEX 2026

India Refining Summit 2026

India EV Show 2026

EV tech India Expo 2026

Auto Tech Asia 2026
Whitepaper
- Middle East & Africa Commercial Security Market Click here to view more.
- Middle East & Africa Fire Safety Systems & Equipment Market Click here to view more.
- GCC Drone Market Click here to view more.
- Middle East Lighting Fixture Market Click here to view more.
- GCC Physical & Perimeter Security Market Click here to view more.