Lithuania Ethylene Vinyl Acetate Market (2026-2032) | Revenue, Size, Trends, Outlook, Forecast, Value, Share, Companies, Industry, Segmentation, Analysis & Growth
Market Forecast By Grade (Low Density, Medium Density, High Density), By Application (Films, Adhesives, Foams, Solar Cell Encapsulation, Other Applications) And Competitive Landscape
| Product Code: ETC5043685 | Publication Date: Nov 2023 | Updated Date: Apr 2026 | Product Type: Market Research Report | |
| Publisher: 6Wresearch | Author: Shubham Padhi | No. of Pages: 60 | No. of Figures: 30 | No. of Tables: 5 |
Lithuania Ethylene Vinyl Acetate Market Size (2020-2030)
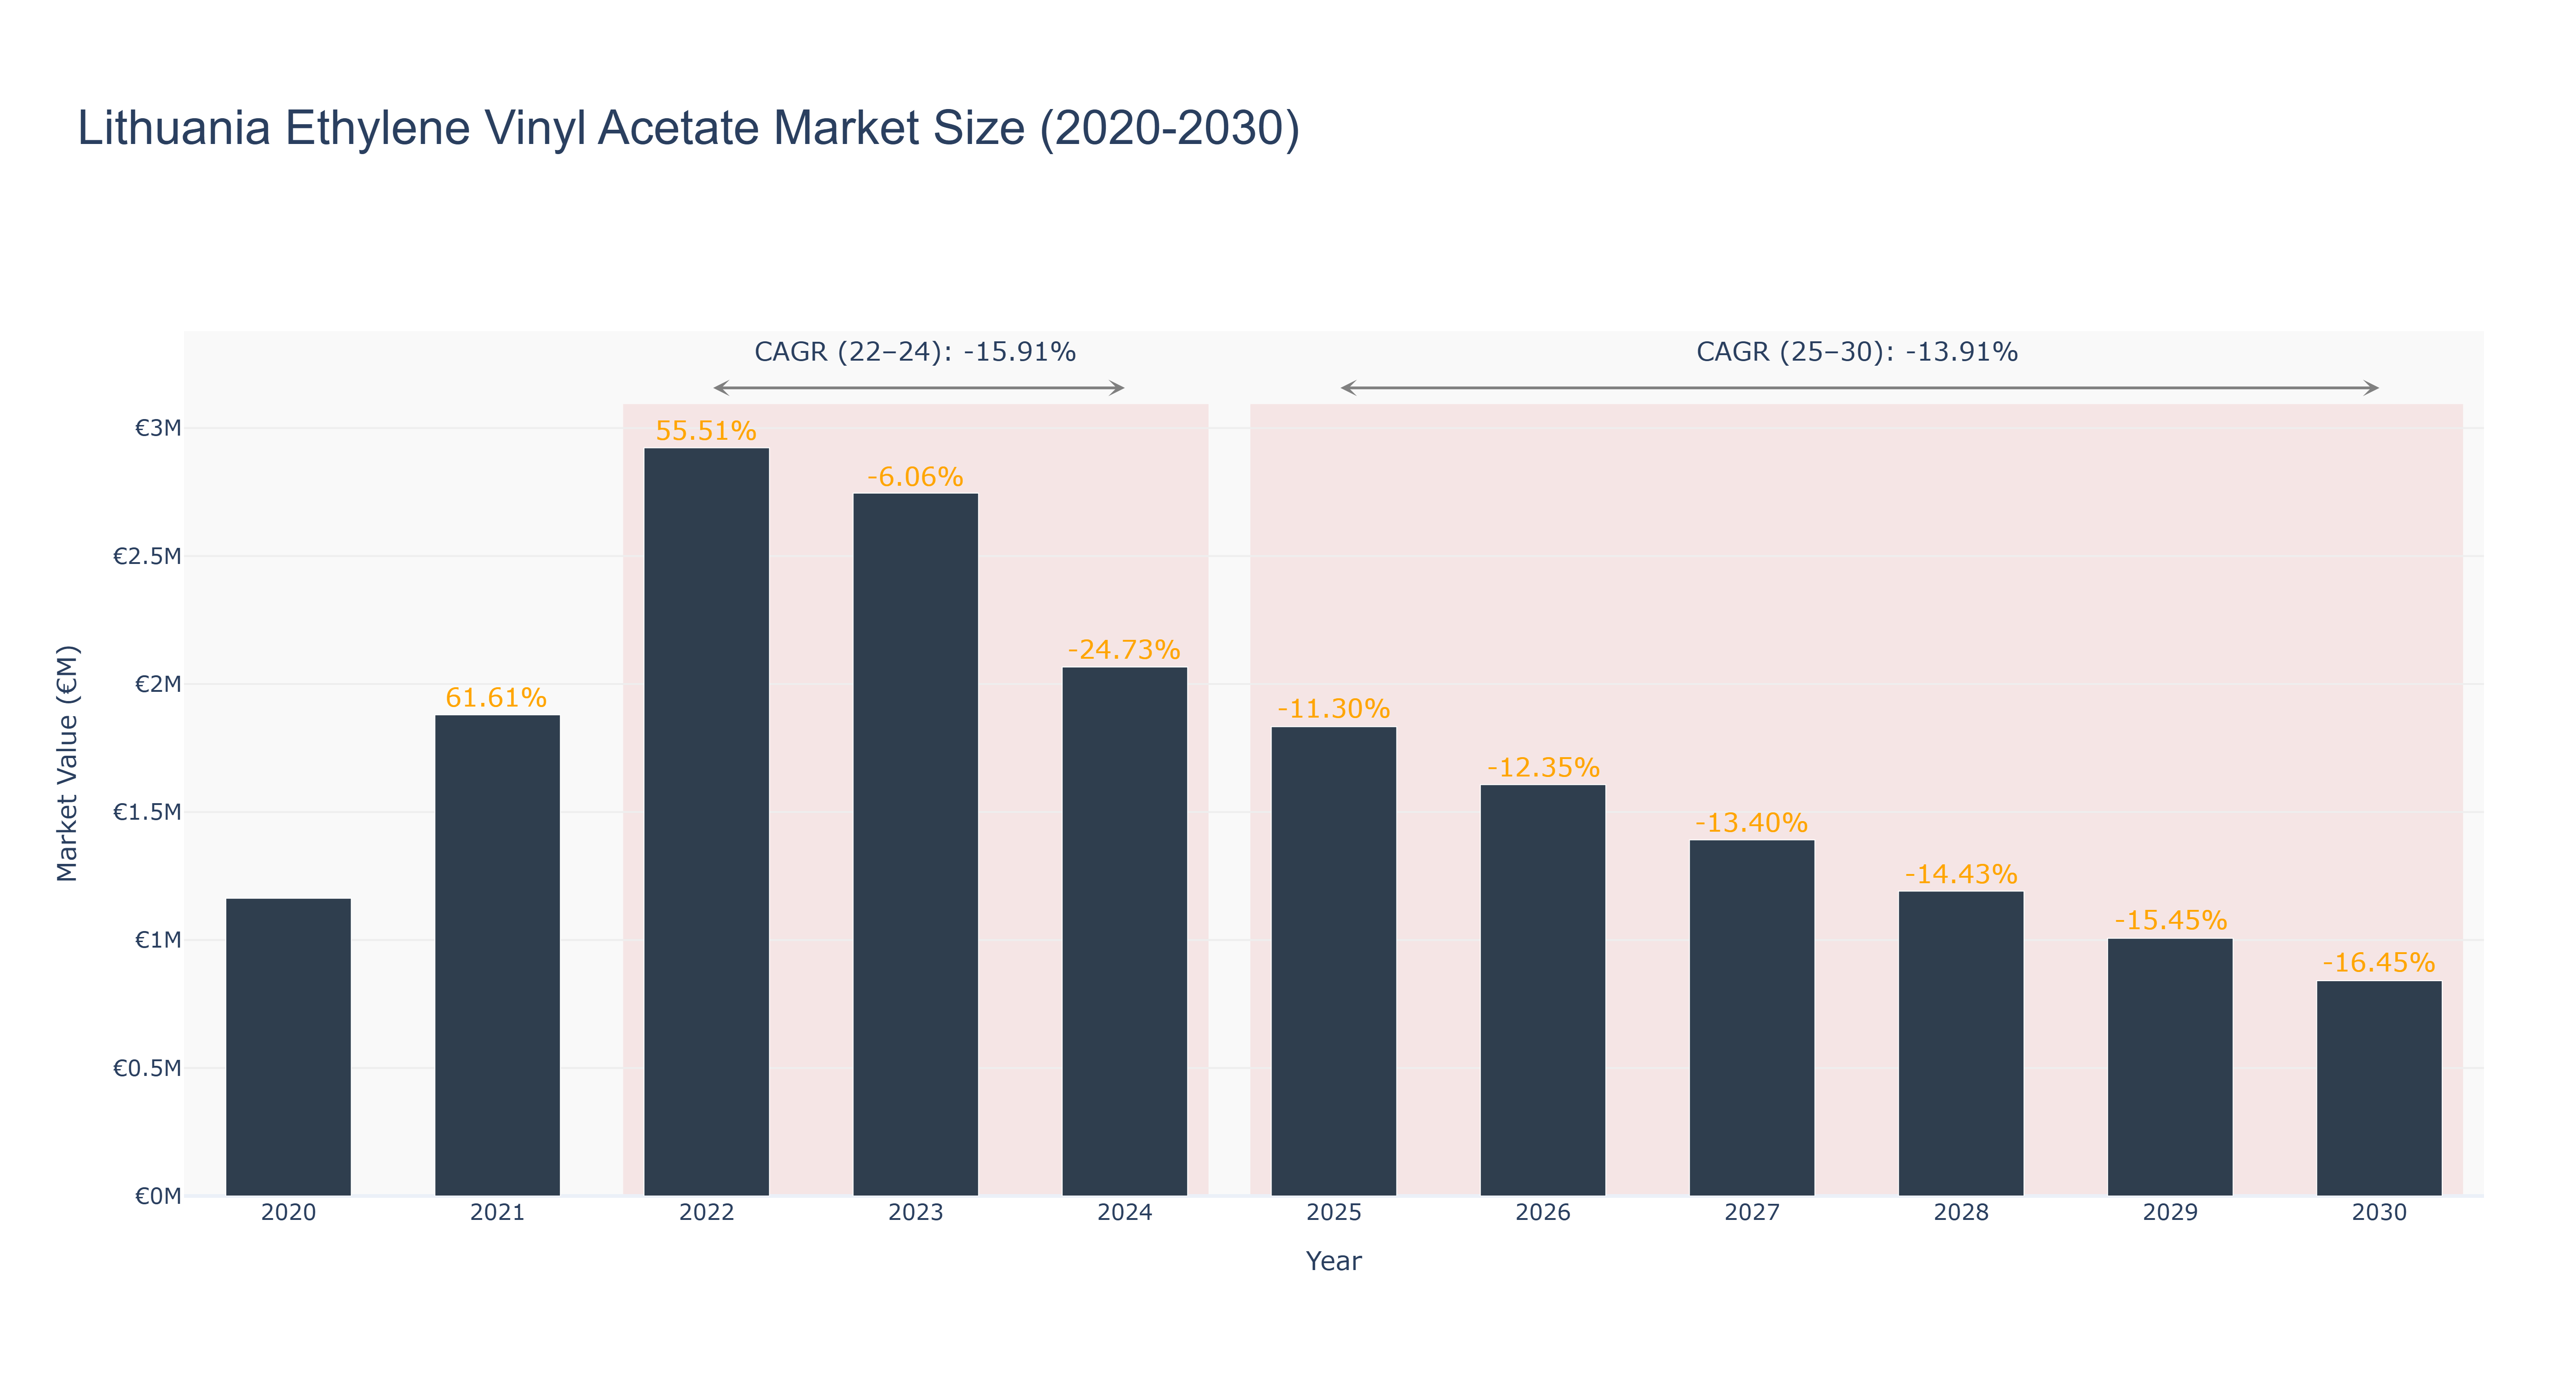
The Lithuania Ethylene Vinyl Acetate market experienced significant growth from 2020 to 2022, peaking at €2.92 million in 2022, with a compounded annual growth rate (CAGR) of 55.51% from 2021 to 2022. However, this momentum faltered in 2023, as the market size declined to €2.75 million, reflecting a -6.06% growth rate. The downward trend continued through 2024, with the market projected to shrink to €2.07 million, resulting in a CAGR of -15.91% for the actual period of 2022-2024. Looking ahead, the forecasted period from 2025 to 2030 anticipates further contraction, with market size estimates declining to €841.14 thousand by 2030, yielding a CAGR of -13.91%. Key factors driving this decline could include oversaturation of the market, shifts in consumer preferences, and potential regulatory changes affecting production. Without significant new projects or innovations, the market faces persistent challenges in recovery.
Lithuania Ethylene Vinyl Acetate Market: Production & Trade Performance (2019-2025)
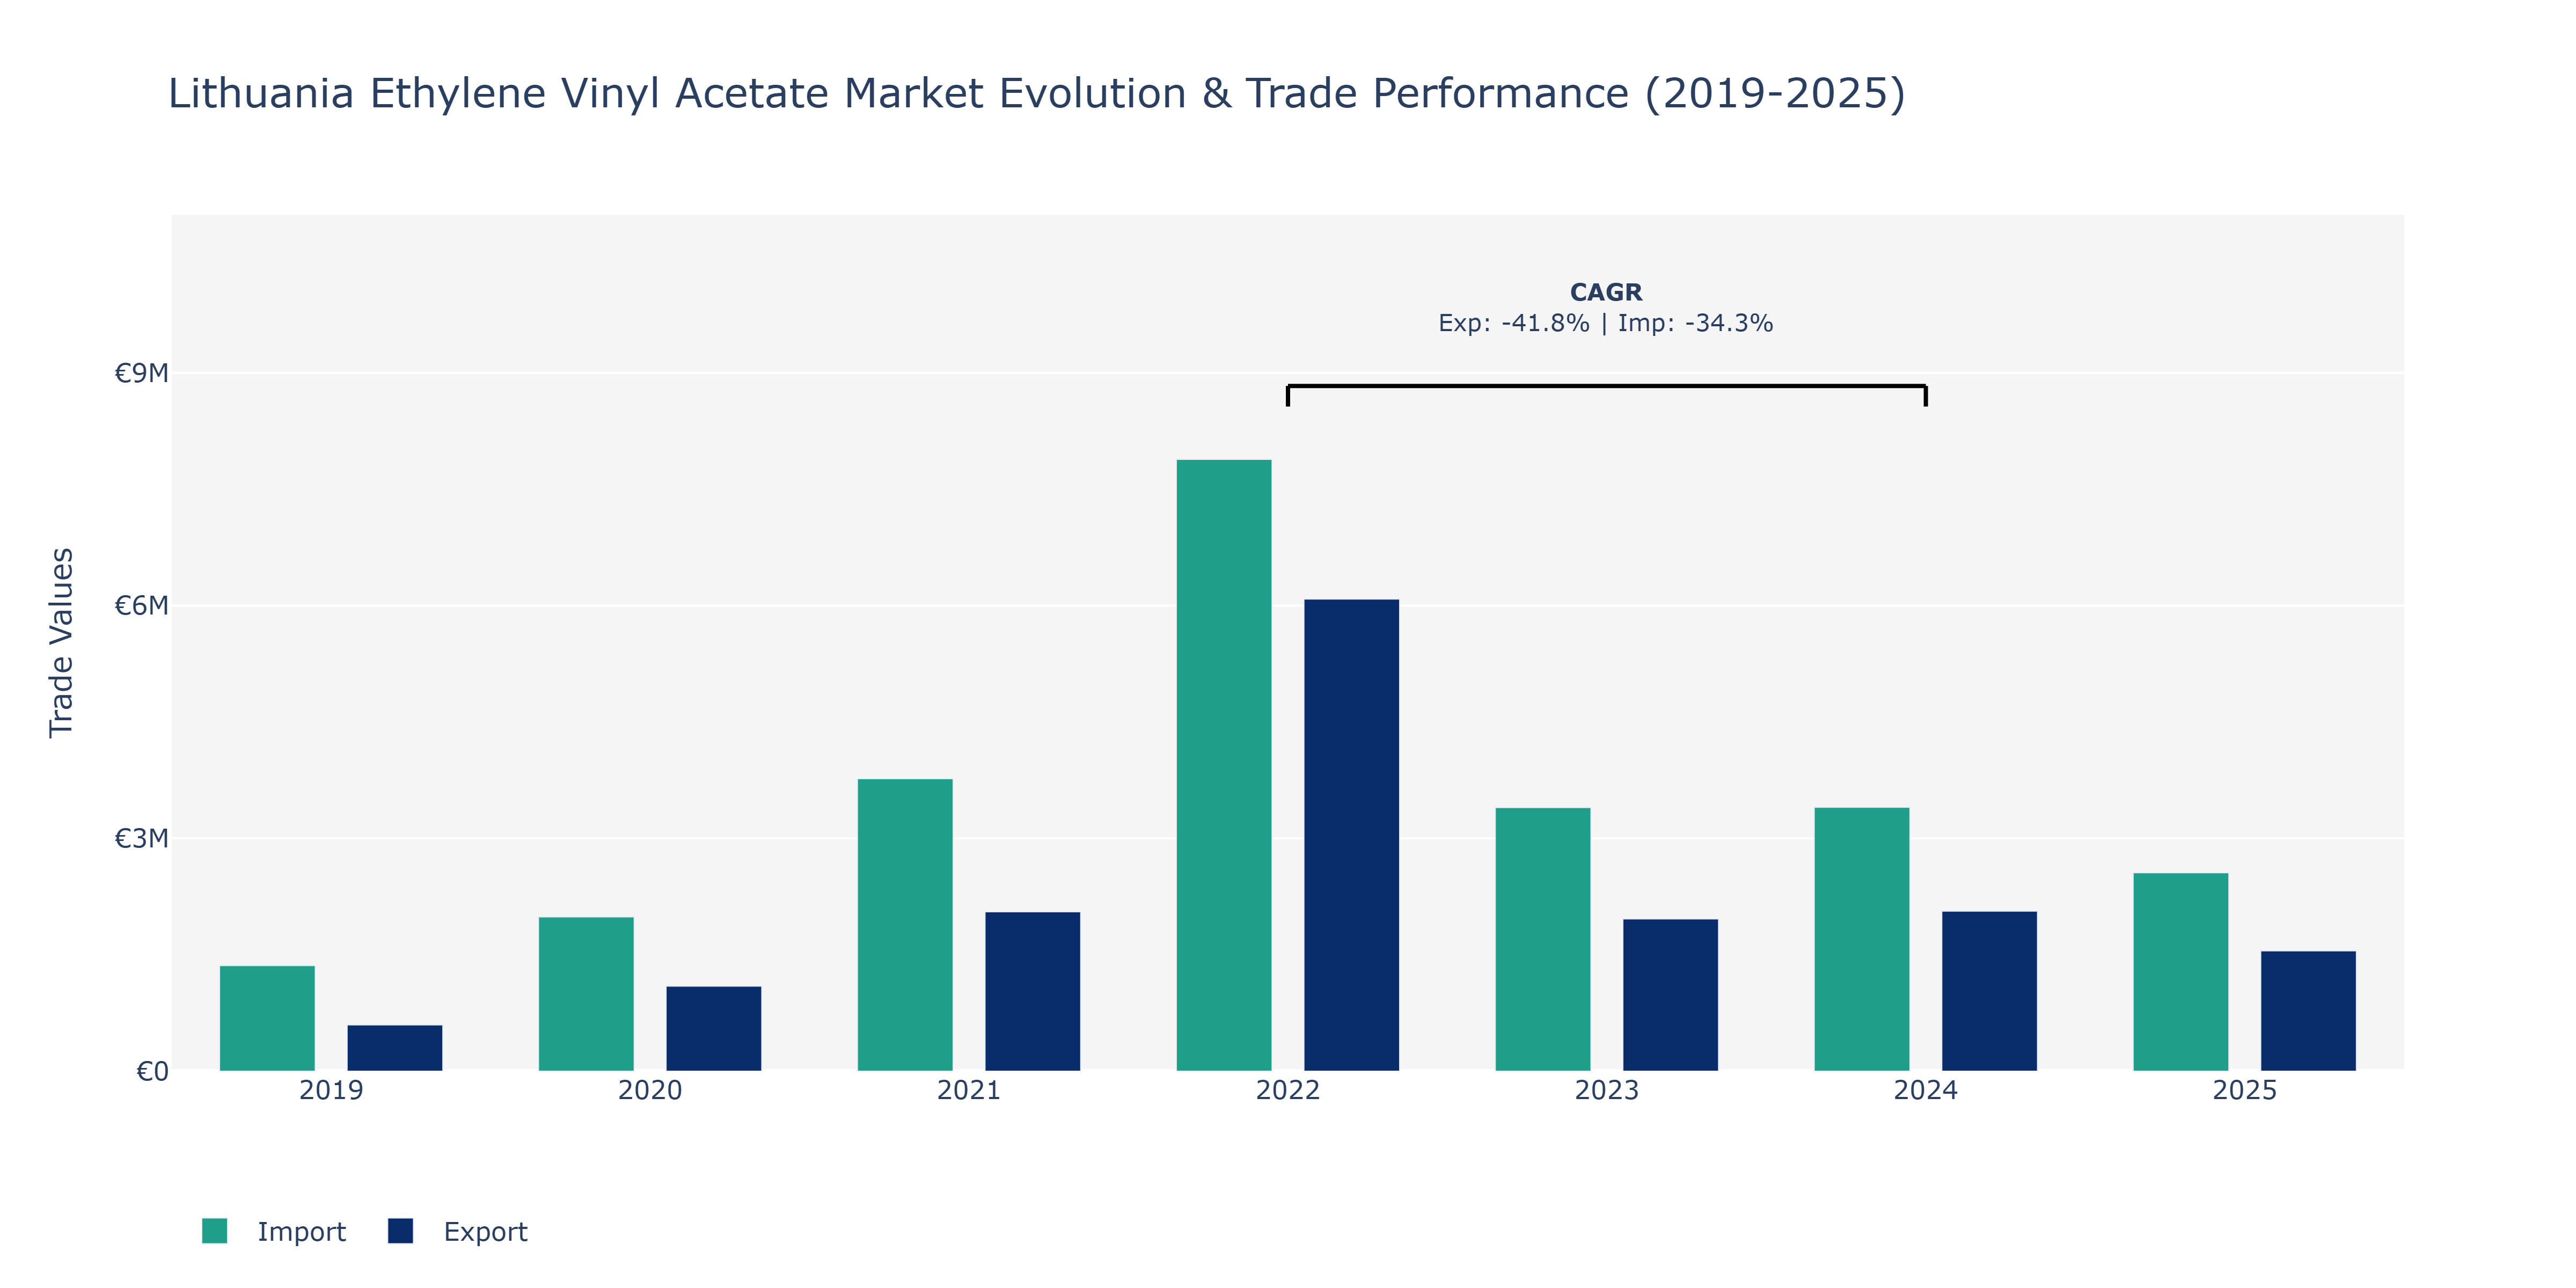
Between 2019 and 2025, Lithuania's Ethylene Vinyl Acetate Market demonstrated notable fluctuations in both Exports and Imports. Exports began at €596.61 thousand in 2019, experienced a considerable surge in 2022 to €6.09 million, and then fluctuated in subsequent years, hitting €1.55 million in 2025. On the other hand, Imports started at €1.36 million in 2019, reached €3.77 million in 2021, and slightly decreased to €2.56 million in 2025. The market's peak exports in 2022 were driven by increased demand from industries utilizing ethylene vinyl acetate for packaging and solar panel production. The subsequent decline in exports could be attributed to global economic conditions affecting trade patterns. Meanwhile, the fluctuation in imports could be linked to changes in domestic manufacturing capacities impacting the need for raw material imports.
Key Highlights of the Report:
- Lithuania Ethylene Vinyl Acetate Market Outlook
- Market Size of Lithuania Ethylene Vinyl Acetate Market, 2025
- Forecast of Lithuania Ethylene Vinyl Acetate Market, 2032
- Historical Data and Forecast of Lithuania Ethylene Vinyl Acetate Revenues & Volume for the Period 2022 - 2032F
- Lithuania Ethylene Vinyl Acetate Market Trend Evolution
- Lithuania Ethylene Vinyl Acetate Market Drivers and Challenges
- Lithuania Ethylene Vinyl Acetate Price Trends
- Lithuania Ethylene Vinyl Acetate Porter`s Five Forces
- Lithuania Ethylene Vinyl Acetate Industry Life Cycle
- Historical Data and Forecast of Lithuania Ethylene Vinyl Acetate Market Revenues & Volume By Grade for the Period 2022 - 2032F
- Historical Data and Forecast of Lithuania Ethylene Vinyl Acetate Market Revenues & Volume By Low Density for the Period 2022 - 2032F
- Historical Data and Forecast of Lithuania Ethylene Vinyl Acetate Market Revenues & Volume By Medium Density for the Period 2022 - 2032F
- Historical Data and Forecast of Lithuania Ethylene Vinyl Acetate Market Revenues & Volume By High Density for the Period 2022 - 2032F
- Historical Data and Forecast of Lithuania Ethylene Vinyl Acetate Market Revenues & Volume By Application for the Period 2022 - 2032F
- Historical Data and Forecast of Lithuania Ethylene Vinyl Acetate Market Revenues & Volume By Films for the Period 2022 - 2032F
- Historical Data and Forecast of Lithuania Ethylene Vinyl Acetate Market Revenues & Volume By Adhesives for the Period 2022 - 2032F
- Historical Data and Forecast of Lithuania Ethylene Vinyl Acetate Market Revenues & Volume By Foams for the Period 2022 - 2032F
- Historical Data and Forecast of Lithuania Ethylene Vinyl Acetate Market Revenues & Volume By Solar Cell Encapsulation for the Period 2022 - 2032F
- Historical Data and Forecast of Lithuania Ethylene Vinyl Acetate Market Revenues & Volume By Other Applications for the Period 2022 - 2032F
- Lithuania Ethylene Vinyl Acetate Import Export Trade Statistics
- Market Opportunity Assessment By Grade
- Market Opportunity Assessment By Application
- Lithuania Ethylene Vinyl Acetate Top Companies Market Share
- Lithuania Ethylene Vinyl Acetate Competitive Benchmarking By Technical and Operational Parameters
- Lithuania Ethylene Vinyl Acetate Company Profiles
- Lithuania Ethylene Vinyl Acetate Key Strategic Recommendations
Frequently Asked Questions About the Market Study (FAQs):
6Wresearch actively monitors the Lithuania Ethylene Vinyl Acetate Market and publishes its comprehensive annual report, highlighting emerging trends, growth drivers, revenue analysis, and forecast outlook. Our insights help businesses to make data-backed strategic decisions with ongoing market dynamics. Our analysts track relevent industries related to the Lithuania Ethylene Vinyl Acetate Market, allowing our clients with actionable intelligence and reliable forecasts tailored to emerging regional needs.
Yes, we provide customisation as per your requirements. To learn more, feel free to contact us on sales@6wresearch.com
1 Executive Summary |
2 Introduction |
2.1 Key Highlights of the Report |
2.2 Report Description |
2.3 Market Scope & Segmentation |
2.4 Research Methodology |
2.5 Assumptions |
3 Lithuania Ethylene Vinyl Acetate Market Overview |
3.1 Lithuania Country Macro Economic Indicators |
3.2 Lithuania Ethylene Vinyl Acetate Market Revenues & Volume, 2022 & 2032F |
3.3 Lithuania Ethylene Vinyl Acetate Market - Industry Life Cycle |
3.4 Lithuania Ethylene Vinyl Acetate Market - Porter's Five Forces |
3.5 Lithuania Ethylene Vinyl Acetate Market Revenues & Volume Share, By Grade, 2022 & 2032F |
3.6 Lithuania Ethylene Vinyl Acetate Market Revenues & Volume Share, By Application, 2022 & 2032F |
4 Lithuania Ethylene Vinyl Acetate Market Dynamics |
4.1 Impact Analysis |
4.2 Market Drivers |
4.2.1 Growing demand for ethylene vinyl acetate (EVA) in the packaging industry due to its excellent properties such as flexibility and toughness. |
4.2.2 Increasing adoption of EVA in the solar energy sector for the manufacturing of photovoltaic modules. |
4.2.3 Rising usage of EVA in the footwear industry for making comfortable and lightweight shoes. |
4.3 Market Restraints |
4.3.1 Fluctuating prices of raw materials used in the production of EVA, such as ethylene and vinyl acetate monomer. |
4.3.2 Environmental concerns related to the disposal of EVA products, leading to potential regulatory restrictions. |
4.3.3 Competition from alternative materials like polyethylene and polypropylene affecting the market growth of EVA. |
5 Lithuania Ethylene Vinyl Acetate Market Trends |
6 Lithuania Ethylene Vinyl Acetate Market Segmentations |
6.1 Lithuania Ethylene Vinyl Acetate Market, By Grade |
6.1.1 Overview and Analysis |
6.1.2 Lithuania Ethylene Vinyl Acetate Market Revenues & Volume, By Low Density, 2022 - 2032F |
6.1.3 Lithuania Ethylene Vinyl Acetate Market Revenues & Volume, By Medium Density, 2022 - 2032F |
6.1.4 Lithuania Ethylene Vinyl Acetate Market Revenues & Volume, By High Density, 2022 - 2032F |
6.2 Lithuania Ethylene Vinyl Acetate Market, By Application |
6.2.1 Overview and Analysis |
6.2.2 Lithuania Ethylene Vinyl Acetate Market Revenues & Volume, By Films, 2022 - 2032F |
6.2.3 Lithuania Ethylene Vinyl Acetate Market Revenues & Volume, By Adhesives, 2022 - 2032F |
6.2.4 Lithuania Ethylene Vinyl Acetate Market Revenues & Volume, By Foams, 2022 - 2032F |
6.2.5 Lithuania Ethylene Vinyl Acetate Market Revenues & Volume, By Solar Cell Encapsulation, 2022 - 2032F |
6.2.6 Lithuania Ethylene Vinyl Acetate Market Revenues & Volume, By Other Applications, 2022 - 2032F |
7 Lithuania Ethylene Vinyl Acetate Market Import-Export Trade Statistics |
7.1 Lithuania Ethylene Vinyl Acetate Market Export to Major Countries |
7.2 Lithuania Ethylene Vinyl Acetate Market Imports from Major Countries |
8 Lithuania Ethylene Vinyl Acetate Market Key Performance Indicators |
8.1 Research and development investment in EVA technology advancements. |
8.2 Number of new product launches and innovations in EVA applications. |
8.3 Adoption rate of EVA in emerging industries such as automotive and healthcare. |
9 Lithuania Ethylene Vinyl Acetate Market - Opportunity Assessment |
9.1 Lithuania Ethylene Vinyl Acetate Market Opportunity Assessment, By Grade, 2022 & 2032F |
9.2 Lithuania Ethylene Vinyl Acetate Market Opportunity Assessment, By Application, 2022 & 2032F |
10 Lithuania Ethylene Vinyl Acetate Market - Competitive Landscape |
10.1 Lithuania Ethylene Vinyl Acetate Market Revenue Share, By Companies, 2025 |
10.2 Lithuania Ethylene Vinyl Acetate Market Competitive Benchmarking, By Operating and Technical Parameters |
11 Company Profiles |
12 Recommendations | 13 Disclaimer |
Global Go To Market Strategy - 2030
Export potential enables firms to identify high-growth global markets with greater confidence by combining advanced trade intelligence with a structured quantitative methodology. The framework analyzes emerging demand trends and country-level import patterns while integrating macroeconomic and trade datasets such as GDP and population forecasts, bilateral import–export flows, tariff structures, elasticity differentials between developed and developing economies, geographic distance, and import demand projections. Using weighted trade values from 2020–2024 as the base period to project country-to-country export potential for 2030, these inputs are operationalized through calculated drivers such as gravity model parameters, tariff impact factors, and projected GDP per-capita growth. Through an analysis of hidden potentials, demand hotspots, and market conditions that are most favorable to success, this method enables firms to focus on target countries, maximize returns, and global expansion with data, backed by accuracy.
By factoring in the projected importer demand gap that is currently unmet and could be potential opportunity, it identifies the potential for the Exporter (Country) among 190 countries, against the general trade analysis, which identifies the biggest importer or exporter.
To discover high-growth global markets and optimize your business strategy:
Click Here
Pricing
- Single User License$ 1,995
- Department License$ 2,400
- Site License$ 3,120
- Global License$ 3,795

Leadership Perspectives from Industry Events
Search
Thought Leadership and Analyst Meet


Our Clients
6WResearch In News
- India Air Conditioner Market Set for Strong Rebound in 2026 After Weather-Led Correction and GST-Driven Recovery: 6Wresearch
- ADAS in India: How Automatic Emergency Braking, Blind Spot Detection & Driver Monitoring are Transforming Road Safety
- Doha a strategic location for EV manufacturing hub: IPA Qatar
- Demand for luxury TVs surging in the GCC, says Samsung
- Empowering Growth: The Thriving Journey of Bangladesh’s Cable Industry
- Demand for luxury TVs surging in the GCC, says Samsung
Latest Reports
- Nicaragua RPG Gaming Market (2026-2032)
- New Zealand RPG Gaming Market (2026-2032)
- Netherlands RPG Gaming Market (2026-2032)
- Nauru RPG Gaming Market (2026-2032)
- Namibia RPG Gaming Market (2026-2032)
- Mozambique RPG Gaming Market (2026-2032)
- Montenegro RPG Gaming Market (2026-2032)
- Mongolia RPG Gaming Market (2026-2032)
- Monaco RPG Gaming Market (2026-2032)
- Micronesia RPG Gaming Market (2026-2032)
Industry Events and Analyst Meet

EV India Expo 2026

HIMTEX 2026

India Refining Summit 2026

India EV Show 2026

EV tech India Expo 2026
Whitepaper
- Middle East & Africa Commercial Security Market Click here to view more.
- Middle East & Africa Fire Safety Systems & Equipment Market Click here to view more.
- GCC Drone Market Click here to view more.
- Middle East Lighting Fixture Market Click here to view more.
- GCC Physical & Perimeter Security Market Click here to view more.