Lithuania Hydrazine Market (2026-2032) | Share, Companies, Forecast, Segmentation, Value, Analysis, Growth, Trends, Revenue, Outlook, Industry & Size
Market Forecast By Type (Hydrazine Hydrate, Hydrazine Nitrate, Hydrazine Sulfate, Other Types), By Application (Corrosion Inhibitor, Explosives, Medicinal Ingredient, Rocket Fuel, Precursor to Pesticides, Blowing Agent, Other Applications), By End-users (Pharmaceuticals, Agrochemicals, Industrial, Other End-user Industries) And Competitive Landscape
| Product Code: ETC4741509 | Publication Date: Nov 2023 | Updated Date: Apr 2026 | Product Type: Market Research Report | |
| Publisher: 6Wresearch | Author: Shubham Padhi | No. of Pages: 60 | No. of Figures: 30 | No. of Tables: 5 |
Lithuania Hydrazine Market Size (2020-2030)
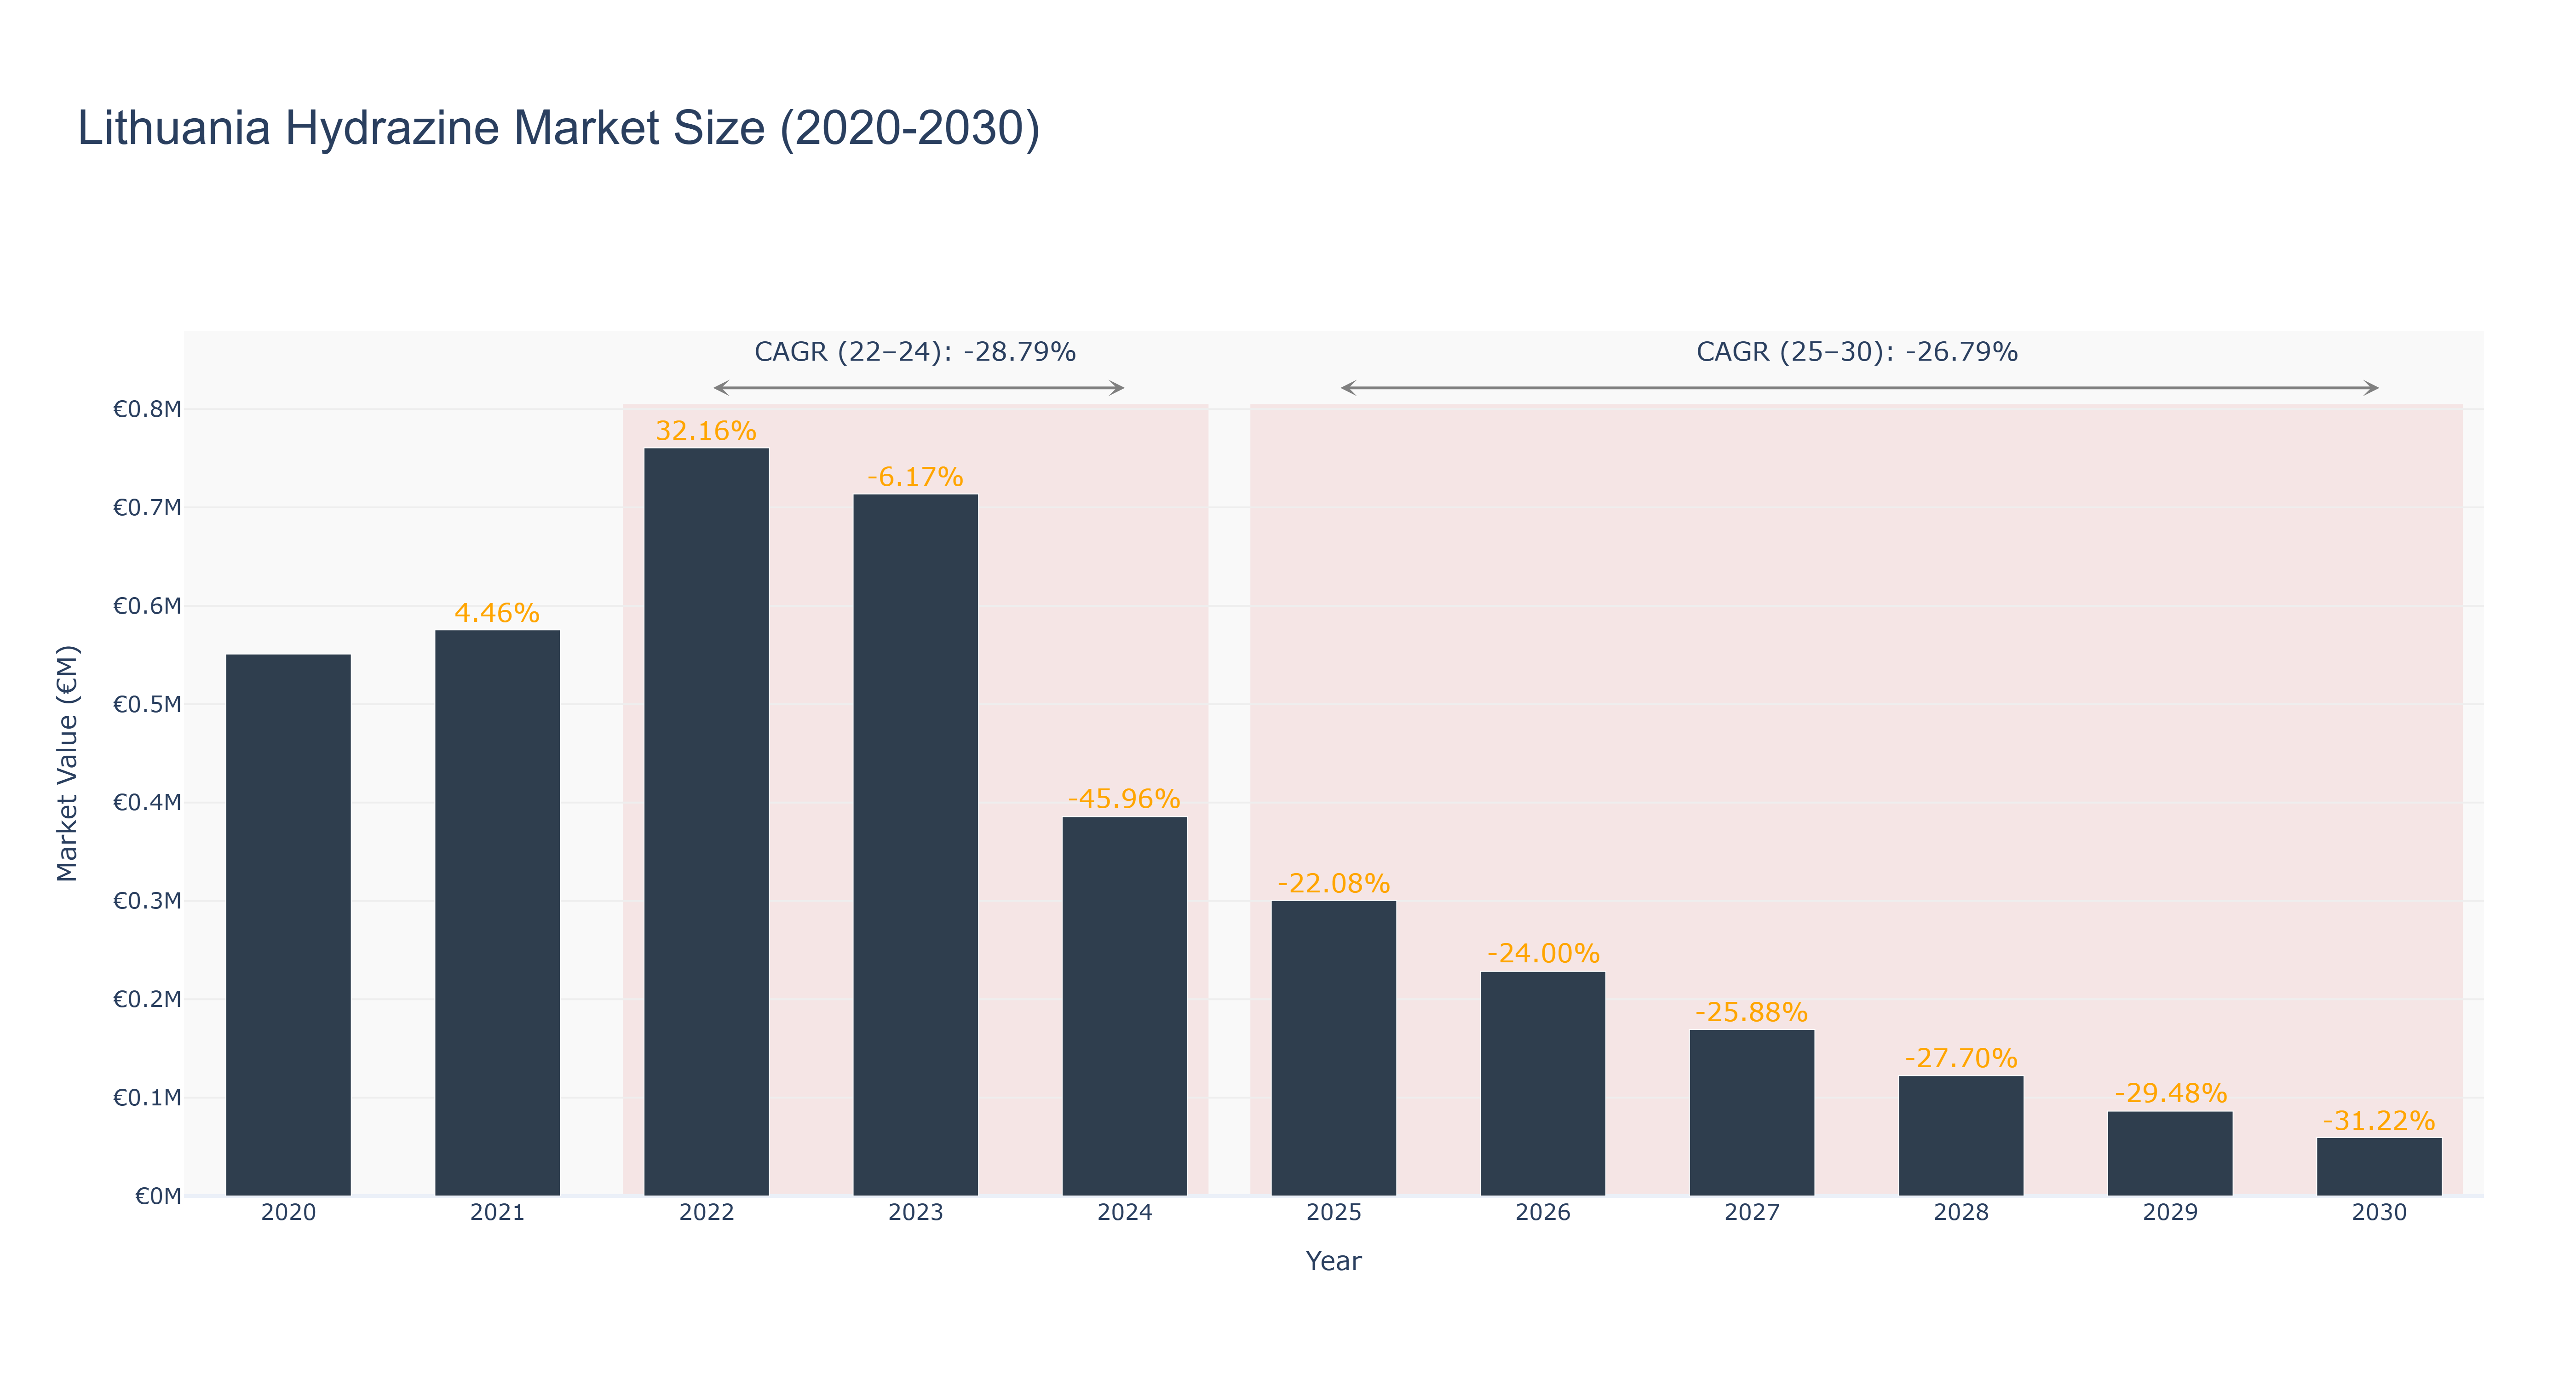
Lithuania Hydrazine Market has shown a declining trend in recent years. The peak market size of €0.76 million was observed in 2022, followed by a significant decrease to €0.39 million in 2024. The forecasted market size is expected to continue decreasing from €0.30 million in 2025 to €0.06 million in 2030. The CAGR values reflect the downward trajectory, with a decline of -28.79% from 2022 to 2024 and -26.79% from 2025 to 2030. This decline can be attributed to various factors such as changing consumer preferences, economic instability, and regulatory challenges in the industry. Looking ahead, Lithuania is focusing on renewable energy projects to revitalize the market, with upcoming investments in sustainable energy solutions and environmental initiatives driving potential growth in the hydrazine market.
Lithuania Hydrazine Market: Production & Trade Performance (2019-2025)
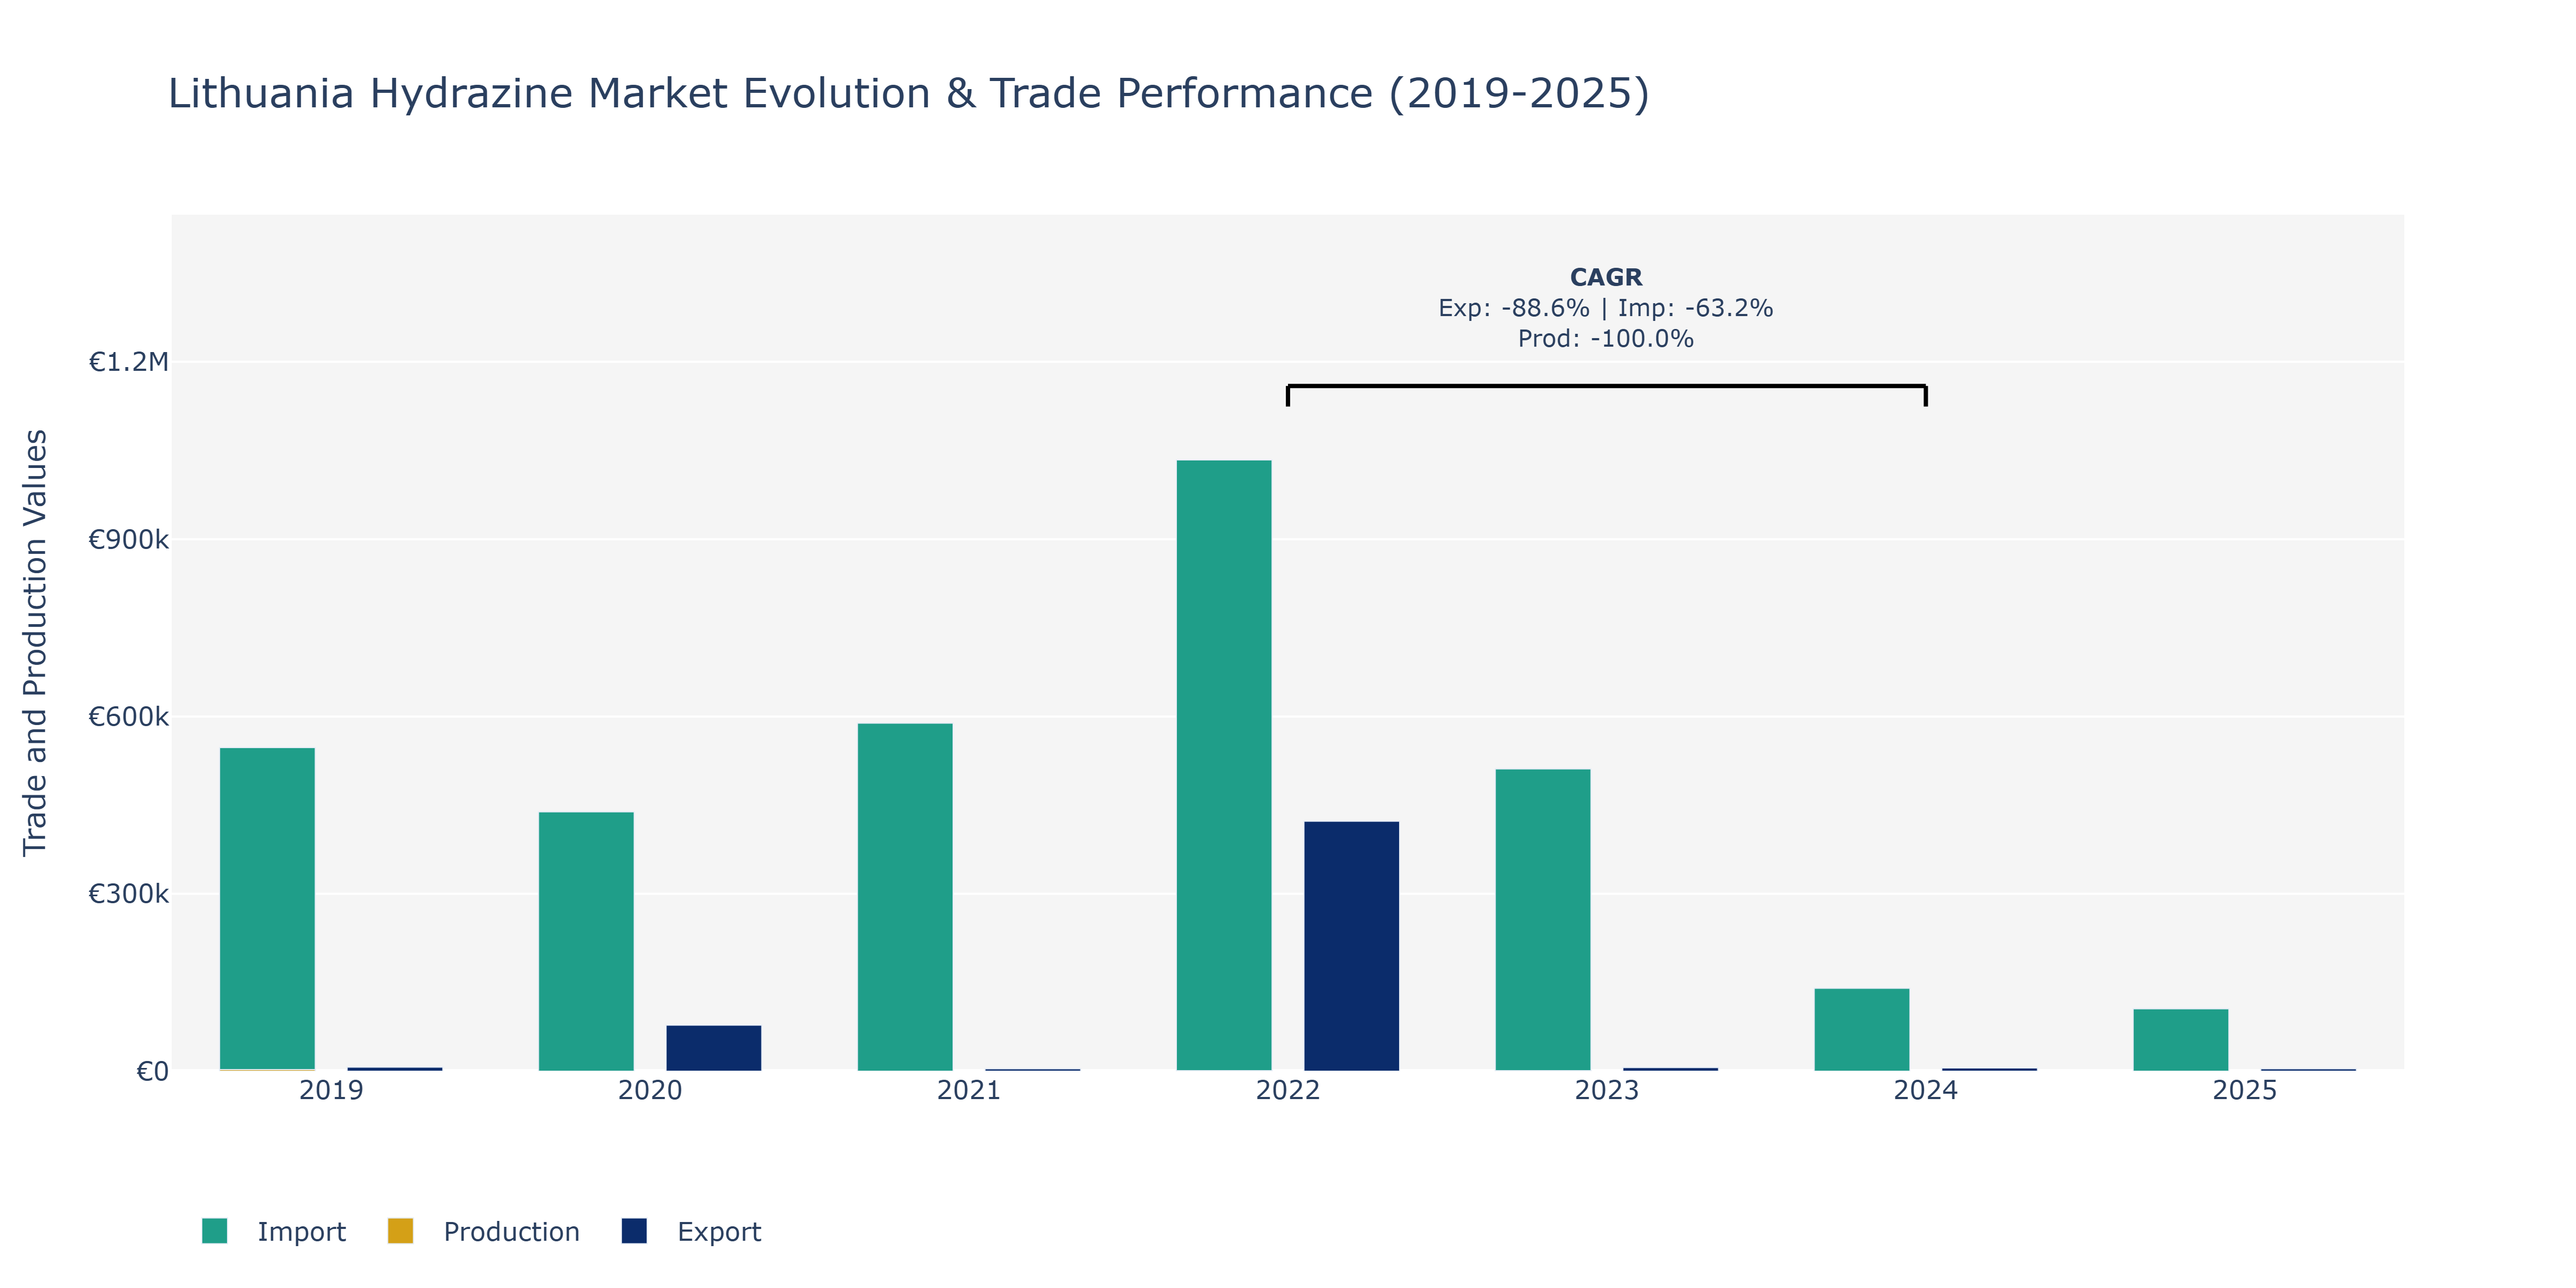
Between 2019 and 2025, the Lithuania Hydrazine Market saw notable fluctuations in exports, imports, and production. In 2020, a substantial peak in exports was observed at €77.87 thousand, followed by a sharp decline in 2021 to €4.16 thousand. Imports peaked in 2022 at €1.03 million, exhibiting a significant increase from the previous year. Production remained steady at €1.0 million in both 2022 and 2023, emphasizing consistency in manufacturing levels. The decline in exports and production in 2021 can be attributed to global economic downturns impacting market demand, while the surge in imports in 2022 could be a result of increased domestic consumption or strategic sourcing decisions. Such fluctuations underscore the market's sensitivity to external economic factors, necessitating adaptive strategies to navigate volatility and maintain competitiveness in the Hydrazine industry.
Key Highlights of the Report:
- Lithuania Hydrazine Market Outlook
- Market Size of Lithuania Hydrazine Market, 2025
- Forecast of Lithuania Hydrazine Market, 2032
- Historical Data and Forecast of Lithuania Hydrazine Revenues & Volume for the Period 2022 - 2032F
- Lithuania Hydrazine Market Trend Evolution
- Lithuania Hydrazine Market Drivers and Challenges
- Lithuania Hydrazine Price Trends
- Lithuania Hydrazine Porter`s Five Forces
- Lithuania Hydrazine Industry Life Cycle
- Historical Data and Forecast of Lithuania Hydrazine Market Revenues & Volume By Type for the Period 2022 - 2032F
- Historical Data and Forecast of Lithuania Hydrazine Market Revenues & Volume By Hydrazine Hydrate for the Period 2022 - 2032F
- Historical Data and Forecast of Lithuania Hydrazine Market Revenues & Volume By Hydrazine Nitrate for the Period 2022 - 2032F
- Historical Data and Forecast of Lithuania Hydrazine Market Revenues & Volume By Hydrazine Sulfate for the Period 2022 - 2032F
- Historical Data and Forecast of Lithuania Hydrazine Market Revenues & Volume By Other Types for the Period 2022 - 2032F
- Historical Data and Forecast of Lithuania Hydrazine Market Revenues & Volume By Application for the Period 2022 - 2032F
- Historical Data and Forecast of Lithuania Hydrazine Market Revenues & Volume By Corrosion Inhibitor for the Period 2022 - 2032F
- Historical Data and Forecast of Lithuania Hydrazine Market Revenues & Volume By Explosives for the Period 2022 - 2032F
- Historical Data and Forecast of Lithuania Hydrazine Market Revenues & Volume By Medicinal Ingredient for the Period 2022 - 2032F
- Historical Data and Forecast of Lithuania Hydrazine Market Revenues & Volume By Rocket Fuel for the Period 2022 - 2032F
- Historical Data and Forecast of Lithuania Hydrazine Market Revenues & Volume By Precursor to Pesticides for the Period 2022 - 2032F
- Historical Data and Forecast of Lithuania Hydrazine Market Revenues & Volume By Blowing Agent for the Period 2022 - 2032F
- Historical Data and Forecast of Lithuania Hydrazine Market Revenues & Volume By Other Applications for the Period 2022 - 2032F
- Historical Data and Forecast of Lithuania Hydrazine Market Revenues & Volume By End-users for the Period 2022 - 2032F
- Historical Data and Forecast of Lithuania Hydrazine Market Revenues & Volume By Pharmaceuticals for the Period 2022 - 2032F
- Historical Data and Forecast of Lithuania Hydrazine Market Revenues & Volume By Agrochemicals for the Period 2022 - 2032F
- Historical Data and Forecast of Lithuania Hydrazine Market Revenues & Volume By Industrial for the Period 2022 - 2032F
- Historical Data and Forecast of Lithuania Hydrazine Market Revenues & Volume By Other End-user Industries for the Period 2022 - 2032F
- Lithuania Hydrazine Import Export Trade Statistics
- Market Opportunity Assessment By Type
- Market Opportunity Assessment By Application
- Market Opportunity Assessment By End-users
- Lithuania Hydrazine Top Companies Market Share
- Lithuania Hydrazine Competitive Benchmarking By Technical and Operational Parameters
- Lithuania Hydrazine Company Profiles
- Lithuania Hydrazine Key Strategic Recommendations
Frequently Asked Questions About the Market Study (FAQs):
6Wresearch actively monitors the Lithuania Hydrazine Market and publishes its comprehensive annual report, highlighting emerging trends, growth drivers, revenue analysis, and forecast outlook. Our insights help businesses to make data-backed strategic decisions with ongoing market dynamics. Our analysts track relevent industries related to the Lithuania Hydrazine Market, allowing our clients with actionable intelligence and reliable forecasts tailored to emerging regional needs.
Yes, we provide customisation as per your requirements. To learn more, feel free to contact us on sales@6wresearch.com
1 Executive Summary |
2 Introduction |
2.1 Key Highlights of the Report |
2.2 Report Description |
2.3 Market Scope & Segmentation |
2.4 Research Methodology |
2.5 Assumptions |
3 Lithuania Hydrazine Market Overview |
3.1 Lithuania Country Macro Economic Indicators |
3.2 Lithuania Hydrazine Market Revenues & Volume, 2022 & 2032F |
3.3 Lithuania Hydrazine Market - Industry Life Cycle |
3.4 Lithuania Hydrazine Market - Porter's Five Forces |
3.5 Lithuania Hydrazine Market Revenues & Volume Share, By Type, 2022 & 2032F |
3.6 Lithuania Hydrazine Market Revenues & Volume Share, By Application, 2022 & 2032F |
3.7 Lithuania Hydrazine Market Revenues & Volume Share, By End-users, 2022 & 2032F |
4 Lithuania Hydrazine Market Dynamics |
4.1 Impact Analysis |
4.2 Market Drivers |
4.2.1 Increasing demand for hydrazine in the pharmaceutical industry for the production of medicines and treatments. |
4.2.2 Growing use of hydrazine in the agricultural sector as a fertilizer and pesticide. |
4.2.3 Rising adoption of hydrazine in the polymer industry for the manufacture of specialty polymers. |
4.3 Market Restraints |
4.3.1 Stringent regulations regarding the handling and disposal of hydrazine due to its toxic and hazardous nature. |
4.3.2 Fluctuating prices of raw materials used in the production of hydrazine affecting the overall cost of production. |
5 Lithuania Hydrazine Market Trends |
6 Lithuania Hydrazine Market Segmentations |
6.1 Lithuania Hydrazine Market, By Type |
6.1.1 Overview and Analysis |
6.1.2 Lithuania Hydrazine Market Revenues & Volume, By Hydrazine Hydrate, 2022 - 2032F |
6.1.3 Lithuania Hydrazine Market Revenues & Volume, By Hydrazine Nitrate, 2022 - 2032F |
6.1.4 Lithuania Hydrazine Market Revenues & Volume, By Hydrazine Sulfate, 2022 - 2032F |
6.1.5 Lithuania Hydrazine Market Revenues & Volume, By Other Types, 2022 - 2032F |
6.2 Lithuania Hydrazine Market, By Application |
6.2.1 Overview and Analysis |
6.2.2 Lithuania Hydrazine Market Revenues & Volume, By Corrosion Inhibitor, 2022 - 2032F |
6.2.3 Lithuania Hydrazine Market Revenues & Volume, By Explosives, 2022 - 2032F |
6.2.4 Lithuania Hydrazine Market Revenues & Volume, By Medicinal Ingredient, 2022 - 2032F |
6.2.5 Lithuania Hydrazine Market Revenues & Volume, By Rocket Fuel, 2022 - 2032F |
6.2.6 Lithuania Hydrazine Market Revenues & Volume, By Precursor to Pesticides, 2022 - 2032F |
6.2.7 Lithuania Hydrazine Market Revenues & Volume, By Blowing Agent, 2022 - 2032F |
6.3 Lithuania Hydrazine Market, By End-users |
6.3.1 Overview and Analysis |
6.3.2 Lithuania Hydrazine Market Revenues & Volume, By Pharmaceuticals, 2022 - 2032F |
6.3.3 Lithuania Hydrazine Market Revenues & Volume, By Agrochemicals, 2022 - 2032F |
6.3.4 Lithuania Hydrazine Market Revenues & Volume, By Industrial, 2022 - 2032F |
6.3.5 Lithuania Hydrazine Market Revenues & Volume, By Other End-user Industries, 2022 - 2032F |
7 Lithuania Hydrazine Market Import-Export Trade Statistics |
7.1 Lithuania Hydrazine Market Export to Major Countries |
7.2 Lithuania Hydrazine Market Imports from Major Countries |
8 Lithuania Hydrazine Market Key Performance Indicators |
8.1 Number of new applications of hydrazine in different industries. |
8.2 Research and development investments in improving the efficiency and safety of hydrazine production. |
8.3 Environmental impact assessments and sustainability initiatives in hydrazine manufacturing processes. |
9 Lithuania Hydrazine Market - Opportunity Assessment |
9.1 Lithuania Hydrazine Market Opportunity Assessment, By Type, 2022 & 2032F |
9.2 Lithuania Hydrazine Market Opportunity Assessment, By Application, 2022 & 2032F |
9.3 Lithuania Hydrazine Market Opportunity Assessment, By End-users, 2022 & 2032F |
10 Lithuania Hydrazine Market - Competitive Landscape |
10.1 Lithuania Hydrazine Market Revenue Share, By Companies, 2025 |
10.2 Lithuania Hydrazine Market Competitive Benchmarking, By Operating and Technical Parameters |
11 Company Profiles |
12 Recommendations | 13 Disclaimer |
Export potential assessment - trade Analytics for 2030
Export potential enables firms to identify high-growth global markets with greater confidence by combining advanced trade intelligence with a structured quantitative methodology. The framework analyzes emerging demand trends and country-level import patterns while integrating macroeconomic and trade datasets such as GDP and population forecasts, bilateral import–export flows, tariff structures, elasticity differentials between developed and developing economies, geographic distance, and import demand projections. Using weighted trade values from 2020–2024 as the base period to project country-to-country export potential for 2030, these inputs are operationalized through calculated drivers such as gravity model parameters, tariff impact factors, and projected GDP per-capita growth. Through an analysis of hidden potentials, demand hotspots, and market conditions that are most favorable to success, this method enables firms to focus on target countries, maximize returns, and global expansion with data, backed by accuracy.
By factoring in the projected importer demand gap that is currently unmet and could be potential opportunity, it identifies the potential for the Exporter (Country) among 190 countries, against the general trade analysis, which identifies the biggest importer or exporter.
To discover high-growth global markets and optimize your business strategy:
Click Here
Pricing
- Single User License$ 1,995
- Department License$ 2,400
- Site License$ 3,120
- Global License$ 3,795

Thought Leadership
Search
Thought Leadership and Analyst Meet


Our Clients
Latest Reports
- New Zealand Aseptic Manufacturing Market (2026-2032)
- Netherlands Aseptic Manufacturing Market (2026-2032)
- Nauru Aseptic Manufacturing Market (2026-2032)
- Namibia Aseptic Manufacturing Market (2026-2032)
- Mozambique Aseptic Manufacturing Market (2026-2032)
- Montenegro Aseptic Manufacturing Market (2026-2032)
- Mongolia Aseptic Manufacturing Market (2026-2032)
- Monaco Aseptic Manufacturing Market (2026-2032)
- Micronesia Aseptic Manufacturing Market (2026-2032)
- Mauritius Aseptic Manufacturing Market (2026-2032)
Industry Events and Analyst Meet

HIMTEX 2026

India Refining Summit 2026

India EV Show 2026

EV tech India Expo 2026

Auto Tech Asia 2026
Whitepaper
- Middle East & Africa Commercial Security Market Click here to view more.
- Middle East & Africa Fire Safety Systems & Equipment Market Click here to view more.
- GCC Drone Market Click here to view more.
- Middle East Lighting Fixture Market Click here to view more.
- GCC Physical & Perimeter Security Market Click here to view more.
6WResearch In News
- Doha a strategic location for EV manufacturing hub: IPA Qatar
- Demand for luxury TVs surging in the GCC, says Samsung
- Empowering Growth: The Thriving Journey of Bangladesh’s Cable Industry
- Demand for luxury TVs surging in the GCC, says Samsung
- Video call with a traditional healer? Once unthinkable, it’s now common in South Africa
- Intelligent Buildings To Smooth GCC’s Path To Net Zero