Lithuania Optical Fiber Cables Market (2026-2032) | Trends, Consumer Insights, Supply, Challenges, Strategy, Restraints, Segments, Analysis, Size, Investment Trends, Competition, Industry, Companies, Growth, Share, Competitive, Value, Opportunities, Drivers, Outlook, Revenue, Pricing Analysis, Strategic Insights, Demand, Forecast, Segmentation
Market Forecast By Type (Single Mode, Multi-Mode, Plastic Optical Fiber, Others), By Mode of Transmission (Plastic Optical Fiber, Glass Optical Fiber), By Application (Telecommunication, Military & Aerospace, Industrial, Others), By Material (Glass, Plastic), By End Use (Data Centers, Enterprises, Healthcare, Residential) And Competitive Landscape
| Product Code: ETC10712058 | Publication Date: Apr 2025 | Updated Date: Apr 2026 | Product Type: Market Research Report | |
| Publisher: 6Wresearch | No. of Pages: 65 | No. of Figures: 34 | No. of Tables: 19 | |
Lithuania Optical Fiber Cables Market Size (2020-2030)
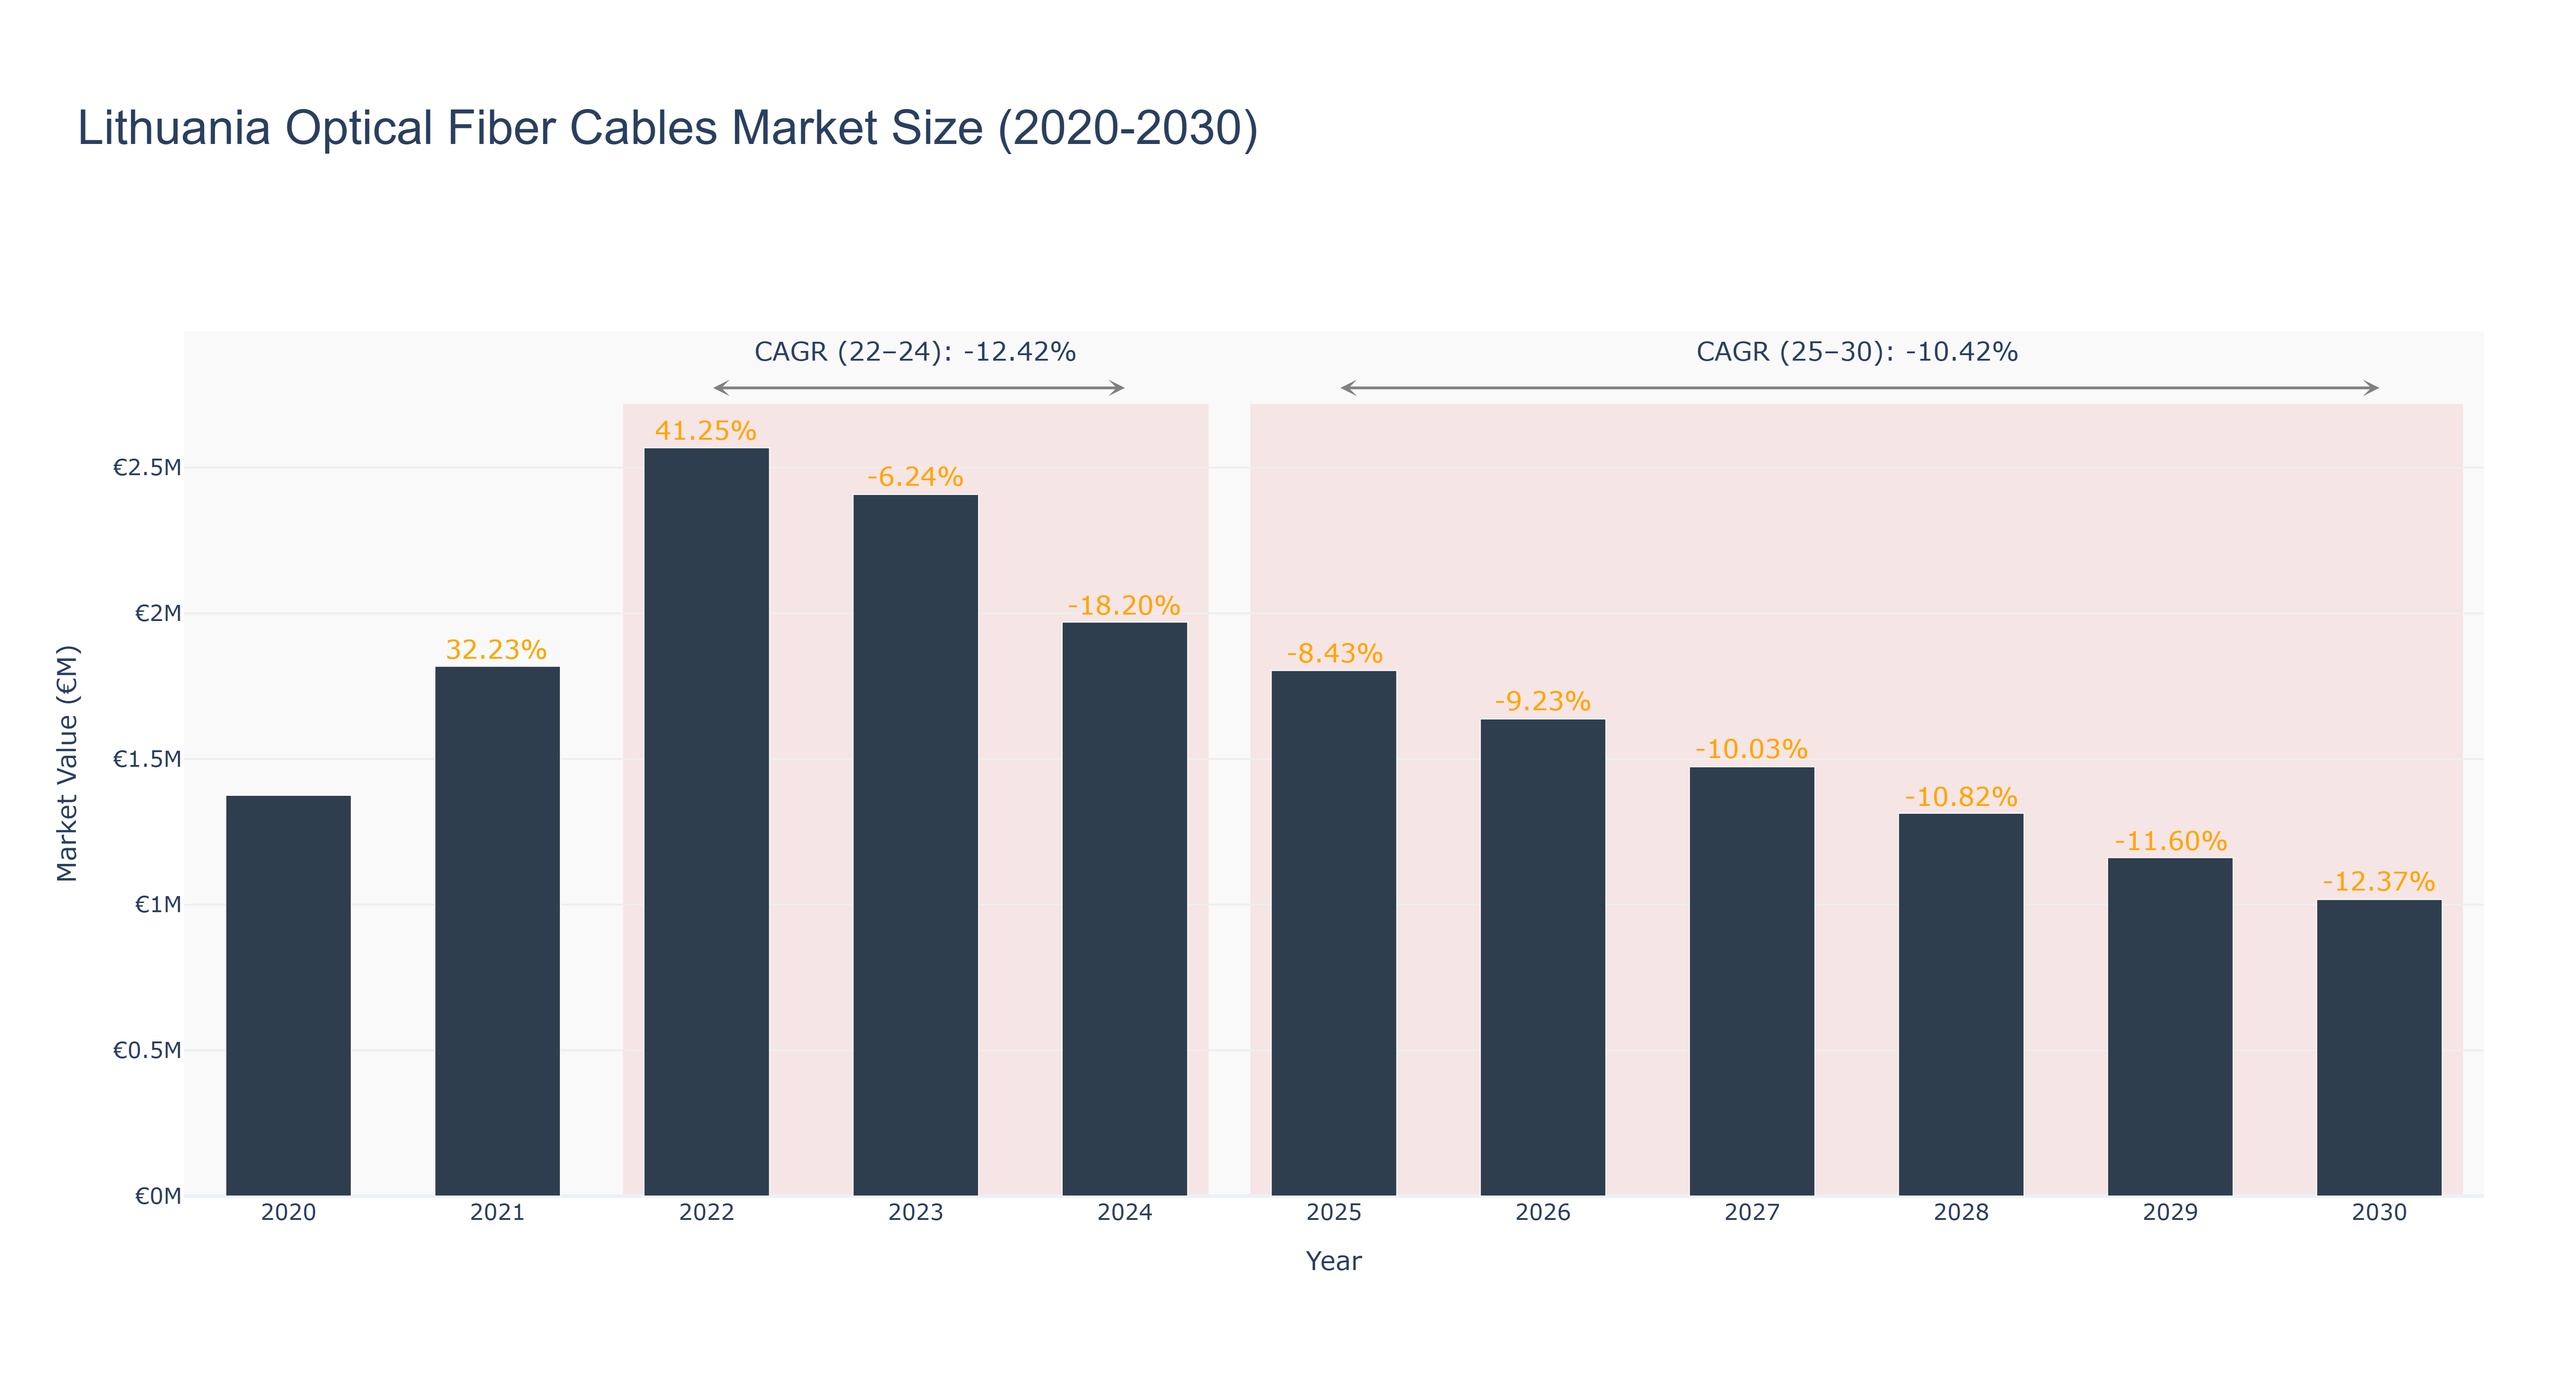
The Lithuania Optical Fiber Cables Market experienced significant growth in the early years, peaking at €2.57 million in 2022, with a remarkable growth rate of 41.25%. However, this upward trajectory reversed sharply, leading to a market contraction of -6.24% in 2023 and a further decline of -18.20% in 2024, resulting in an actual market size of €1.97 million. This decline can be attributed to market saturation and reduced demand for new installations as existing infrastructure matures. Moving into the forecast period (2025-2030), the market is expected to continue its downward trend, with projected sizes decreasing from €1.80 million in 2025 to €1.02 million by 2030, reflecting a CAGR of -10.42%. This outlook suggests ongoing challenges, including potential technological shifts and competition from alternative connectivity solutions, though advancements in network infrastructure may provide some stabilization.
Lithuania Optical Fiber Cables Market: Production & Trade Performance (2019-2025)
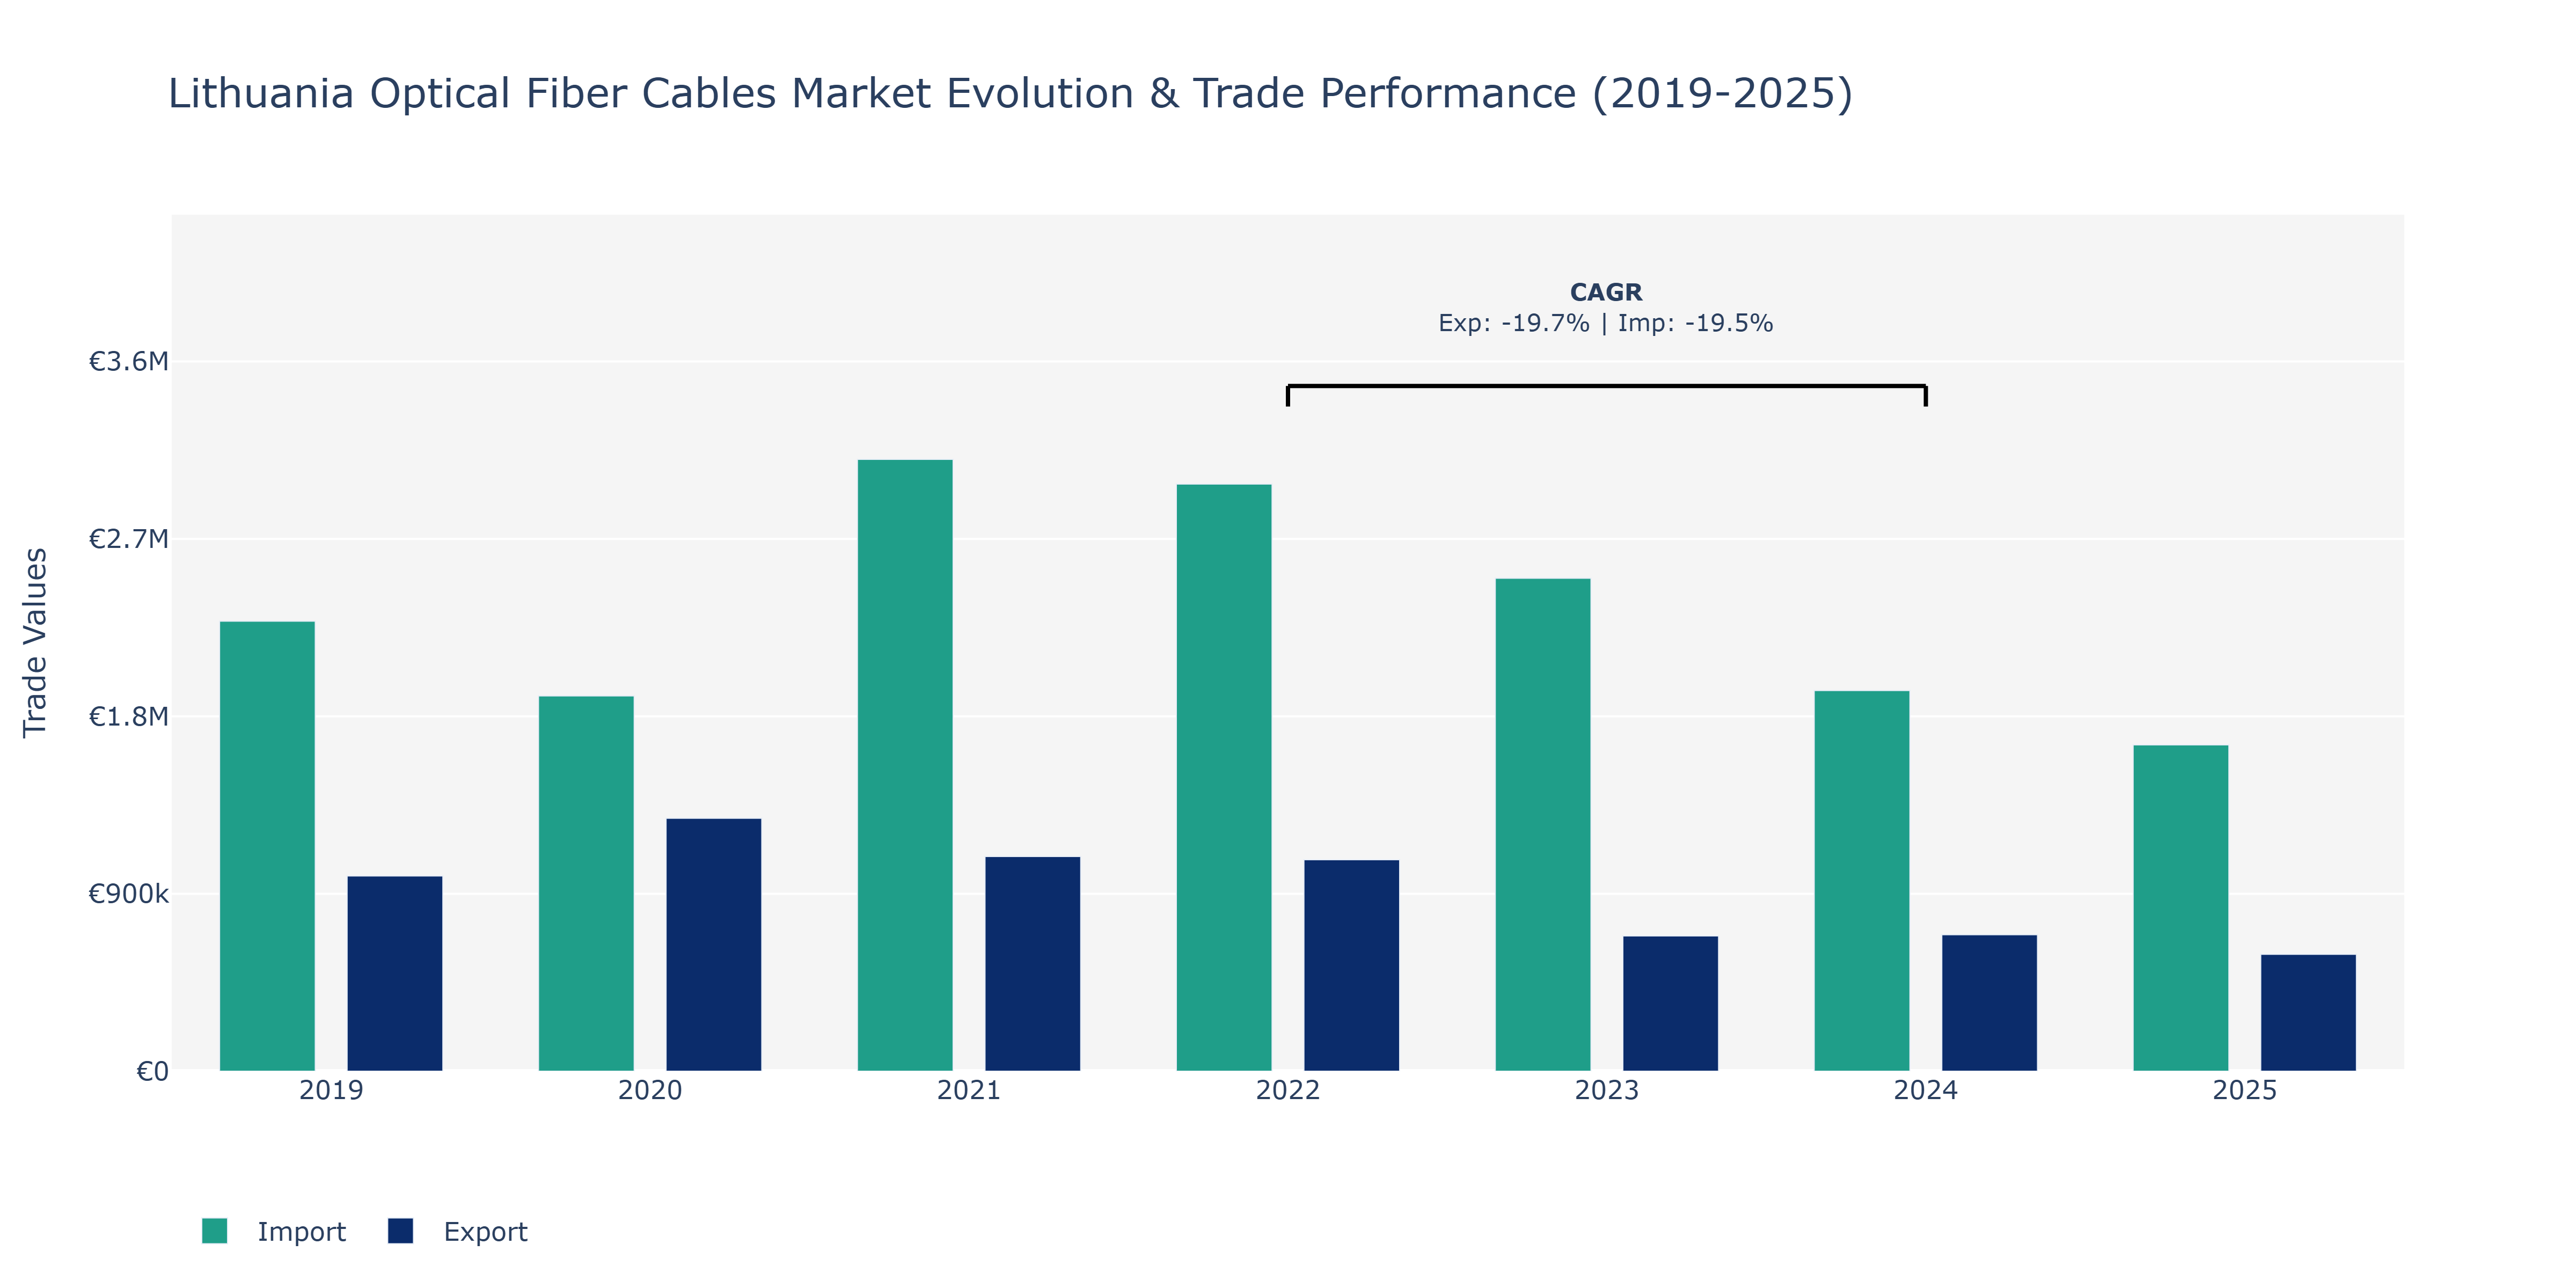
The Lithuania Optical Fiber Cables Market experienced fluctuations in both Exports and Imports over the specified years. In 2019, Imports led significantly at €2.28 million compared to Exports at €990.31 thousand. However, in 2021, Imports surged to €3.1 million while Exports decreased to €1.09 million. This reversal indicates a substantial shift in trade dynamics. By 2023, both Exports and Imports declined notably, with Exports at €685.95 thousand and Imports at €2.5 million. The declining trend continued in 2025, with Exports decreasing to €592.5 thousand and Imports to €1.66 million. The CAGR for both Exports and Imports from 2022 to 2024 stood at around -19.5%, reflecting a mutual downturn in trade. Factors such as changing global demand for optical fiber cables, evolving technology standards, and market competition could have influenced these trends. The market may witness further adjustments in response to emerging technologies and geopolitical developments affecting international trade patterns.
Key Highlights of the Report:
- Lithuania Optical Fiber Cables Market Outlook
- Market Size of Lithuania Optical Fiber Cables Market, 2025
- Forecast of Lithuania Optical Fiber Cables Market, 2032
- Historical Data and Forecast of Lithuania Optical Fiber Cables Revenues & Volume for the Period 2022 - 2032F
- Lithuania Optical Fiber Cables Market Trend Evolution
- Lithuania Optical Fiber Cables Market Drivers and Challenges
- Lithuania Optical Fiber Cables Price Trends
- Lithuania Optical Fiber Cables Porter's Five Forces
- Lithuania Optical Fiber Cables Industry Life Cycle
- Historical Data and Forecast of Lithuania Optical Fiber Cables Market Revenues & Volume By Type for the Period 2022 - 2032F
- Historical Data and Forecast of Lithuania Optical Fiber Cables Market Revenues & Volume By Single Mode for the Period 2022 - 2032F
- Historical Data and Forecast of Lithuania Optical Fiber Cables Market Revenues & Volume By Multi-Mode for the Period 2022 - 2032F
- Historical Data and Forecast of Lithuania Optical Fiber Cables Market Revenues & Volume By Plastic Optical Fiber for the Period 2022 - 2032F
- Historical Data and Forecast of Lithuania Optical Fiber Cables Market Revenues & Volume By Others for the Period 2022 - 2032F
- Historical Data and Forecast of Lithuania Optical Fiber Cables Market Revenues & Volume By Mode of Transmission for the Period 2022 - 2032F
- Historical Data and Forecast of Lithuania Optical Fiber Cables Market Revenues & Volume By Plastic Optical Fiber for the Period 2022 - 2032F
- Historical Data and Forecast of Lithuania Optical Fiber Cables Market Revenues & Volume By Glass Optical Fiber for the Period 2022 - 2032F
- Historical Data and Forecast of Lithuania Optical Fiber Cables Market Revenues & Volume By Application for the Period 2022 - 2032F
- Historical Data and Forecast of Lithuania Optical Fiber Cables Market Revenues & Volume By Telecommunication for the Period 2022 - 2032F
- Historical Data and Forecast of Lithuania Optical Fiber Cables Market Revenues & Volume By Military & Aerospace for the Period 2022 - 2032F
- Historical Data and Forecast of Lithuania Optical Fiber Cables Market Revenues & Volume By Industrial for the Period 2022 - 2032F
- Historical Data and Forecast of Lithuania Optical Fiber Cables Market Revenues & Volume By Others for the Period 2022 - 2032F
- Historical Data and Forecast of Lithuania Optical Fiber Cables Market Revenues & Volume By Material for the Period 2022 - 2032F
- Historical Data and Forecast of Lithuania Optical Fiber Cables Market Revenues & Volume By Glass for the Period 2022 - 2032F
- Historical Data and Forecast of Lithuania Optical Fiber Cables Market Revenues & Volume By Plastic for the Period 2022 - 2032F
- Historical Data and Forecast of Lithuania Optical Fiber Cables Market Revenues & Volume By End Use for the Period 2022 - 2032F
- Historical Data and Forecast of Lithuania Optical Fiber Cables Market Revenues & Volume By Data Centers for the Period 2022 - 2032F
- Historical Data and Forecast of Lithuania Optical Fiber Cables Market Revenues & Volume By Enterprises for the Period 2022 - 2032F
- Historical Data and Forecast of Lithuania Optical Fiber Cables Market Revenues & Volume By Healthcare for the Period 2022 - 2032F
- Historical Data and Forecast of Lithuania Optical Fiber Cables Market Revenues & Volume By Residential for the Period 2022 - 2032F
- Lithuania Optical Fiber Cables Import Export Trade Statistics
- Market Opportunity Assessment By Type
- Market Opportunity Assessment By Mode of Transmission
- Market Opportunity Assessment By Application
- Market Opportunity Assessment By Material
- Market Opportunity Assessment By End Use
- Lithuania Optical Fiber Cables Top Companies Market Share
- Lithuania Optical Fiber Cables Competitive Benchmarking By Technical and Operational Parameters
- Lithuania Optical Fiber Cables Company Profiles
- Lithuania Optical Fiber Cables Key Strategic Recommendations
Frequently Asked Questions About the Market Study (FAQs):
6Wresearch actively monitors the Lithuania Optical Fiber Cables Market and publishes its comprehensive annual report, highlighting emerging trends, growth drivers, revenue analysis, and forecast outlook. Our insights help businesses to make data-backed strategic decisions with ongoing market dynamics. Our analysts track relevent industries related to the Lithuania Optical Fiber Cables Market, allowing our clients with actionable intelligence and reliable forecasts tailored to emerging regional needs.
Yes, we provide customisation as per your requirements. To learn more, feel free to contact us on sales@6wresearch.com
1 Executive Summary |
2 Introduction |
2.1 Key Highlights of the Report |
2.2 Report Description |
2.3 Market Scope & Segmentation |
2.4 Research Methodology |
2.5 Assumptions |
3 Lithuania Optical Fiber Cables Market Overview |
3.1 Lithuania Country Macro Economic Indicators |
3.2 Lithuania Optical Fiber Cables Market Revenues & Volume, 2022 & 2032F |
3.3 Lithuania Optical Fiber Cables Market - Industry Life Cycle |
3.4 Lithuania Optical Fiber Cables Market - Porter's Five Forces |
3.5 Lithuania Optical Fiber Cables Market Revenues & Volume Share, By Type, 2022 & 2032F |
3.6 Lithuania Optical Fiber Cables Market Revenues & Volume Share, By Mode of Transmission, 2022 & 2032F |
3.7 Lithuania Optical Fiber Cables Market Revenues & Volume Share, By Application, 2022 & 2032F |
3.8 Lithuania Optical Fiber Cables Market Revenues & Volume Share, By Material, 2022 & 2032F |
3.9 Lithuania Optical Fiber Cables Market Revenues & Volume Share, By End Use, 2022 & 2032F |
4 Lithuania Optical Fiber Cables Market Dynamics |
4.1 Impact Analysis |
4.2 Market Drivers |
4.2.1 Increasing demand for high-speed internet and data transmission services |
4.2.2 Government initiatives and investments in expanding telecom infrastructure |
4.2.3 Growing adoption of fiber-to-the-home (FTTH) technology |
4.3 Market Restraints |
4.3.1 High initial installation costs of optical fiber cables |
4.3.2 Limited availability of skilled workforce for installation and maintenance |
4.3.3 Competition from alternative technologies such as wireless communication |
5 Lithuania Optical Fiber Cables Market Trends |
6 Lithuania Optical Fiber Cables Market, By Types |
6.1 Lithuania Optical Fiber Cables Market, By Type |
6.1.1 Overview and Analysis |
6.1.2 Lithuania Optical Fiber Cables Market Revenues & Volume, By Type, 2022 - 2032F |
6.1.3 Lithuania Optical Fiber Cables Market Revenues & Volume, By Single Mode, 2022 - 2032F |
6.1.4 Lithuania Optical Fiber Cables Market Revenues & Volume, By Multi-Mode, 2022 - 2032F |
6.1.5 Lithuania Optical Fiber Cables Market Revenues & Volume, By Plastic Optical Fiber, 2022 - 2032F |
6.1.6 Lithuania Optical Fiber Cables Market Revenues & Volume, By Others, 2022 - 2032F |
6.2 Lithuania Optical Fiber Cables Market, By Mode of Transmission |
6.2.1 Overview and Analysis |
6.2.2 Lithuania Optical Fiber Cables Market Revenues & Volume, By Plastic Optical Fiber, 2022 - 2032F |
6.2.3 Lithuania Optical Fiber Cables Market Revenues & Volume, By Glass Optical Fiber, 2022 - 2032F |
6.3 Lithuania Optical Fiber Cables Market, By Application |
6.3.1 Overview and Analysis |
6.3.2 Lithuania Optical Fiber Cables Market Revenues & Volume, By Telecommunication, 2022 - 2032F |
6.3.3 Lithuania Optical Fiber Cables Market Revenues & Volume, By Military & Aerospace, 2022 - 2032F |
6.3.4 Lithuania Optical Fiber Cables Market Revenues & Volume, By Industrial, 2022 - 2032F |
6.3.5 Lithuania Optical Fiber Cables Market Revenues & Volume, By Others, 2022 - 2032F |
6.4 Lithuania Optical Fiber Cables Market, By Material |
6.4.1 Overview and Analysis |
6.4.2 Lithuania Optical Fiber Cables Market Revenues & Volume, By Glass, 2022 - 2032F |
6.4.3 Lithuania Optical Fiber Cables Market Revenues & Volume, By Plastic, 2022 - 2032F |
6.5 Lithuania Optical Fiber Cables Market, By End Use |
6.5.1 Overview and Analysis |
6.5.2 Lithuania Optical Fiber Cables Market Revenues & Volume, By Data Centers, 2022 - 2032F |
6.5.3 Lithuania Optical Fiber Cables Market Revenues & Volume, By Enterprises, 2022 - 2032F |
6.5.4 Lithuania Optical Fiber Cables Market Revenues & Volume, By Healthcare, 2022 - 2032F |
6.5.5 Lithuania Optical Fiber Cables Market Revenues & Volume, By Residential, 2022 - 2032F |
7 Lithuania Optical Fiber Cables Market Import-Export Trade Statistics |
7.1 Lithuania Optical Fiber Cables Market Export to Major Countries |
7.2 Lithuania Optical Fiber Cables Market Imports from Major Countries |
8 Lithuania Optical Fiber Cables Market Key Performance Indicators |
8.1 Average revenue per user (ARPU) for broadband services |
8.2 Percentage increase in the number of FTTH connections |
8.3 Average time taken for installation and activation of optical fiber connections |
8.4 Customer satisfaction ratings for optical fiber internet services |
8.5 Percentage of households covered by optical fiber network |
9 Lithuania Optical Fiber Cables Market - Opportunity Assessment |
9.1 Lithuania Optical Fiber Cables Market Opportunity Assessment, By Type, 2022 & 2032F |
9.2 Lithuania Optical Fiber Cables Market Opportunity Assessment, By Mode of Transmission, 2022 & 2032F |
9.3 Lithuania Optical Fiber Cables Market Opportunity Assessment, By Application, 2022 & 2032F |
9.4 Lithuania Optical Fiber Cables Market Opportunity Assessment, By Material, 2022 & 2032F |
9.5 Lithuania Optical Fiber Cables Market Opportunity Assessment, By End Use, 2022 & 2032F |
10 Lithuania Optical Fiber Cables Market - Competitive Landscape |
10.1 Lithuania Optical Fiber Cables Market Revenue Share, By Companies, 2025 |
10.2 Lithuania Optical Fiber Cables Market Competitive Benchmarking, By Operating and Technical Parameters |
11 Company Profiles |
12 Recommendations |
13 Disclaimer |
Global Go To Market Strategy - 2030
Export potential enables firms to identify high-growth global markets with greater confidence by combining advanced trade intelligence with a structured quantitative methodology. The framework analyzes emerging demand trends and country-level import patterns while integrating macroeconomic and trade datasets such as GDP and population forecasts, bilateral import–export flows, tariff structures, elasticity differentials between developed and developing economies, geographic distance, and import demand projections. Using weighted trade values from 2020–2024 as the base period to project country-to-country export potential for 2030, these inputs are operationalized through calculated drivers such as gravity model parameters, tariff impact factors, and projected GDP per-capita growth. Through an analysis of hidden potentials, demand hotspots, and market conditions that are most favorable to success, this method enables firms to focus on target countries, maximize returns, and global expansion with data, backed by accuracy.
By factoring in the projected importer demand gap that is currently unmet and could be potential opportunity, it identifies the potential for the Exporter (Country) among 190 countries, against the general trade analysis, which identifies the biggest importer or exporter.
To discover high-growth global markets and optimize your business strategy:
Click Here
Pricing
- Single User License$ 1,995
- Department License$ 2,400
- Site License$ 3,120
- Global License$ 3,795

Leadership Perspectives from Industry Events
Search
Thought Leadership and Analyst Meet


Our Clients
6WResearch In News
- Doha a strategic location for EV manufacturing hub: IPA Qatar
- Demand for luxury TVs surging in the GCC, says Samsung
- Empowering Growth: The Thriving Journey of Bangladesh’s Cable Industry
- Demand for luxury TVs surging in the GCC, says Samsung
- Video call with a traditional healer? Once unthinkable, it’s now common in South Africa
- Intelligent Buildings To Smooth GCC’s Path To Net Zero
Latest Reports
- New Zealand Aseptic Manufacturing Market (2026-2032)
- Netherlands Aseptic Manufacturing Market (2026-2032)
- Nauru Aseptic Manufacturing Market (2026-2032)
- Namibia Aseptic Manufacturing Market (2026-2032)
- Mozambique Aseptic Manufacturing Market (2026-2032)
- Montenegro Aseptic Manufacturing Market (2026-2032)
- Mongolia Aseptic Manufacturing Market (2026-2032)
- Monaco Aseptic Manufacturing Market (2026-2032)
- Micronesia Aseptic Manufacturing Market (2026-2032)
- Mauritius Aseptic Manufacturing Market (2026-2032)
Industry Events and Analyst Meet

HIMTEX 2026

India Refining Summit 2026

India EV Show 2026

EV tech India Expo 2026

Auto Tech Asia 2026
Whitepaper
- Middle East & Africa Commercial Security Market Click here to view more.
- Middle East & Africa Fire Safety Systems & Equipment Market Click here to view more.
- GCC Drone Market Click here to view more.
- Middle East Lighting Fixture Market Click here to view more.
- GCC Physical & Perimeter Security Market Click here to view more.