Lithuania Particle Board Market (2026-2032) | Industry, Share, Outlook, Trends, Companies, Revenue, Growth, Forecast, Value, Analysis, Size & Segmentation
Market Forecast By Type (Standard Chipboard, Melamine Veneered Chipboard, Flooring Grade Chipboard, Wood Veneered Chipboard, Plastic Veneered Chipboard, Other), By Application (Construction, Furniture, Infrastructure, Other) And Competitive Landscape
| Product Code: ETC5226826 | Publication Date: Nov 2023 | Updated Date: Apr 2026 | Product Type: Market Research Report | |
| Publisher: 6Wresearch | Author: Shubham Padhi | No. of Pages: 60 | No. of Figures: 30 | No. of Tables: 5 |
Lithuania Particle Board Market Size (2020-2030)
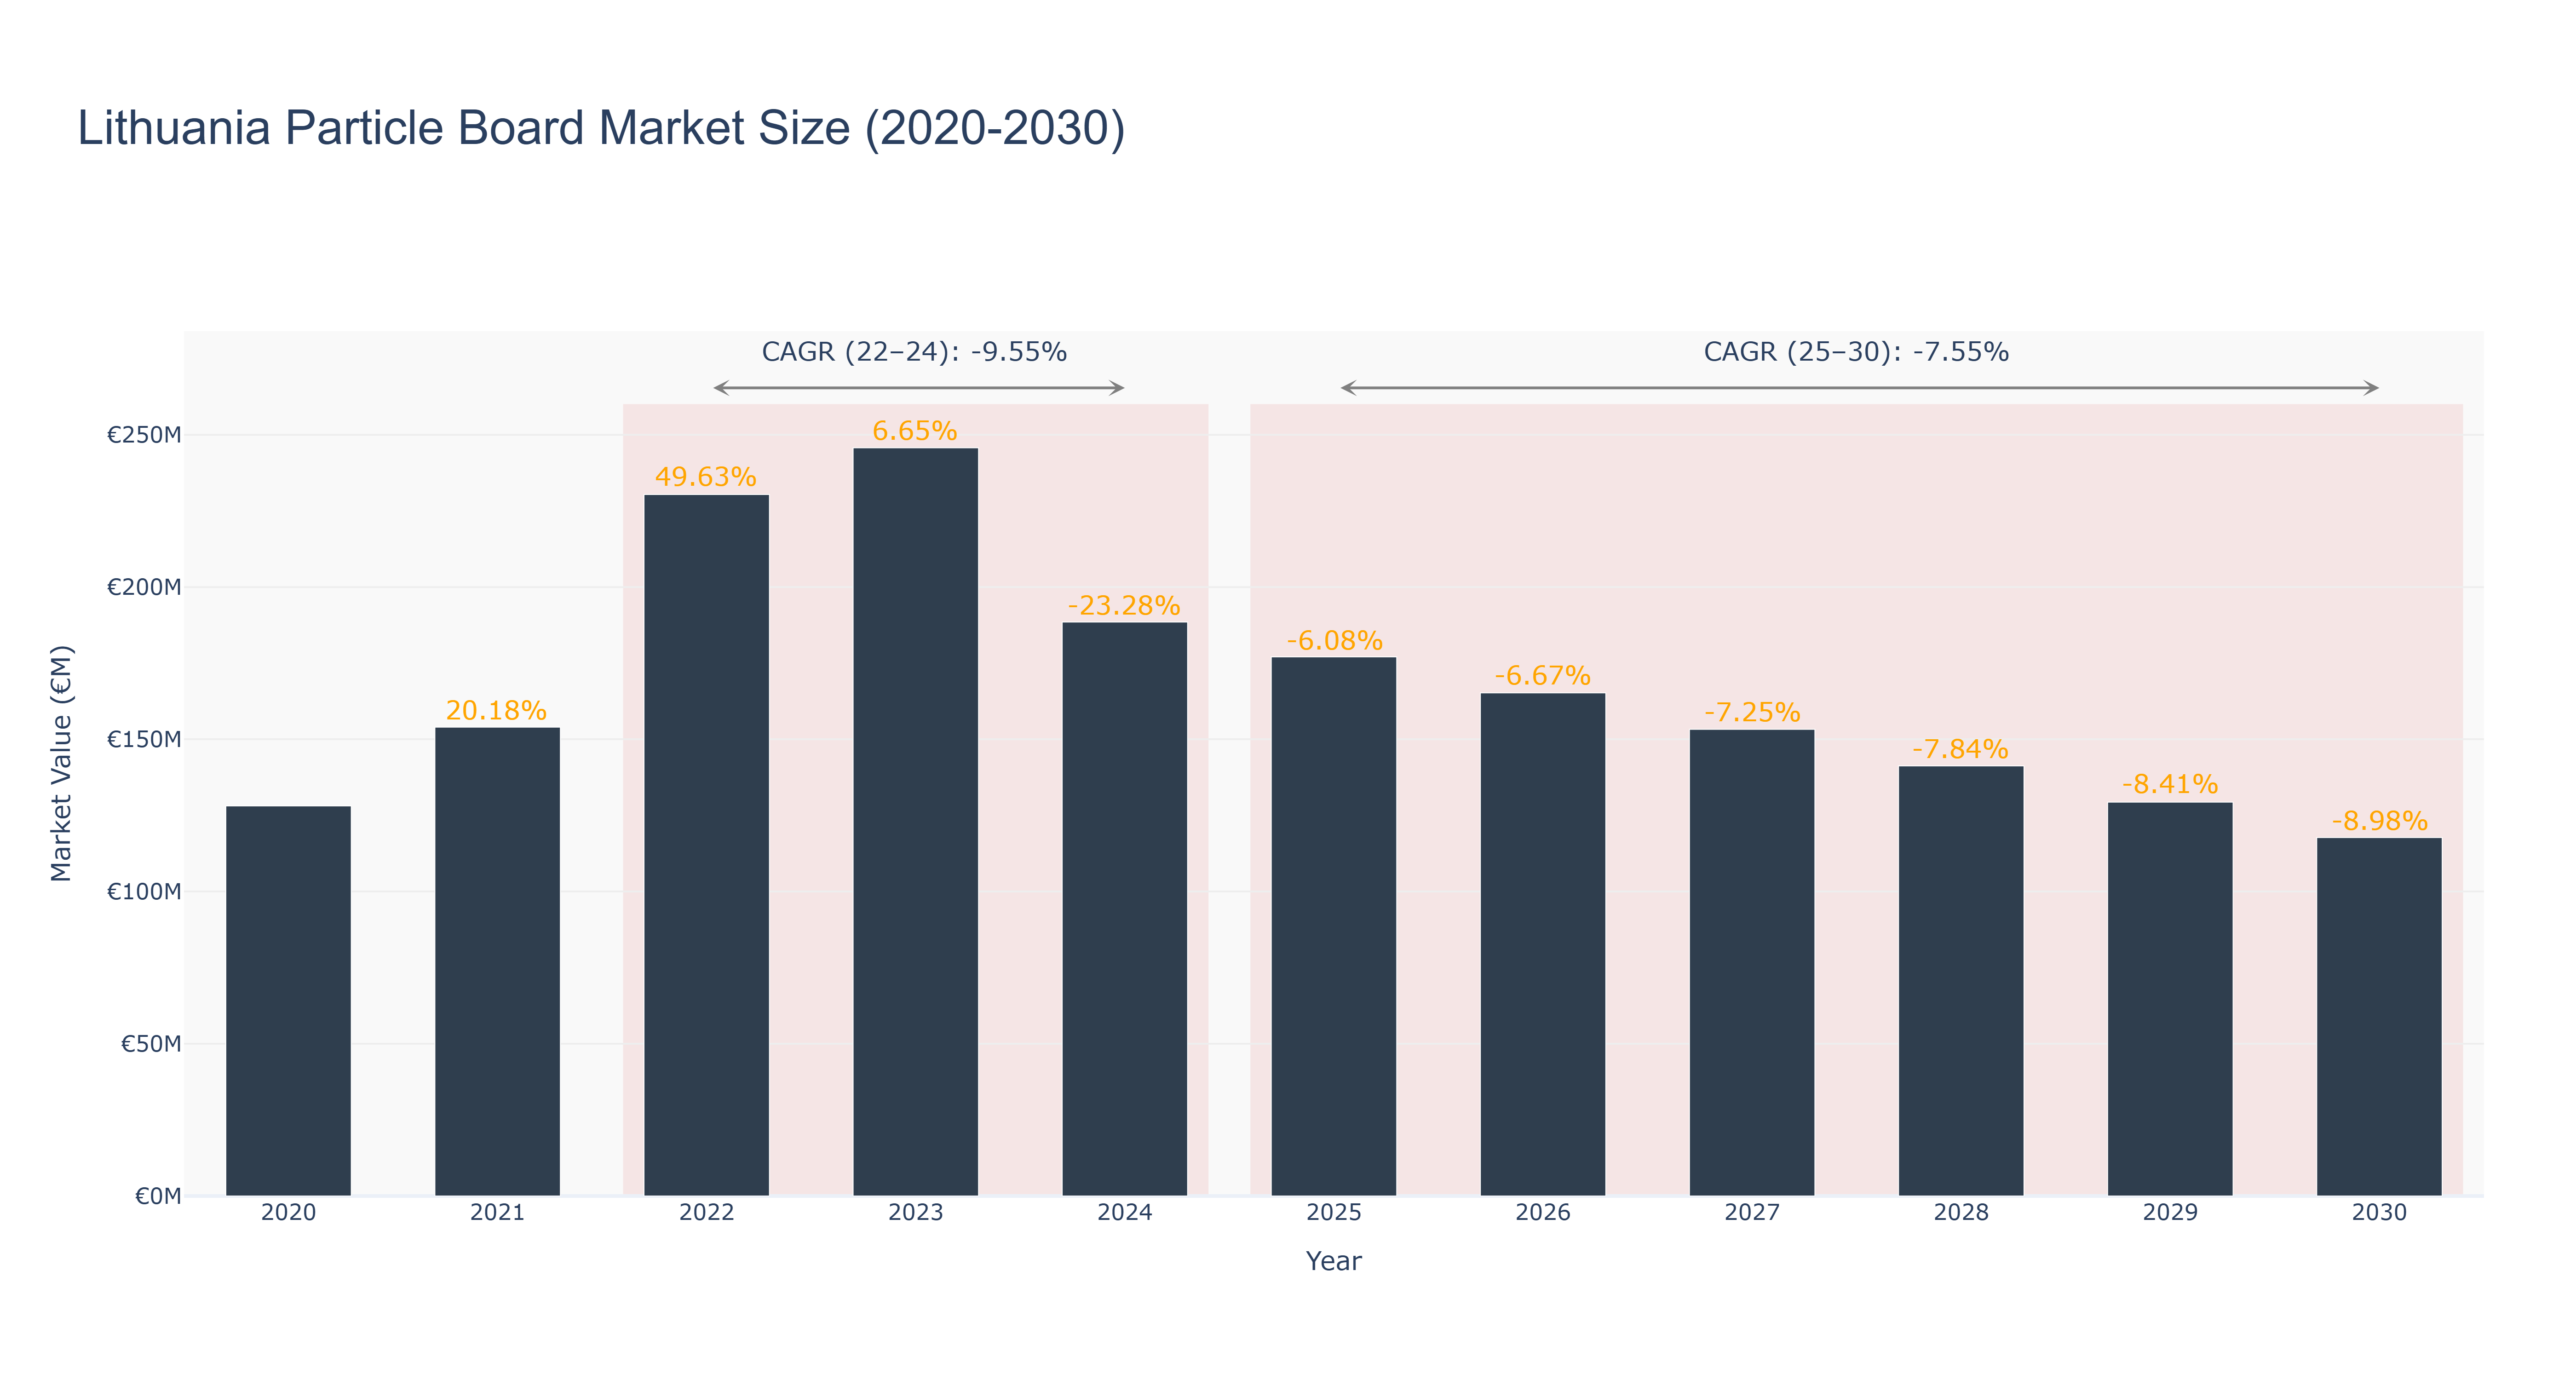
The Lithuania Particle Board Market experienced a peak size of €245.73 million in 2023, followed by a decline to €188.52 million in 2024. Forecasted market sizes show a continued decrease, with a projected value of €117.74 million in 2030. The CAGR from 2022-24 was -9.55%, while from 2025-30, it is expected to be -7.55%. The market faced a downturn due to economic factors impacting the construction industry, leading to reduced demand for particle boards. However, recent initiatives to promote sustainable building materials in Lithuania are expected to drive future growth. The upcoming introduction of stricter environmental regulations and increased focus on green construction practices are likely to boost demand for particle boards in the market.
Lithuania Particle Board Market: Production & Trade Performance (2019-2025)
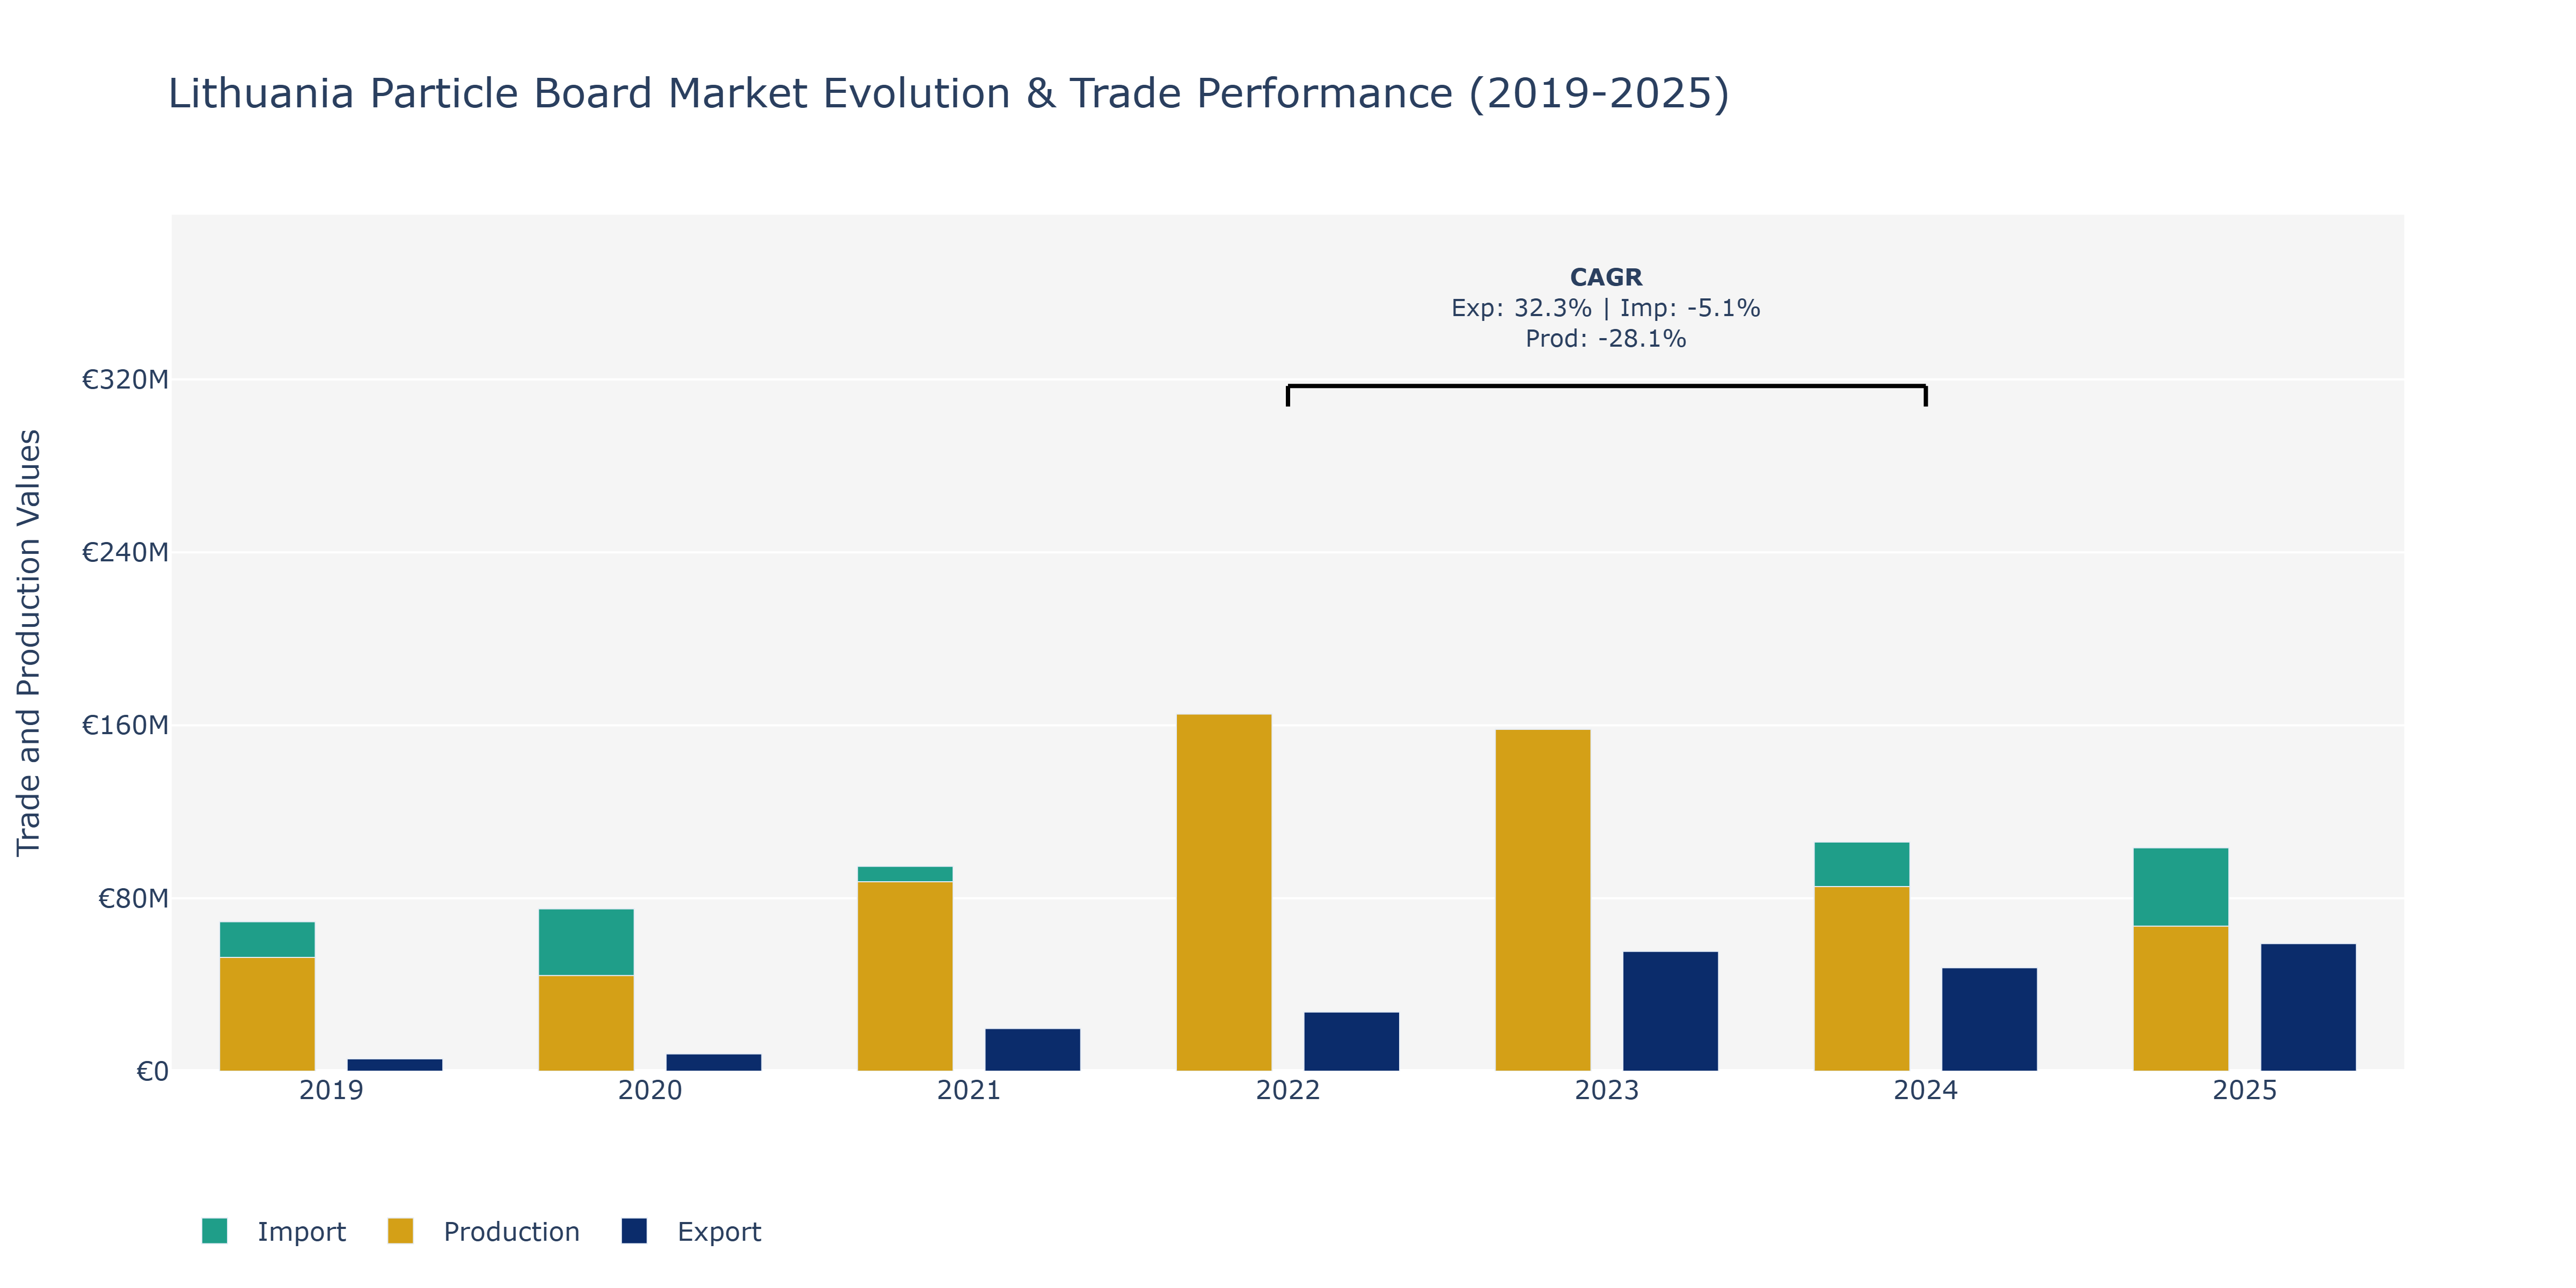
In the Lithuania Particle Board Market, from 2019 to 2025, Exports displayed a fluctuating pattern. Exports started at €5.69 million in 2019, increased to €8.04 million in 2020, peaked at €59.04 million in 2023, and then slightly declined to €59.04 million in 2025. This rise can be attributed to increasing global demand for particle board products from Lithuania due to their quality and competitive pricing. In contrast, Imports consistently rose from €69.16 million in 2019 to €103.33 million in 2025, reflecting a trend of steady growth in imported particle board products. The growth in Imports could be influenced by the need to supplement domestic production with foreign sources to meet local demand. On the other hand, Production experienced a notable decline from €52.61 million in 2019 to €67.07 million in 2025. This decline could be due to factors such as changes in market demand, fluctuations in raw material prices, or technological advancements affecting production efficiencies. To sustain and further develop the market, companies may need to focus on enhancing domestic production capabilities and optimizing supply chain strategies to compete effectively in the global particle board market.
Key Highlights of the Report:
- Lithuania Particle Board Market Outlook
- Market Size of Lithuania Particle Board Market, 2025
- Forecast of Lithuania Particle Board Market, 2032
- Historical Data and Forecast of Lithuania Particle Board Revenues & Volume for the Period 2022 - 2032F
- Lithuania Particle Board Market Trend Evolution
- Lithuania Particle Board Market Drivers and Challenges
- Lithuania Particle Board Price Trends
- Lithuania Particle Board Porter`s Five Forces
- Lithuania Particle Board Industry Life Cycle
- Historical Data and Forecast of Lithuania Particle Board Market Revenues & Volume By Type for the Period 2022 - 2032F
- Historical Data and Forecast of Lithuania Particle Board Market Revenues & Volume By Standard Chipboard for the Period 2022 - 2032F
- Historical Data and Forecast of Lithuania Particle Board Market Revenues & Volume By Melamine Veneered Chipboard for the Period 2022 - 2032F
- Historical Data and Forecast of Lithuania Particle Board Market Revenues & Volume By Flooring Grade Chipboard for the Period 2022 - 2032F
- Historical Data and Forecast of Lithuania Particle Board Market Revenues & Volume By Wood Veneered Chipboard for the Period 2022 - 2032F
- Historical Data and Forecast of Lithuania Particle Board Market Revenues & Volume By Plastic Veneered Chipboard for the Period 2022 - 2032F
- Historical Data and Forecast of Lithuania Particle Board Market Revenues & Volume By Other for the Period 2022 - 2032F
- Historical Data and Forecast of Lithuania Particle Board Market Revenues & Volume By Application for the Period 2022 - 2032F
- Historical Data and Forecast of Lithuania Particle Board Market Revenues & Volume By Construction for the Period 2022 - 2032F
- Historical Data and Forecast of Lithuania Particle Board Market Revenues & Volume By Furniture for the Period 2022 - 2032F
- Historical Data and Forecast of Lithuania Particle Board Market Revenues & Volume By Infrastructure for the Period 2022 - 2032F
- Historical Data and Forecast of Lithuania Particle Board Market Revenues & Volume By Other for the Period 2022 - 2032F
- Lithuania Particle Board Import Export Trade Statistics
- Market Opportunity Assessment By Type
- Market Opportunity Assessment By Application
- Lithuania Particle Board Top Companies Market Share
- Lithuania Particle Board Competitive Benchmarking By Technical and Operational Parameters
- Lithuania Particle Board Company Profiles
- Lithuania Particle Board Key Strategic Recommendations
Frequently Asked Questions About the Market Study (FAQs):
6Wresearch actively monitors the Lithuania Particle Board Market and publishes its comprehensive annual report, highlighting emerging trends, growth drivers, revenue analysis, and forecast outlook. Our insights help businesses to make data-backed strategic decisions with ongoing market dynamics. Our analysts track relevent industries related to the Lithuania Particle Board Market, allowing our clients with actionable intelligence and reliable forecasts tailored to emerging regional needs.
Yes, we provide customisation as per your requirements. To learn more, feel free to contact us on sales@6wresearch.com
1 Executive Summary |
2 Introduction |
2.1 Key Highlights of the Report |
2.2 Report Description |
2.3 Market Scope & Segmentation |
2.4 Research Methodology |
2.5 Assumptions |
3 Lithuania Particle Board Market Overview |
3.1 Lithuania Country Macro Economic Indicators |
3.2 Lithuania Particle Board Market Revenues & Volume, 2022 & 2032F |
3.3 Lithuania Particle Board Market - Industry Life Cycle |
3.4 Lithuania Particle Board Market - Porter's Five Forces |
3.5 Lithuania Particle Board Market Revenues & Volume Share, By Type, 2022 & 2032F |
3.6 Lithuania Particle Board Market Revenues & Volume Share, By Application, 2022 & 2032F |
4 Lithuania Particle Board Market Dynamics |
4.1 Impact Analysis |
4.2 Market Drivers |
4.2.1 Growing demand for eco-friendly and sustainable building materials |
4.2.2 Increasing construction activities and infrastructure development in Lithuania |
4.2.3 Rising focus on interior design and furniture manufacturing industries |
4.3 Market Restraints |
4.3.1 Fluctuating raw material prices, such as wood and resin |
4.3.2 Intense competition from alternative materials like MDF and plywood |
4.3.3 Impact of economic downturns on the construction sector |
5 Lithuania Particle Board Market Trends |
6 Lithuania Particle Board Market Segmentations |
6.1 Lithuania Particle Board Market, By Type |
6.1.1 Overview and Analysis |
6.1.2 Lithuania Particle Board Market Revenues & Volume, By Standard Chipboard, 2022 - 2032F |
6.1.3 Lithuania Particle Board Market Revenues & Volume, By Melamine Veneered Chipboard, 2022 - 2032F |
6.1.4 Lithuania Particle Board Market Revenues & Volume, By Flooring Grade Chipboard, 2022 - 2032F |
6.1.5 Lithuania Particle Board Market Revenues & Volume, By Wood Veneered Chipboard, 2022 - 2032F |
6.1.6 Lithuania Particle Board Market Revenues & Volume, By Plastic Veneered Chipboard, 2022 - 2032F |
6.1.7 Lithuania Particle Board Market Revenues & Volume, By Other, 2022 - 2032F |
6.2 Lithuania Particle Board Market, By Application |
6.2.1 Overview and Analysis |
6.2.2 Lithuania Particle Board Market Revenues & Volume, By Construction, 2022 - 2032F |
6.2.3 Lithuania Particle Board Market Revenues & Volume, By Furniture, 2022 - 2032F |
6.2.4 Lithuania Particle Board Market Revenues & Volume, By Infrastructure, 2022 - 2032F |
6.2.5 Lithuania Particle Board Market Revenues & Volume, By Other, 2022 - 2032F |
7 Lithuania Particle Board Market Import-Export Trade Statistics |
7.1 Lithuania Particle Board Market Export to Major Countries |
7.2 Lithuania Particle Board Market Imports from Major Countries |
8 Lithuania Particle Board Market Key Performance Indicators |
8.1 Environmental certifications obtained by particle board manufacturers |
8.2 Percentage of new construction projects opting for particle board usage |
8.3 Investment in research and development for innovative particle board products |
9 Lithuania Particle Board Market - Opportunity Assessment |
9.1 Lithuania Particle Board Market Opportunity Assessment, By Type, 2022 & 2032F |
9.2 Lithuania Particle Board Market Opportunity Assessment, By Application, 2022 & 2032F |
10 Lithuania Particle Board Market - Competitive Landscape |
10.1 Lithuania Particle Board Market Revenue Share, By Companies, 2025 |
10.2 Lithuania Particle Board Market Competitive Benchmarking, By Operating and Technical Parameters |
11 Company Profiles |
12 Recommendations | 13 Disclaimer |
Export potential assessment - trade Analytics for 2030
Export potential enables firms to identify high-growth global markets with greater confidence by combining advanced trade intelligence with a structured quantitative methodology. The framework analyzes emerging demand trends and country-level import patterns while integrating macroeconomic and trade datasets such as GDP and population forecasts, bilateral import–export flows, tariff structures, elasticity differentials between developed and developing economies, geographic distance, and import demand projections. Using weighted trade values from 2020–2024 as the base period to project country-to-country export potential for 2030, these inputs are operationalized through calculated drivers such as gravity model parameters, tariff impact factors, and projected GDP per-capita growth. Through an analysis of hidden potentials, demand hotspots, and market conditions that are most favorable to success, this method enables firms to focus on target countries, maximize returns, and global expansion with data, backed by accuracy.
By factoring in the projected importer demand gap that is currently unmet and could be potential opportunity, it identifies the potential for the Exporter (Country) among 190 countries, against the general trade analysis, which identifies the biggest importer or exporter.
To discover high-growth global markets and optimize your business strategy:
Click Here
Pricing
- Single User License$ 1,995
- Department License$ 2,400
- Site License$ 3,120
- Global License$ 3,795

Search
Thought Leadership and Analyst Meet


Our Clients
Latest Reports
- India Ultrasonic Smart Water Meter Market (2026-2032) | Outlook, Competition, Drivers, Trends, Demand, Competitive, Strategic Insights, Companies, Challenges, Strategy, Consumer Insights, Analysis, Opportunities, Growth, Size, Share, Industry, Revenue, Segments, Value, Segmentation, Supply, Forecast, Restraints,
- India Electromagnetic Bulk Flow Meter Market (2026-2032) | Analysis, Challenges, Strategic Insights, Supply, Forecast, Growth, Share, Consumer Insights, Competitive, Value, Outlook, Size & Demand,
- India Battery Powered Bulk Flow Meter Market (2026-2032) | Outlook, Analysis, Competitive Landscape, Growth, Size, Trends, Value, Revenue, Companies, Segmentation, Share & Forecast
- Bosnia and Herzegovina Fuel-Efficient Winglets Market (2026-2032) | Growth, Competition, Strategy, Restraints, Trends, Challenges, segmentation, Value, Outlook, Investment Opportunities, Analysis, Revenue, Companies, Insights, Pricing, Size, Drivers, Demand, Share, Forecast
- Canada Cloud CFD Market (2026-2032) | Size & Revenue, Industry, Growth, Competitive Landscape, Forecast, Segmentation, Value, Outlook, Trends, Share, Analysis, Companies
- Taiwan Food Delivery Platform Market (2026-2032) | Companies, Outlook, Analysis, Trends, Value, Revenue, Segmentation, Share, Forecast, Competitive Landscape, Growth, Size & Forecast
- United Kingdom (UK) Long-term Care Insurance Market (2026-2032) | Growth, Share, Consumer Insights, Drivers, Opportunities, Competition, Pricing Analysis, Segments, Restraints, Companies, Competitive, Value, Outlook, Size, Demand, Analysis, Challenges, Strategic Insights, Investment Trends, Revenue, Trends, Supply, Forecast
- United Kingdom (UK) Long Term Care Market (2026-2032) | Companies, Outlook, Analysis, Trends, Value, Revenue, Segmentation, Share, Forecast, Competitive Landscape, Growth, Size & Forecast
- Iraq Insulation and Waterproofing Market (2026-2032) | Outlook, Drivers, Growth, Size, Share, Industry, Revenue, Trends, Demand, Competitive, Strategic Insights, Opportunities, Segments, Companies, Challenges, Strategy, Consumer Insights, Analysis, Investment Trends, Value, Segmentation, Forecast, Restraints
- India Switchgear Market Outlook (2026-2032) | Size, Share, Trends, Growth, Revenue, Forecast, Analysis, Value, Outlook
Industry Events and Analyst Meet

HIMTEX 2026

India Refining Summit 2026

India EV Show 2026

EV tech India Expo 2026

Auto Tech Asia 2026
Whitepaper
- Middle East & Africa Commercial Security Market Click here to view more.
- Middle East & Africa Fire Safety Systems & Equipment Market Click here to view more.
- GCC Drone Market Click here to view more.
- Middle East Lighting Fixture Market Click here to view more.
- GCC Physical & Perimeter Security Market Click here to view more.
6WResearch In News
- Doha a strategic location for EV manufacturing hub: IPA Qatar
- Demand for luxury TVs surging in the GCC, says Samsung
- Empowering Growth: The Thriving Journey of Bangladesh’s Cable Industry
- Demand for luxury TVs surging in the GCC, says Samsung
- Video call with a traditional healer? Once unthinkable, it’s now common in South Africa
- Intelligent Buildings To Smooth GCC’s Path To Net Zero