Lithuania Plenum Cable Market (2026-2032) | Companies, Value, Growth, Opportunities, Consumer Insights, Analysis, Investment Trends, Size, Share, Industry, Trends, Competitive, Strategy, Segments, Outlook, Supply, Drivers, Pricing Analysis, Demand, Segmentation, Challenges, Revenue, Competition, Restraints, Strategic Insights, Forecast
Market Forecast By Type (Fiber Optic, Coaxial, Ethernet, Speaker Cables), By Material (PVC, LSZH, Plenum-Rated, CMP), By Application (Data Centers, Commercial Buildings, Enterprise Networking, Security Systems), By End User (IT Companies, Telecom Operators, Infrastructure Providers, Audio-Visual Industry) And Competitive Landscape
| Product Code: ETC13112826 | Publication Date: Apr 2025 | Updated Date: Apr 2026 | Product Type: Market Research Report | |
| Publisher: 6Wresearch | Author: Sachin Kumar Rai | No. of Pages: 65 | No. of Figures: 34 | No. of Tables: 19 |
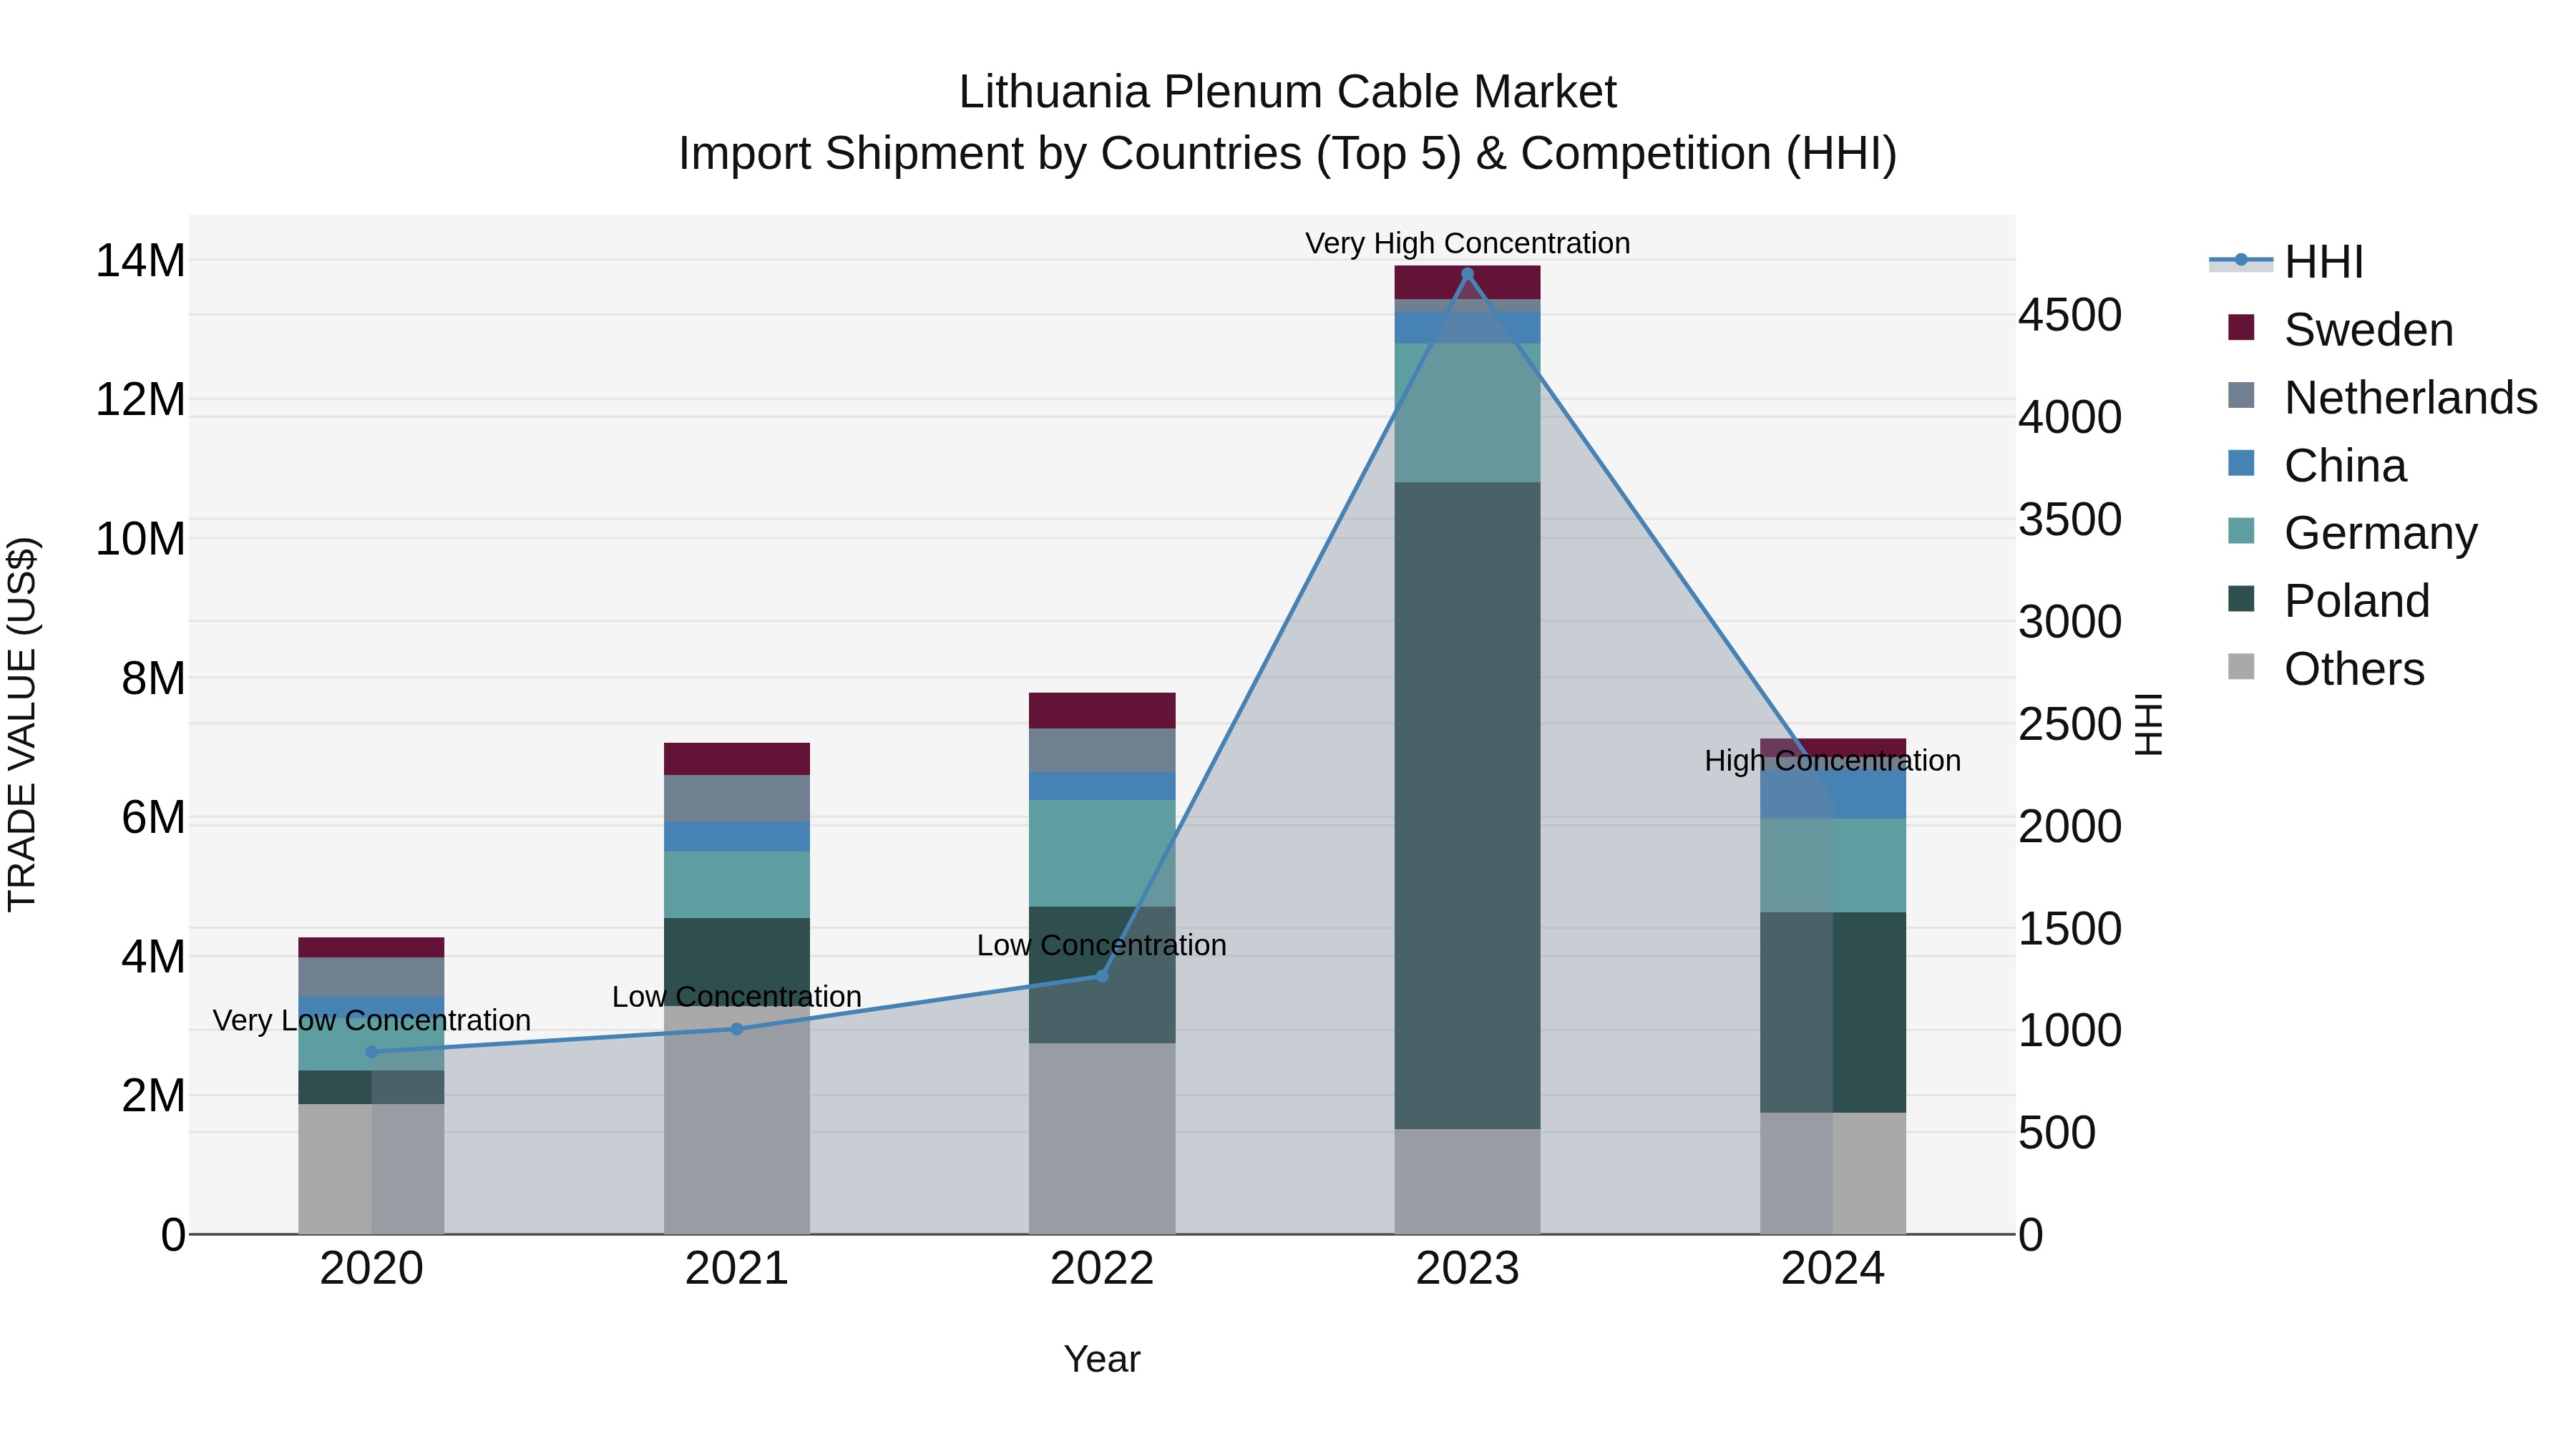
Lithuania Plenum Cable Market Top 5 Importing Countries and Market Competition (HHI) Analysis
Lithuania`s plenum cable import market saw a shift in concentration levels from very high to high in 2024, with top exporters being Poland, Germany, China, Latvia, and Sweden. Despite a significant drop in growth rate from 2023 to 2024, the compound annual growth rate (CAGR) over the period 2020-24 remained strong at 13.71%. This data suggests a competitive landscape in the market, with key players vying for market share and positioning themselves strategically to cater to Lithuania`s demand for plenum cables.
Key Highlights of the Report:
- Lithuania Plenum Cable Market Outlook
- Market Size of Lithuania Plenum Cable Market, 2025
- Forecast of Lithuania Plenum Cable Market, 2032
- Historical Data and Forecast of Lithuania Plenum Cable Revenues & Volume for the Period 2022 - 2032F
- Lithuania Plenum Cable Market Trend Evolution
- Lithuania Plenum Cable Market Drivers and Challenges
- Lithuania Plenum Cable Price Trends
- Lithuania Plenum Cable Porter's Five Forces
- Lithuania Plenum Cable Industry Life Cycle
- Historical Data and Forecast of Lithuania Plenum Cable Market Revenues & Volume By Type for the Period 2022 - 2032F
- Historical Data and Forecast of Lithuania Plenum Cable Market Revenues & Volume By Fiber Optic for the Period 2022 - 2032F
- Historical Data and Forecast of Lithuania Plenum Cable Market Revenues & Volume By Coaxial for the Period 2022 - 2032F
- Historical Data and Forecast of Lithuania Plenum Cable Market Revenues & Volume By Ethernet for the Period 2022 - 2032F
- Historical Data and Forecast of Lithuania Plenum Cable Market Revenues & Volume By Speaker Cables for the Period 2022 - 2032F
- Historical Data and Forecast of Lithuania Plenum Cable Market Revenues & Volume By Material for the Period 2022 - 2032F
- Historical Data and Forecast of Lithuania Plenum Cable Market Revenues & Volume By PVC for the Period 2022 - 2032F
- Historical Data and Forecast of Lithuania Plenum Cable Market Revenues & Volume By LSZH for the Period 2022 - 2032F
- Historical Data and Forecast of Lithuania Plenum Cable Market Revenues & Volume By Plenum-Rated for the Period 2022 - 2032F
- Historical Data and Forecast of Lithuania Plenum Cable Market Revenues & Volume By CMP for the Period 2022 - 2032F
- Historical Data and Forecast of Lithuania Plenum Cable Market Revenues & Volume By Application for the Period 2022 - 2032F
- Historical Data and Forecast of Lithuania Plenum Cable Market Revenues & Volume By Data Centers for the Period 2022 - 2032F
- Historical Data and Forecast of Lithuania Plenum Cable Market Revenues & Volume By Commercial Buildings for the Period 2022 - 2032F
- Historical Data and Forecast of Lithuania Plenum Cable Market Revenues & Volume By Enterprise Networking for the Period 2022 - 2032F
- Historical Data and Forecast of Lithuania Plenum Cable Market Revenues & Volume By Security Systems for the Period 2022 - 2032F
- Historical Data and Forecast of Lithuania Plenum Cable Market Revenues & Volume By End User for the Period 2022 - 2032F
- Historical Data and Forecast of Lithuania Plenum Cable Market Revenues & Volume By IT Companies for the Period 2022 - 2032F
- Historical Data and Forecast of Lithuania Plenum Cable Market Revenues & Volume By Telecom Operators for the Period 2022 - 2032F
- Historical Data and Forecast of Lithuania Plenum Cable Market Revenues & Volume By Infrastructure Providers for the Period 2022 - 2032F
- Historical Data and Forecast of Lithuania Plenum Cable Market Revenues & Volume By Audio-Visual Industry for the Period 2022 - 2032F
- Lithuania Plenum Cable Import Export Trade Statistics
- Market Opportunity Assessment By Type
- Market Opportunity Assessment By Material
- Market Opportunity Assessment By Application
- Market Opportunity Assessment By End User
- Lithuania Plenum Cable Top Companies Market Share
- Lithuania Plenum Cable Competitive Benchmarking By Technical and Operational Parameters
- Lithuania Plenum Cable Company Profiles
- Lithuania Plenum Cable Key Strategic Recommendations
Frequently Asked Questions About the Market Study (FAQs):
6Wresearch actively monitors the Lithuania Plenum Cable Market and publishes its comprehensive annual report, highlighting emerging trends, growth drivers, revenue analysis, and forecast outlook. Our insights help businesses to make data-backed strategic decisions with ongoing market dynamics. Our analysts track relevent industries related to the Lithuania Plenum Cable Market, allowing our clients with actionable intelligence and reliable forecasts tailored to emerging regional needs.
Yes, we provide customisation as per your requirements. To learn more, feel free to contact us on sales@6wresearch.com
1 Executive Summary |
2 Introduction |
2.1 Key Highlights of the Report |
2.2 Report Description |
2.3 Market Scope & Segmentation |
2.4 Research Methodology |
2.5 Assumptions |
3 Lithuania Plenum Cable Market Overview |
3.1 Lithuania Country Macro Economic Indicators |
3.2 Lithuania Plenum Cable Market Revenues & Volume, 2022 & 2032F |
3.3 Lithuania Plenum Cable Market - Industry Life Cycle |
3.4 Lithuania Plenum Cable Market - Porter's Five Forces |
3.5 Lithuania Plenum Cable Market Revenues & Volume Share, By Type, 2022 & 2032F |
3.6 Lithuania Plenum Cable Market Revenues & Volume Share, By Material, 2022 & 2032F |
3.7 Lithuania Plenum Cable Market Revenues & Volume Share, By Application, 2022 & 2032F |
3.8 Lithuania Plenum Cable Market Revenues & Volume Share, By End User, 2022 & 2032F |
4 Lithuania Plenum Cable Market Dynamics |
4.1 Impact Analysis |
4.2 Market Drivers |
4.2.1 Increasing demand for high-speed internet and data transmission services, driving the need for efficient and high-quality plenum cables. |
4.2.2 Growing adoption of smart home technologies and Internet of Things (IoT) devices, fueling the demand for reliable and secure network infrastructure. |
4.2.3 Government initiatives and investments in infrastructure development, including smart cities projects, boosting the demand for advanced cabling solutions. |
4.3 Market Restraints |
4.3.1 Price volatility of raw materials used in plenum cable manufacturing, impacting production costs and pricing strategies. |
4.3.2 Stringent regulations and compliance standards related to fire safety and environmental impact, increasing the complexity and cost of manufacturing plenum cables. |
4.3.3 Intense competition from alternative technologies such as wireless communication solutions, challenging market penetration and growth opportunities for plenum cables. |
5 Lithuania Plenum Cable Market Trends |
6 Lithuania Plenum Cable Market, By Types |
6.1 Lithuania Plenum Cable Market, By Type |
6.1.1 Overview and Analysis |
6.1.2 Lithuania Plenum Cable Market Revenues & Volume, By Type, 2022 - 2032F |
6.1.3 Lithuania Plenum Cable Market Revenues & Volume, By Fiber Optic, 2022 - 2032F |
6.1.4 Lithuania Plenum Cable Market Revenues & Volume, By Coaxial, 2022 - 2032F |
6.1.5 Lithuania Plenum Cable Market Revenues & Volume, By Ethernet, 2022 - 2032F |
6.1.6 Lithuania Plenum Cable Market Revenues & Volume, By Speaker Cables, 2022 - 2032F |
6.2 Lithuania Plenum Cable Market, By Material |
6.2.1 Overview and Analysis |
6.2.2 Lithuania Plenum Cable Market Revenues & Volume, By PVC, 2022 - 2032F |
6.2.3 Lithuania Plenum Cable Market Revenues & Volume, By LSZH, 2022 - 2032F |
6.2.4 Lithuania Plenum Cable Market Revenues & Volume, By Plenum-Rated, 2022 - 2032F |
6.2.5 Lithuania Plenum Cable Market Revenues & Volume, By CMP, 2022 - 2032F |
6.3 Lithuania Plenum Cable Market, By Application |
6.3.1 Overview and Analysis |
6.3.2 Lithuania Plenum Cable Market Revenues & Volume, By Data Centers, 2022 - 2032F |
6.3.3 Lithuania Plenum Cable Market Revenues & Volume, By Commercial Buildings, 2022 - 2032F |
6.3.4 Lithuania Plenum Cable Market Revenues & Volume, By Enterprise Networking, 2022 - 2032F |
6.3.5 Lithuania Plenum Cable Market Revenues & Volume, By Security Systems, 2022 - 2032F |
6.4 Lithuania Plenum Cable Market, By End User |
6.4.1 Overview and Analysis |
6.4.2 Lithuania Plenum Cable Market Revenues & Volume, By IT Companies, 2022 - 2032F |
6.4.3 Lithuania Plenum Cable Market Revenues & Volume, By Telecom Operators, 2022 - 2032F |
6.4.4 Lithuania Plenum Cable Market Revenues & Volume, By Infrastructure Providers, 2022 - 2032F |
6.4.5 Lithuania Plenum Cable Market Revenues & Volume, By Audio-Visual Industry, 2022 - 2032F |
7 Lithuania Plenum Cable Market Import-Export Trade Statistics |
7.1 Lithuania Plenum Cable Market Export to Major Countries |
7.2 Lithuania Plenum Cable Market Imports from Major Countries |
8 Lithuania Plenum Cable Market Key Performance Indicators |
8.1 Percentage of market penetration in key industries (e.g., telecommunications, construction, IT). |
8.2 Rate of new product development and innovation in plenum cable technology. |
8.3 Number of partnerships or collaborations with key stakeholders (e.g., government agencies, industry associations) to drive market growth. |
8.4 Customer satisfaction and retention rates for plenum cable products and services. |
8.5 Average installation time and cost efficiency of plenum cable solutions. |
9 Lithuania Plenum Cable Market - Opportunity Assessment |
9.1 Lithuania Plenum Cable Market Opportunity Assessment, By Type, 2022 & 2032F |
9.2 Lithuania Plenum Cable Market Opportunity Assessment, By Material, 2022 & 2032F |
9.3 Lithuania Plenum Cable Market Opportunity Assessment, By Application, 2022 & 2032F |
9.4 Lithuania Plenum Cable Market Opportunity Assessment, By End User, 2022 & 2032F |
10 Lithuania Plenum Cable Market - Competitive Landscape |
10.1 Lithuania Plenum Cable Market Revenue Share, By Companies, 2025 |
10.2 Lithuania Plenum Cable Market Competitive Benchmarking, By Operating and Technical Parameters |
11 Company Profiles |
12 Recommendations |
13 Disclaimer |
Export potential assessment - trade Analytics for 2030
Export potential enables firms to identify high-growth global markets with greater confidence by combining advanced trade intelligence with a structured quantitative methodology. The framework analyzes emerging demand trends and country-level import patterns while integrating macroeconomic and trade datasets such as GDP and population forecasts, bilateral import–export flows, tariff structures, elasticity differentials between developed and developing economies, geographic distance, and import demand projections. Using weighted trade values from 2020–2024 as the base period to project country-to-country export potential for 2030, these inputs are operationalized through calculated drivers such as gravity model parameters, tariff impact factors, and projected GDP per-capita growth. Through an analysis of hidden potentials, demand hotspots, and market conditions that are most favorable to success, this method enables firms to focus on target countries, maximize returns, and global expansion with data, backed by accuracy.
By factoring in the projected importer demand gap that is currently unmet and could be potential opportunity, it identifies the potential for the Exporter (Country) among 190 countries, against the general trade analysis, which identifies the biggest importer or exporter.
To discover high-growth global markets and optimize your business strategy:
Click Here
Pricing
- Single User License$ 1,995
- Department License$ 2,400
- Site License$ 3,120
- Global License$ 3,795

Search
Thought Leadership and Analyst Meet


Our Clients
Latest Reports
- United Kingdom (UK) Outdoor Cooking Equipment Market (2026-2032) | Investment Opportunities, Outlook, Growth, Competition, Trends, Pricing, Demand, Insights, Challenges, Drivers, Size, Restraints, segmentation, Value, Share, Forecast, Companies, Analysis, Revenue, Strategy
- United Arab Emirates (UAE) Outdoor Cooking Equipment Market (2026-2032) | Challenges, Value, Restraints, Growth, Competition, Revenue, Trends, Outlook, Analysis, Drivers, Share, Investment Opportunities, Strategy, Demand, Companies, Forecast, Pricing, segmentation, Size, Insights
- Vietnam Outdoor Cooking Equipment Market (2026-2032) | Demand, Investment Opportunities, Growth, Pricing, Trends, Restraints, Competition, Outlook, Drivers, Strategy, Challenges, Revenue, Analysis, segmentation, Value, Size, Share, Insights, Companies, Forecast
- Venezuela Outdoor Cooking Equipment Market (2026-2032) | Challenges, Revenue, Demand, Value, Pricing, Strategy, Competition, Analysis, Companies, Insights, Growth, Outlook, Forecast, Size, Restraints, segmentation, Drivers, Trends, Investment Opportunities, Share
- Uganda Outdoor Cooking Equipment Market (2026-2032) | Drivers, Pricing, Challenges, Value, Growth, Companies, segmentation, Strategy, Analysis, Demand, Outlook, Size, Competition, Restraints, Revenue, Forecast, Investment Opportunities, Insights, Trends, Share
- Turkey Outdoor Cooking Equipment Market (2026-2032) | Size, Competition, Outlook, Strategy, Forecast, Drivers, Trends, Companies, Revenue, Growth, Analysis, segmentation, Insights, Pricing, Restraints, Demand, Investment Opportunities, Value, Share, Challenges
- Tunisia Outdoor Cooking Equipment Market (2026-2032) | Analysis, Share, Pricing, Trends, Size, Outlook, Revenue, segmentation, Demand, Insights, Investment Opportunities, Restraints, Growth, Forecast, Competition, Drivers, Challenges, Companies, Strategy, Value
- Thailand Outdoor Cooking Equipment Market (2026-2032) | Growth, Revenue, Insights, Companies, Drivers, Strategy, Forecast, Size, Analysis, segmentation, Trends, Challenges, Competition, Share, Investment Opportunities, Demand, Pricing, Value, Restraints, Outlook
- Tanzania Outdoor Cooking Equipment Market (2026-2032) | Share, Drivers, Forecast, Revenue, Growth, Outlook, Analysis, Investment Opportunities, Restraints, segmentation, Demand, Pricing, Size, Insights, Challenges, Competition, Companies, Value, Trends, Strategy
- Tajikistan Outdoor Cooking Equipment Market (2026-2032) | Value, Pricing, Companies, Share, Strategy, Revenue, Investment Opportunities, Demand, Forecast, Size, Competition, Challenges, Growth, Insights, Restraints, segmentation, Analysis, Trends, Drivers, Outlook
Industry Events and Analyst Meet

HIMTEX 2026

India Refining Summit 2026

India EV Show 2026

EV tech India Expo 2026

Auto Tech Asia 2026
Whitepaper
- Middle East & Africa Commercial Security Market Click here to view more.
- Middle East & Africa Fire Safety Systems & Equipment Market Click here to view more.
- GCC Drone Market Click here to view more.
- Middle East Lighting Fixture Market Click here to view more.
- GCC Physical & Perimeter Security Market Click here to view more.
6WResearch In News
- Doha a strategic location for EV manufacturing hub: IPA Qatar
- Demand for luxury TVs surging in the GCC, says Samsung
- Empowering Growth: The Thriving Journey of Bangladesh’s Cable Industry
- Demand for luxury TVs surging in the GCC, says Samsung
- Video call with a traditional healer? Once unthinkable, it’s now common in South Africa
- Intelligent Buildings To Smooth GCC’s Path To Net Zero