Lithuania Polyvinyl Butyral Market (2026-2032) | Industry, Growth, Revenue, Value, Segmentation, Size, Trends, Companies, Share, Outlook, Forecast & Analysis
Market Forecast By Application (Films & sheets, Paints & coatings, Adhesives, Others) And Competitive Landscape
| Product Code: ETC5309419 | Publication Date: Nov 2023 | Updated Date: Apr 2026 | Product Type: Market Research Report | |
| Publisher: 6Wresearch | Author: Ravi Bhandari | No. of Pages: 60 | No. of Figures: 30 | No. of Tables: 5 |
Lithuania Polyvinyl Butyral Market Size (2020-2030)
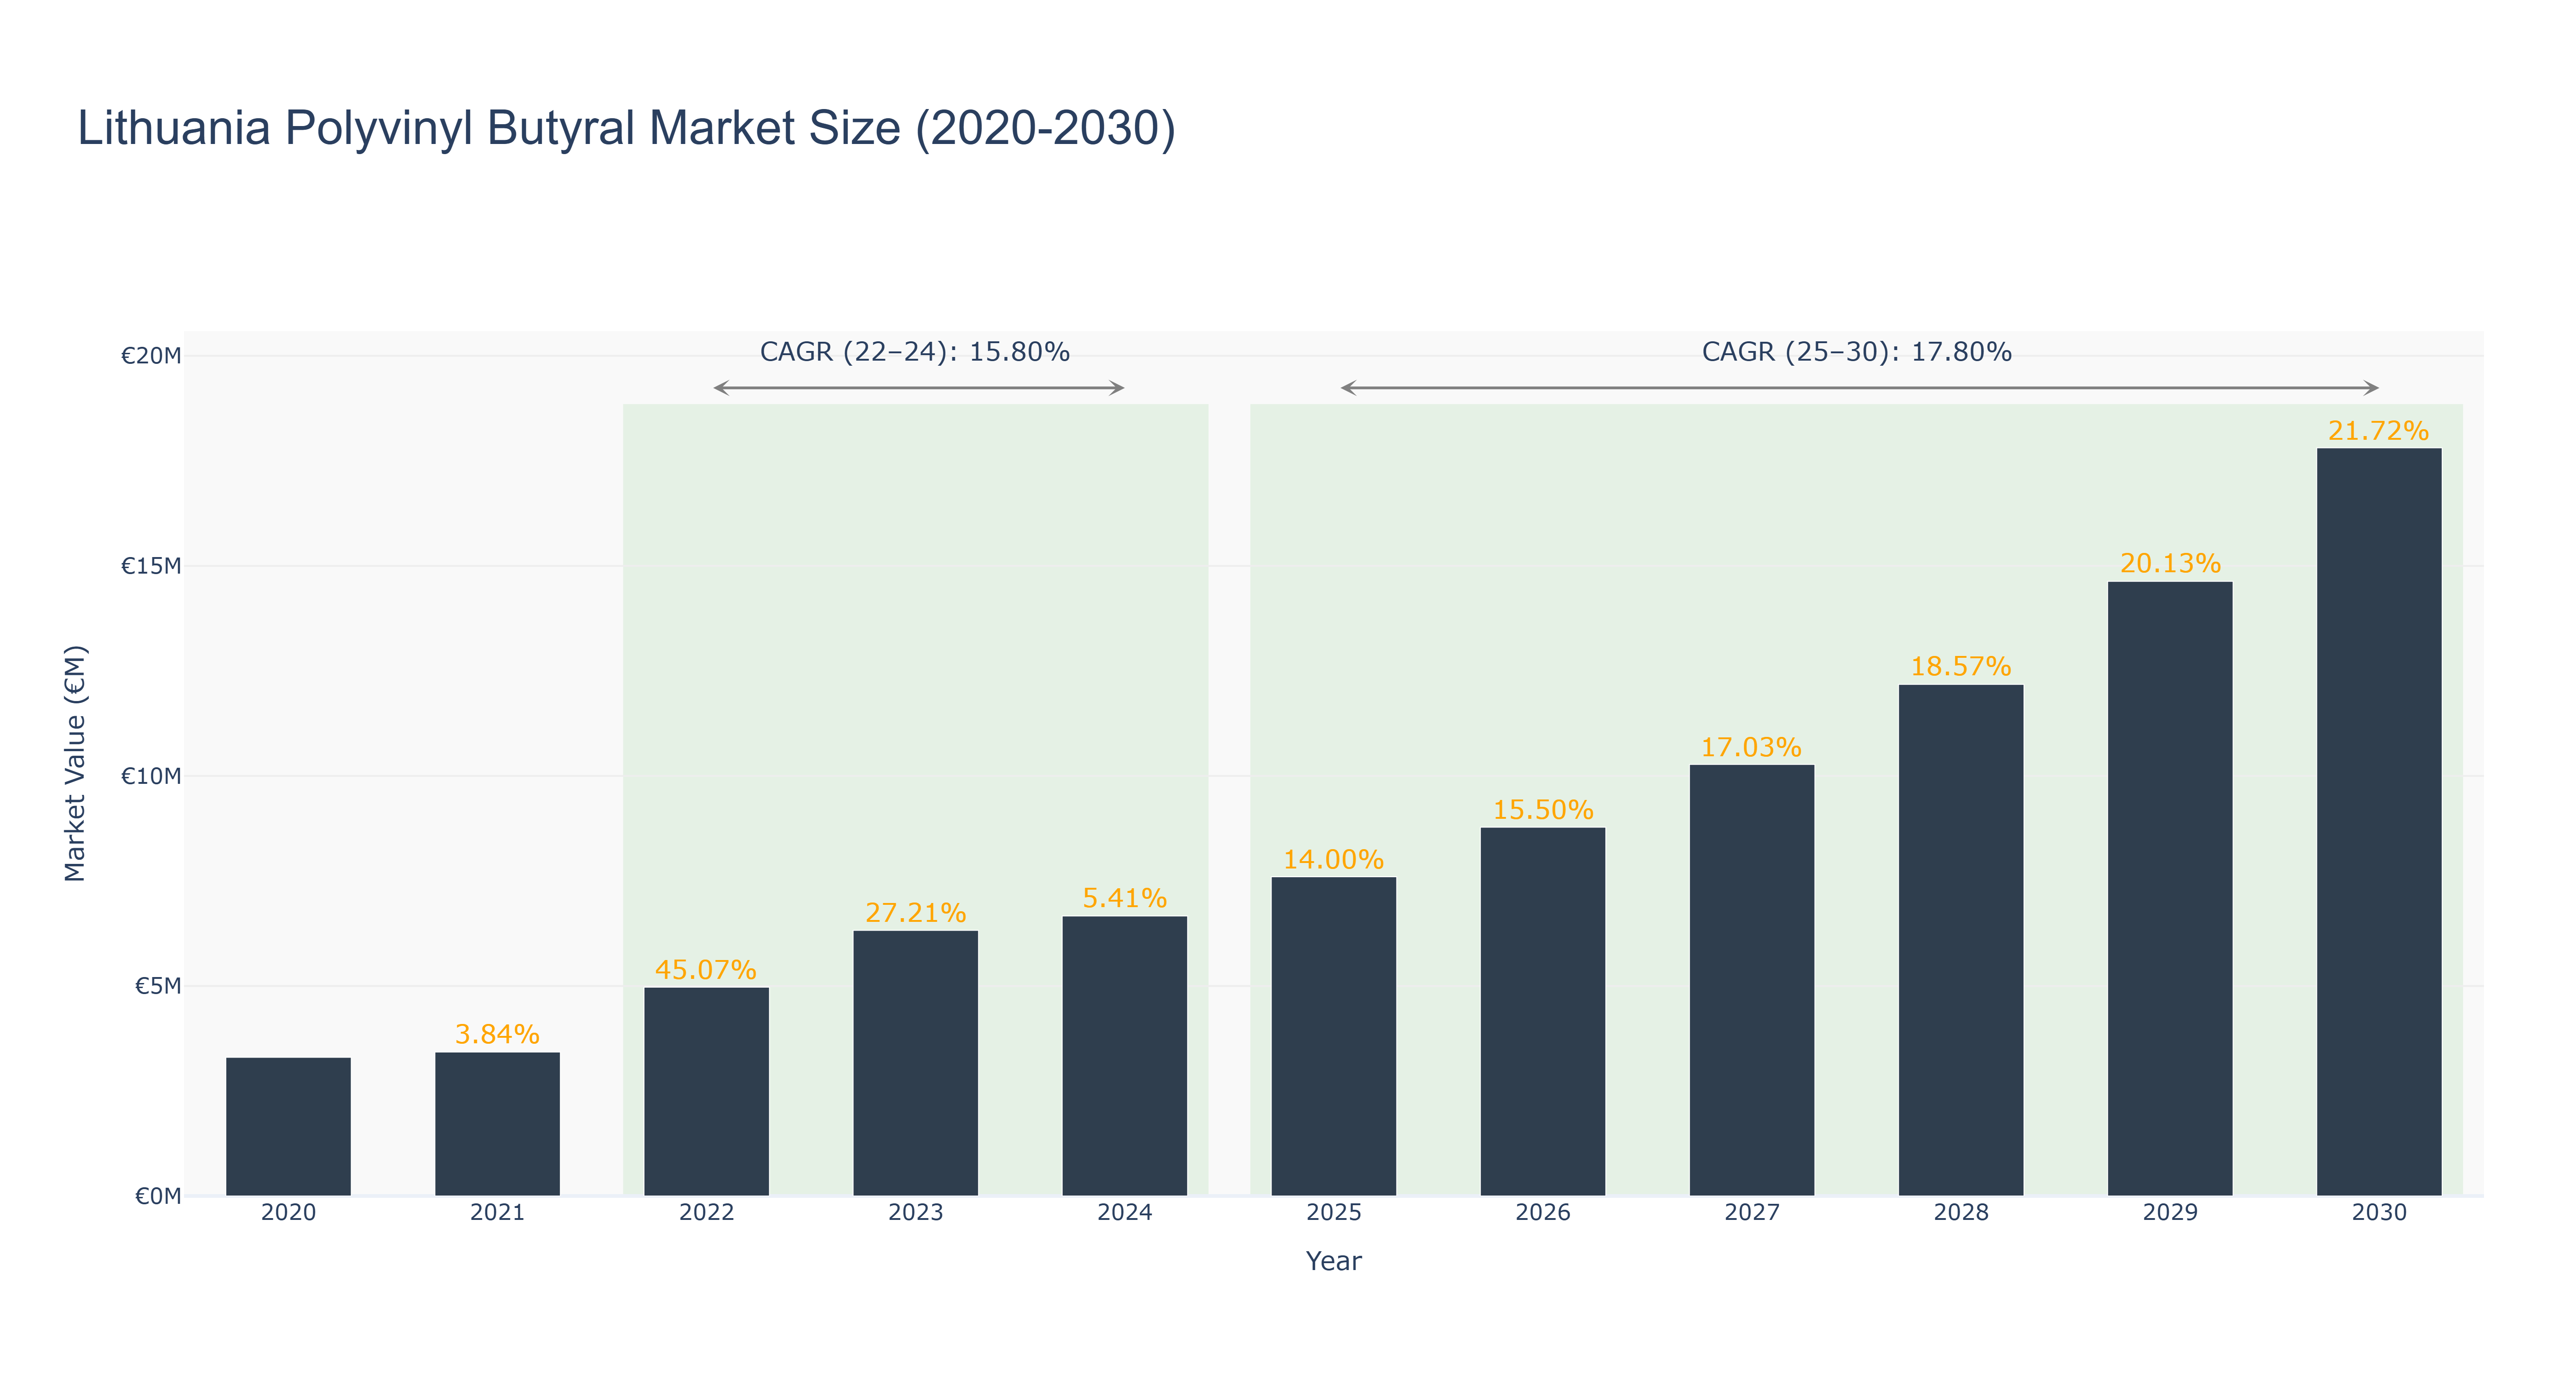
The Lithuania Polyvinyl Butyral Market has shown a steady growth trajectory over the years. The peak market size of €17.81 million is forecasted for 2030, with a notable increase in market size from €4.97 million in 2022 to €6.67 million in 2024. The market is expected to continue its upward trend with a CAGR of 17.79% from 2025 to 2030. The market experienced a spike in growth from 2022 to 2024 due to increased demand for polyvinyl butyral in various industries, while the period from 2025 to 2030 is projected to benefit from advancements in technology and a growing focus on sustainability. Recent developments in Lithuania's construction sector, where polyvinyl butyral is extensively used in laminated glass production, are set to further drive market growth in the coming years.
Lithuania Polyvinyl Butyral Market: Production & Trade Performance (2019-2025)
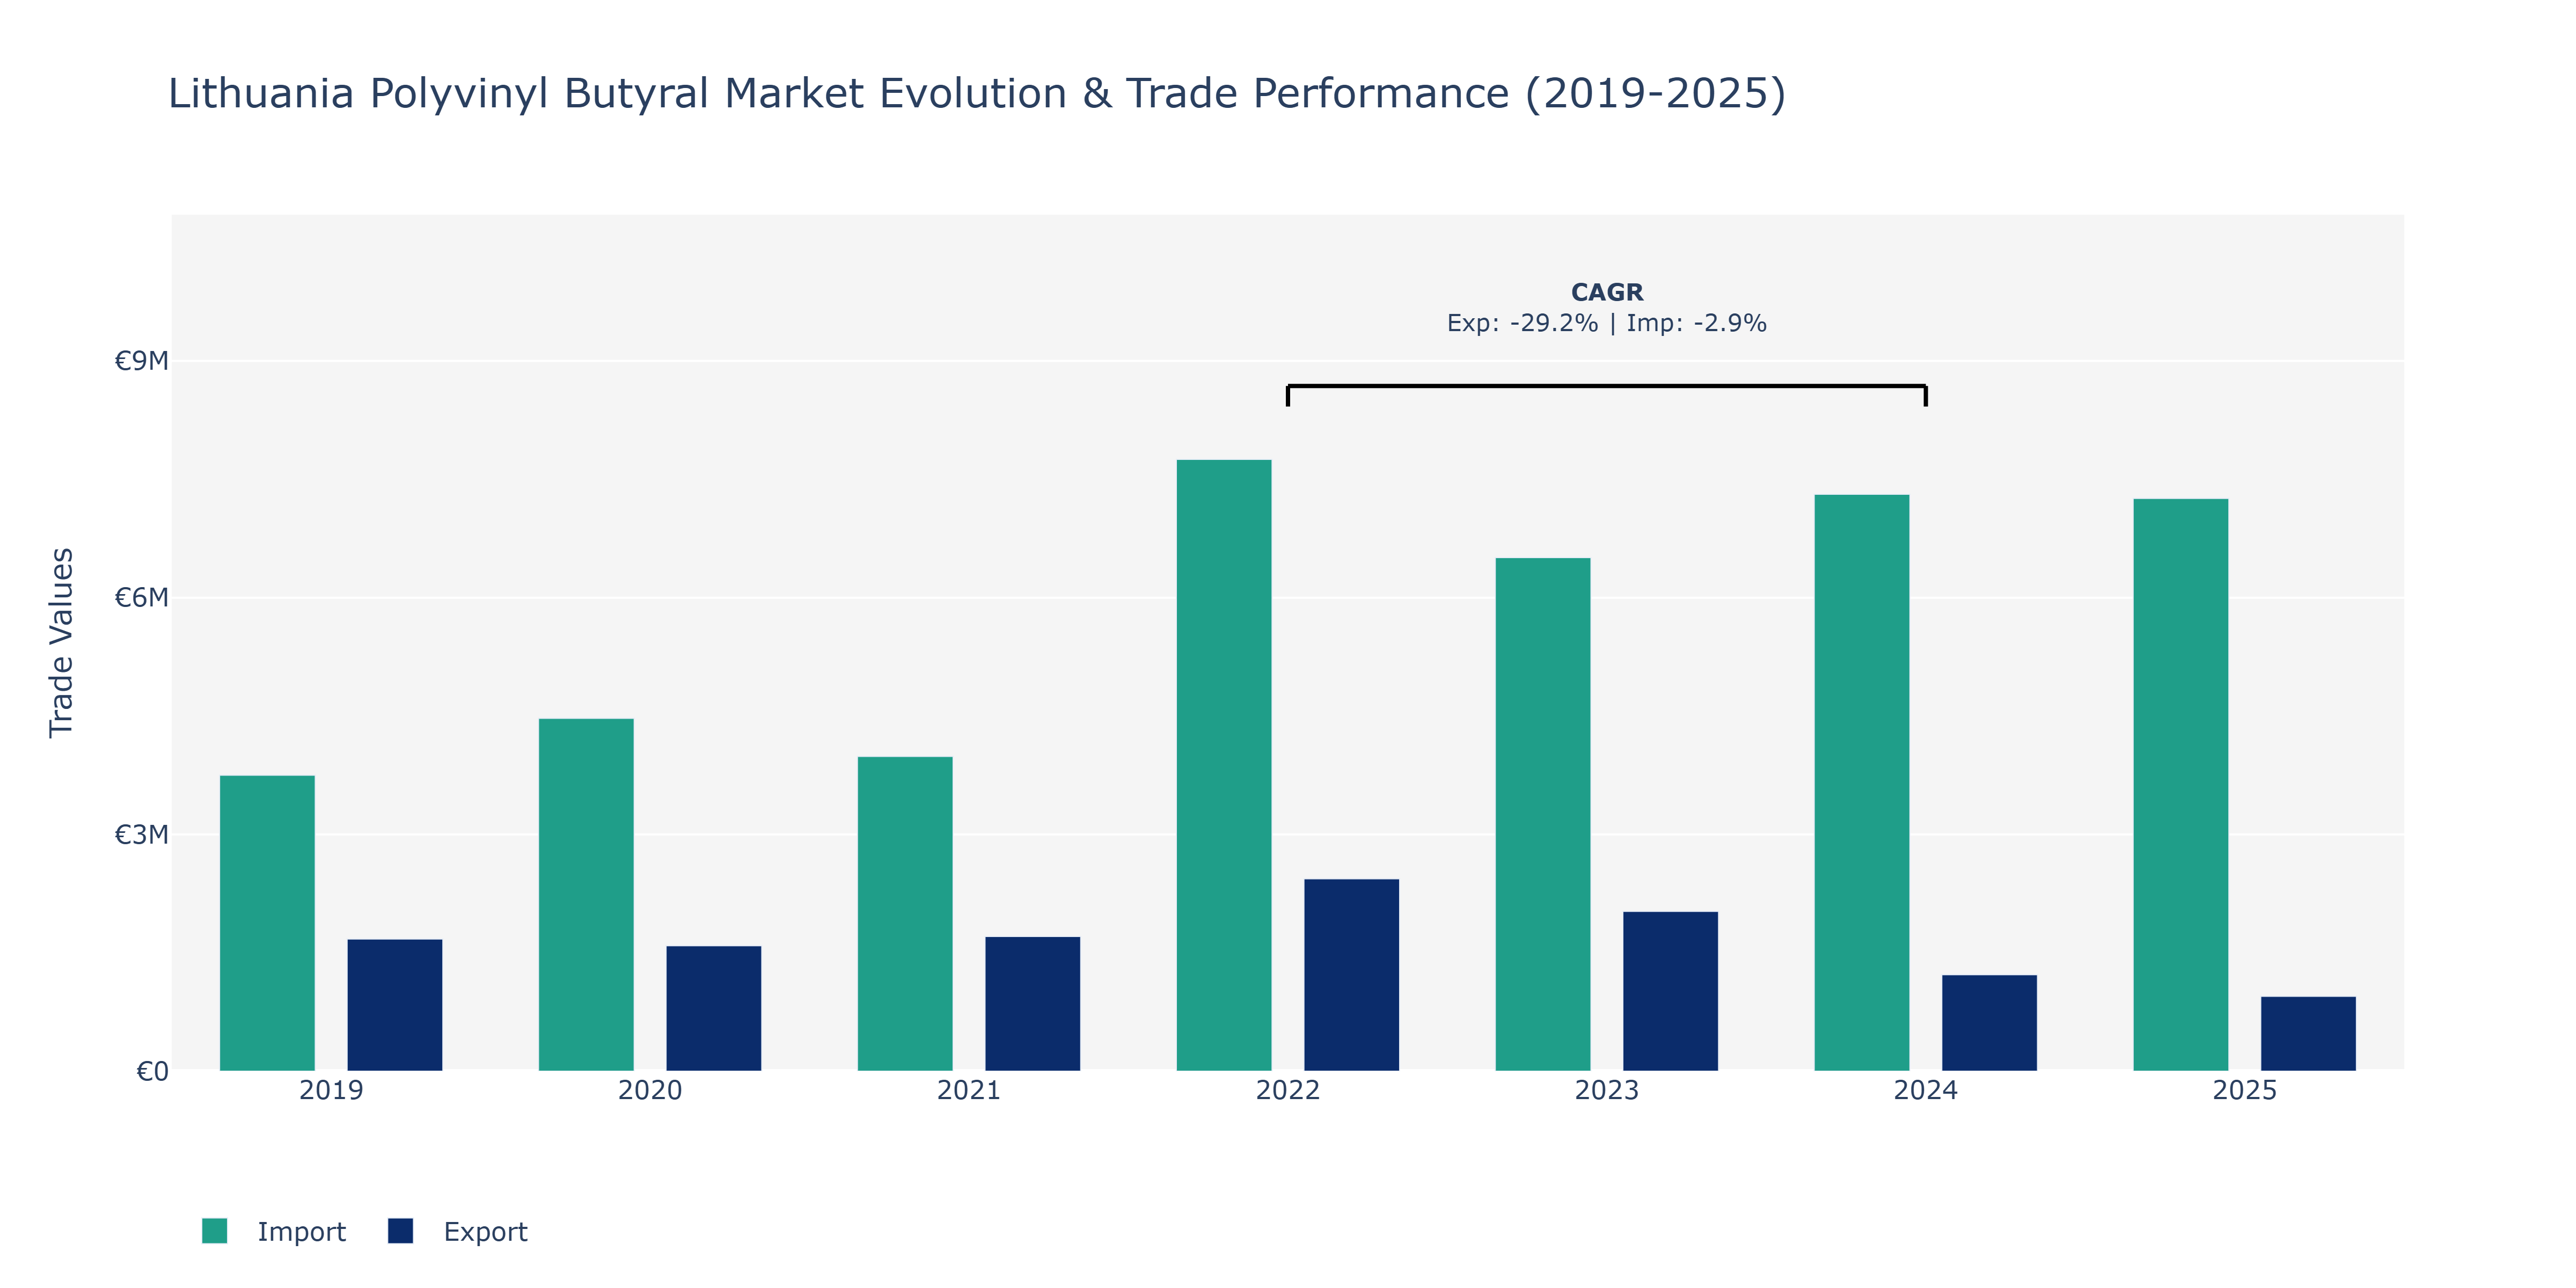
The Lithuania Polyvinyl Butyral Market witnessed fluctuating trends in both Exports and Imports over the years. Starting in 2019, Imports significantly outweighed Exports, with Imports at €3.75 million and Exports at €1.67 million. In subsequent years, both Exports and Imports experienced varied movements. Exports showed a general decline from 2019 to 2025, hitting a low point of €949.06 thousand in 2025. Conversely, Imports displayed a more erratic pattern, peaking in 2022 at €7.75 million and then decreasing gradually. The surge in 2022 could be attributed to increased demand for Polyvinyl Butyral products in sectors like automotive and construction, aligning with Lithuania's economic growth during that time. The subsequent declines could be linked to market saturation, global economic conditions, or shifts in supply chain dynamics impacting the Polyvinyl Butyral industry.
Key Highlights of the Report:
- Lithuania Polyvinyl Butyral Market Outlook
- Market Size of Lithuania Polyvinyl Butyral Market, 2025
- Forecast of Lithuania Polyvinyl Butyral Market, 2032
- Historical Data and Forecast of Lithuania Polyvinyl Butyral Revenues & Volume for the Period 2022 - 2032F
- Lithuania Polyvinyl Butyral Market Trend Evolution
- Lithuania Polyvinyl Butyral Market Drivers and Challenges
- Lithuania Polyvinyl Butyral Price Trends
- Lithuania Polyvinyl Butyral Porter`s Five Forces
- Lithuania Polyvinyl Butyral Industry Life Cycle
- Historical Data and Forecast of Lithuania Polyvinyl Butyral Market Revenues & Volume By Application for the Period 2022 - 2032F
- Historical Data and Forecast of Lithuania Polyvinyl Butyral Market Revenues & Volume By Films & sheets for the Period 2022 - 2032F
- Historical Data and Forecast of Lithuania Polyvinyl Butyral Market Revenues & Volume By Paints & coatings for the Period 2022 - 2032F
- Historical Data and Forecast of Lithuania Polyvinyl Butyral Market Revenues & Volume By Adhesives for the Period 2022 - 2032F
- Historical Data and Forecast of Lithuania Polyvinyl Butyral Market Revenues & Volume By Others for the Period 2022 - 2032F
- Lithuania Polyvinyl Butyral Import Export Trade Statistics
- Market Opportunity Assessment By Application
- Lithuania Polyvinyl Butyral Top Companies Market Share
- Lithuania Polyvinyl Butyral Competitive Benchmarking By Technical and Operational Parameters
- Lithuania Polyvinyl Butyral Company Profiles
- Lithuania Polyvinyl Butyral Key Strategic Recommendations
Frequently Asked Questions About the Market Study (FAQs):
6Wresearch actively monitors the Lithuania Polyvinyl Butyral Market and publishes its comprehensive annual report, highlighting emerging trends, growth drivers, revenue analysis, and forecast outlook. Our insights help businesses to make data-backed strategic decisions with ongoing market dynamics. Our analysts track relevent industries related to the Lithuania Polyvinyl Butyral Market, allowing our clients with actionable intelligence and reliable forecasts tailored to emerging regional needs.
Yes, we provide customisation as per your requirements. To learn more, feel free to contact us on sales@6wresearch.com
1 Executive Summary |
2 Introduction |
2.1 Key Highlights of the Report |
2.2 Report Description |
2.3 Market Scope & Segmentation |
2.4 Research Methodology |
2.5 Assumptions |
3 Lithuania Polyvinyl Butyral Market Overview |
3.1 Lithuania Country Macro Economic Indicators |
3.2 Lithuania Polyvinyl Butyral Market Revenues & Volume, 2022 & 2032F |
3.3 Lithuania Polyvinyl Butyral Market - Industry Life Cycle |
3.4 Lithuania Polyvinyl Butyral Market - Porter's Five Forces |
3.5 Lithuania Polyvinyl Butyral Market Revenues & Volume Share, By Application, 2022 & 2032F |
4 Lithuania Polyvinyl Butyral Market Dynamics |
4.1 Impact Analysis |
4.2 Market Drivers |
4.2.1 Growing demand for safety glass in automotive and construction industries |
4.2.2 Increasing adoption of polyvinyl butyral as a raw material in the manufacturing of laminated glass |
4.2.3 Technological advancements leading to improved product quality and performance |
4.3 Market Restraints |
4.3.1 Fluctuating prices of raw materials impacting production costs |
4.3.2 Stringent regulations regarding the use of chemicals in manufacturing processes |
4.3.3 Competition from alternative materials like ionoplast polymers |
5 Lithuania Polyvinyl Butyral Market Trends |
6 Lithuania Polyvinyl Butyral Market Segmentations |
6.1 Lithuania Polyvinyl Butyral Market, By Application |
6.1.1 Overview and Analysis |
6.1.2 Lithuania Polyvinyl Butyral Market Revenues & Volume, By Films & sheets, 2022 - 2032F |
6.1.3 Lithuania Polyvinyl Butyral Market Revenues & Volume, By Paints & coatings, 2022 - 2032F |
6.1.4 Lithuania Polyvinyl Butyral Market Revenues & Volume, By Adhesives, 2022 - 2032F |
6.1.5 Lithuania Polyvinyl Butyral Market Revenues & Volume, By Others, 2022 - 2032F |
7 Lithuania Polyvinyl Butyral Market Import-Export Trade Statistics |
7.1 Lithuania Polyvinyl Butyral Market Export to Major Countries |
7.2 Lithuania Polyvinyl Butyral Market Imports from Major Countries |
8 Lithuania Polyvinyl Butyral Market Key Performance Indicators |
8.1 Average selling price of polyvinyl butyral products |
8.2 Rate of adoption of polyvinyl butyral in new applications |
8.3 Innovation pipeline and number of patents filed for polyvinyl butyral technology |
9 Lithuania Polyvinyl Butyral Market - Opportunity Assessment |
9.1 Lithuania Polyvinyl Butyral Market Opportunity Assessment, By Application, 2022 & 2032F |
10 Lithuania Polyvinyl Butyral Market - Competitive Landscape |
10.1 Lithuania Polyvinyl Butyral Market Revenue Share, By Companies, 2025 |
10.2 Lithuania Polyvinyl Butyral Market Competitive Benchmarking, By Operating and Technical Parameters |
11 Company Profiles |
12 Recommendations | 13 Disclaimer |
Export potential assessment - trade Analytics for 2030
Export potential enables firms to identify high-growth global markets with greater confidence by combining advanced trade intelligence with a structured quantitative methodology. The framework analyzes emerging demand trends and country-level import patterns while integrating macroeconomic and trade datasets such as GDP and population forecasts, bilateral import–export flows, tariff structures, elasticity differentials between developed and developing economies, geographic distance, and import demand projections. Using weighted trade values from 2020–2024 as the base period to project country-to-country export potential for 2030, these inputs are operationalized through calculated drivers such as gravity model parameters, tariff impact factors, and projected GDP per-capita growth. Through an analysis of hidden potentials, demand hotspots, and market conditions that are most favorable to success, this method enables firms to focus on target countries, maximize returns, and global expansion with data, backed by accuracy.
By factoring in the projected importer demand gap that is currently unmet and could be potential opportunity, it identifies the potential for the Exporter (Country) among 190 countries, against the general trade analysis, which identifies the biggest importer or exporter.
To discover high-growth global markets and optimize your business strategy:
Click Here
Pricing
- Single User License$ 1,995
- Department License$ 2,400
- Site License$ 3,120
- Global License$ 3,795

Search
Thought Leadership and Analyst Meet


Our Clients
Latest Reports
- United Kingdom (UK) Outdoor Cooking Equipment Market (2026-2032) | Investment Opportunities, Outlook, Growth, Competition, Trends, Pricing, Demand, Insights, Challenges, Drivers, Size, Restraints, segmentation, Value, Share, Forecast, Companies, Analysis, Revenue, Strategy
- United Arab Emirates (UAE) Outdoor Cooking Equipment Market (2026-2032) | Challenges, Value, Restraints, Growth, Competition, Revenue, Trends, Outlook, Analysis, Drivers, Share, Investment Opportunities, Strategy, Demand, Companies, Forecast, Pricing, segmentation, Size, Insights
- Vietnam Outdoor Cooking Equipment Market (2026-2032) | Demand, Investment Opportunities, Growth, Pricing, Trends, Restraints, Competition, Outlook, Drivers, Strategy, Challenges, Revenue, Analysis, segmentation, Value, Size, Share, Insights, Companies, Forecast
- Venezuela Outdoor Cooking Equipment Market (2026-2032) | Challenges, Revenue, Demand, Value, Pricing, Strategy, Competition, Analysis, Companies, Insights, Growth, Outlook, Forecast, Size, Restraints, segmentation, Drivers, Trends, Investment Opportunities, Share
- Uganda Outdoor Cooking Equipment Market (2026-2032) | Drivers, Pricing, Challenges, Value, Growth, Companies, segmentation, Strategy, Analysis, Demand, Outlook, Size, Competition, Restraints, Revenue, Forecast, Investment Opportunities, Insights, Trends, Share
- Turkey Outdoor Cooking Equipment Market (2026-2032) | Size, Competition, Outlook, Strategy, Forecast, Drivers, Trends, Companies, Revenue, Growth, Analysis, segmentation, Insights, Pricing, Restraints, Demand, Investment Opportunities, Value, Share, Challenges
- Tunisia Outdoor Cooking Equipment Market (2026-2032) | Analysis, Share, Pricing, Trends, Size, Outlook, Revenue, segmentation, Demand, Insights, Investment Opportunities, Restraints, Growth, Forecast, Competition, Drivers, Challenges, Companies, Strategy, Value
- Thailand Outdoor Cooking Equipment Market (2026-2032) | Growth, Revenue, Insights, Companies, Drivers, Strategy, Forecast, Size, Analysis, segmentation, Trends, Challenges, Competition, Share, Investment Opportunities, Demand, Pricing, Value, Restraints, Outlook
- Tanzania Outdoor Cooking Equipment Market (2026-2032) | Share, Drivers, Forecast, Revenue, Growth, Outlook, Analysis, Investment Opportunities, Restraints, segmentation, Demand, Pricing, Size, Insights, Challenges, Competition, Companies, Value, Trends, Strategy
- Tajikistan Outdoor Cooking Equipment Market (2026-2032) | Value, Pricing, Companies, Share, Strategy, Revenue, Investment Opportunities, Demand, Forecast, Size, Competition, Challenges, Growth, Insights, Restraints, segmentation, Analysis, Trends, Drivers, Outlook
Industry Events and Analyst Meet

HIMTEX 2026

India Refining Summit 2026

India EV Show 2026

EV tech India Expo 2026

Auto Tech Asia 2026
Whitepaper
- Middle East & Africa Commercial Security Market Click here to view more.
- Middle East & Africa Fire Safety Systems & Equipment Market Click here to view more.
- GCC Drone Market Click here to view more.
- Middle East Lighting Fixture Market Click here to view more.
- GCC Physical & Perimeter Security Market Click here to view more.
6WResearch In News
- Doha a strategic location for EV manufacturing hub: IPA Qatar
- Demand for luxury TVs surging in the GCC, says Samsung
- Empowering Growth: The Thriving Journey of Bangladesh’s Cable Industry
- Demand for luxury TVs surging in the GCC, says Samsung
- Video call with a traditional healer? Once unthinkable, it’s now common in South Africa
- Intelligent Buildings To Smooth GCC’s Path To Net Zero