Lithuania Prisms Market (2026-2032) | Share, Segmentation, Value, Outlook, Forecast, Growth, Trends, Size, Companies, Analysis, Industry & Revenue
Market Forecast By Product (Dispersion Prisms, Deviation Prisms, Rotation Prisms, Displacement Prisms), By Application (Microscope, Lens, Telescope, Others) And Competitive Landscape
| Product Code: ETC4957368 | Publication Date: Nov 2023 | Updated Date: Apr 2026 | Product Type: Market Research Report | |
| Publisher: 6Wresearch | Author: Shubham Padhi | No. of Pages: 60 | No. of Figures: 30 | No. of Tables: 5 |
Lithuania Prisms Market Size (2020-2030)
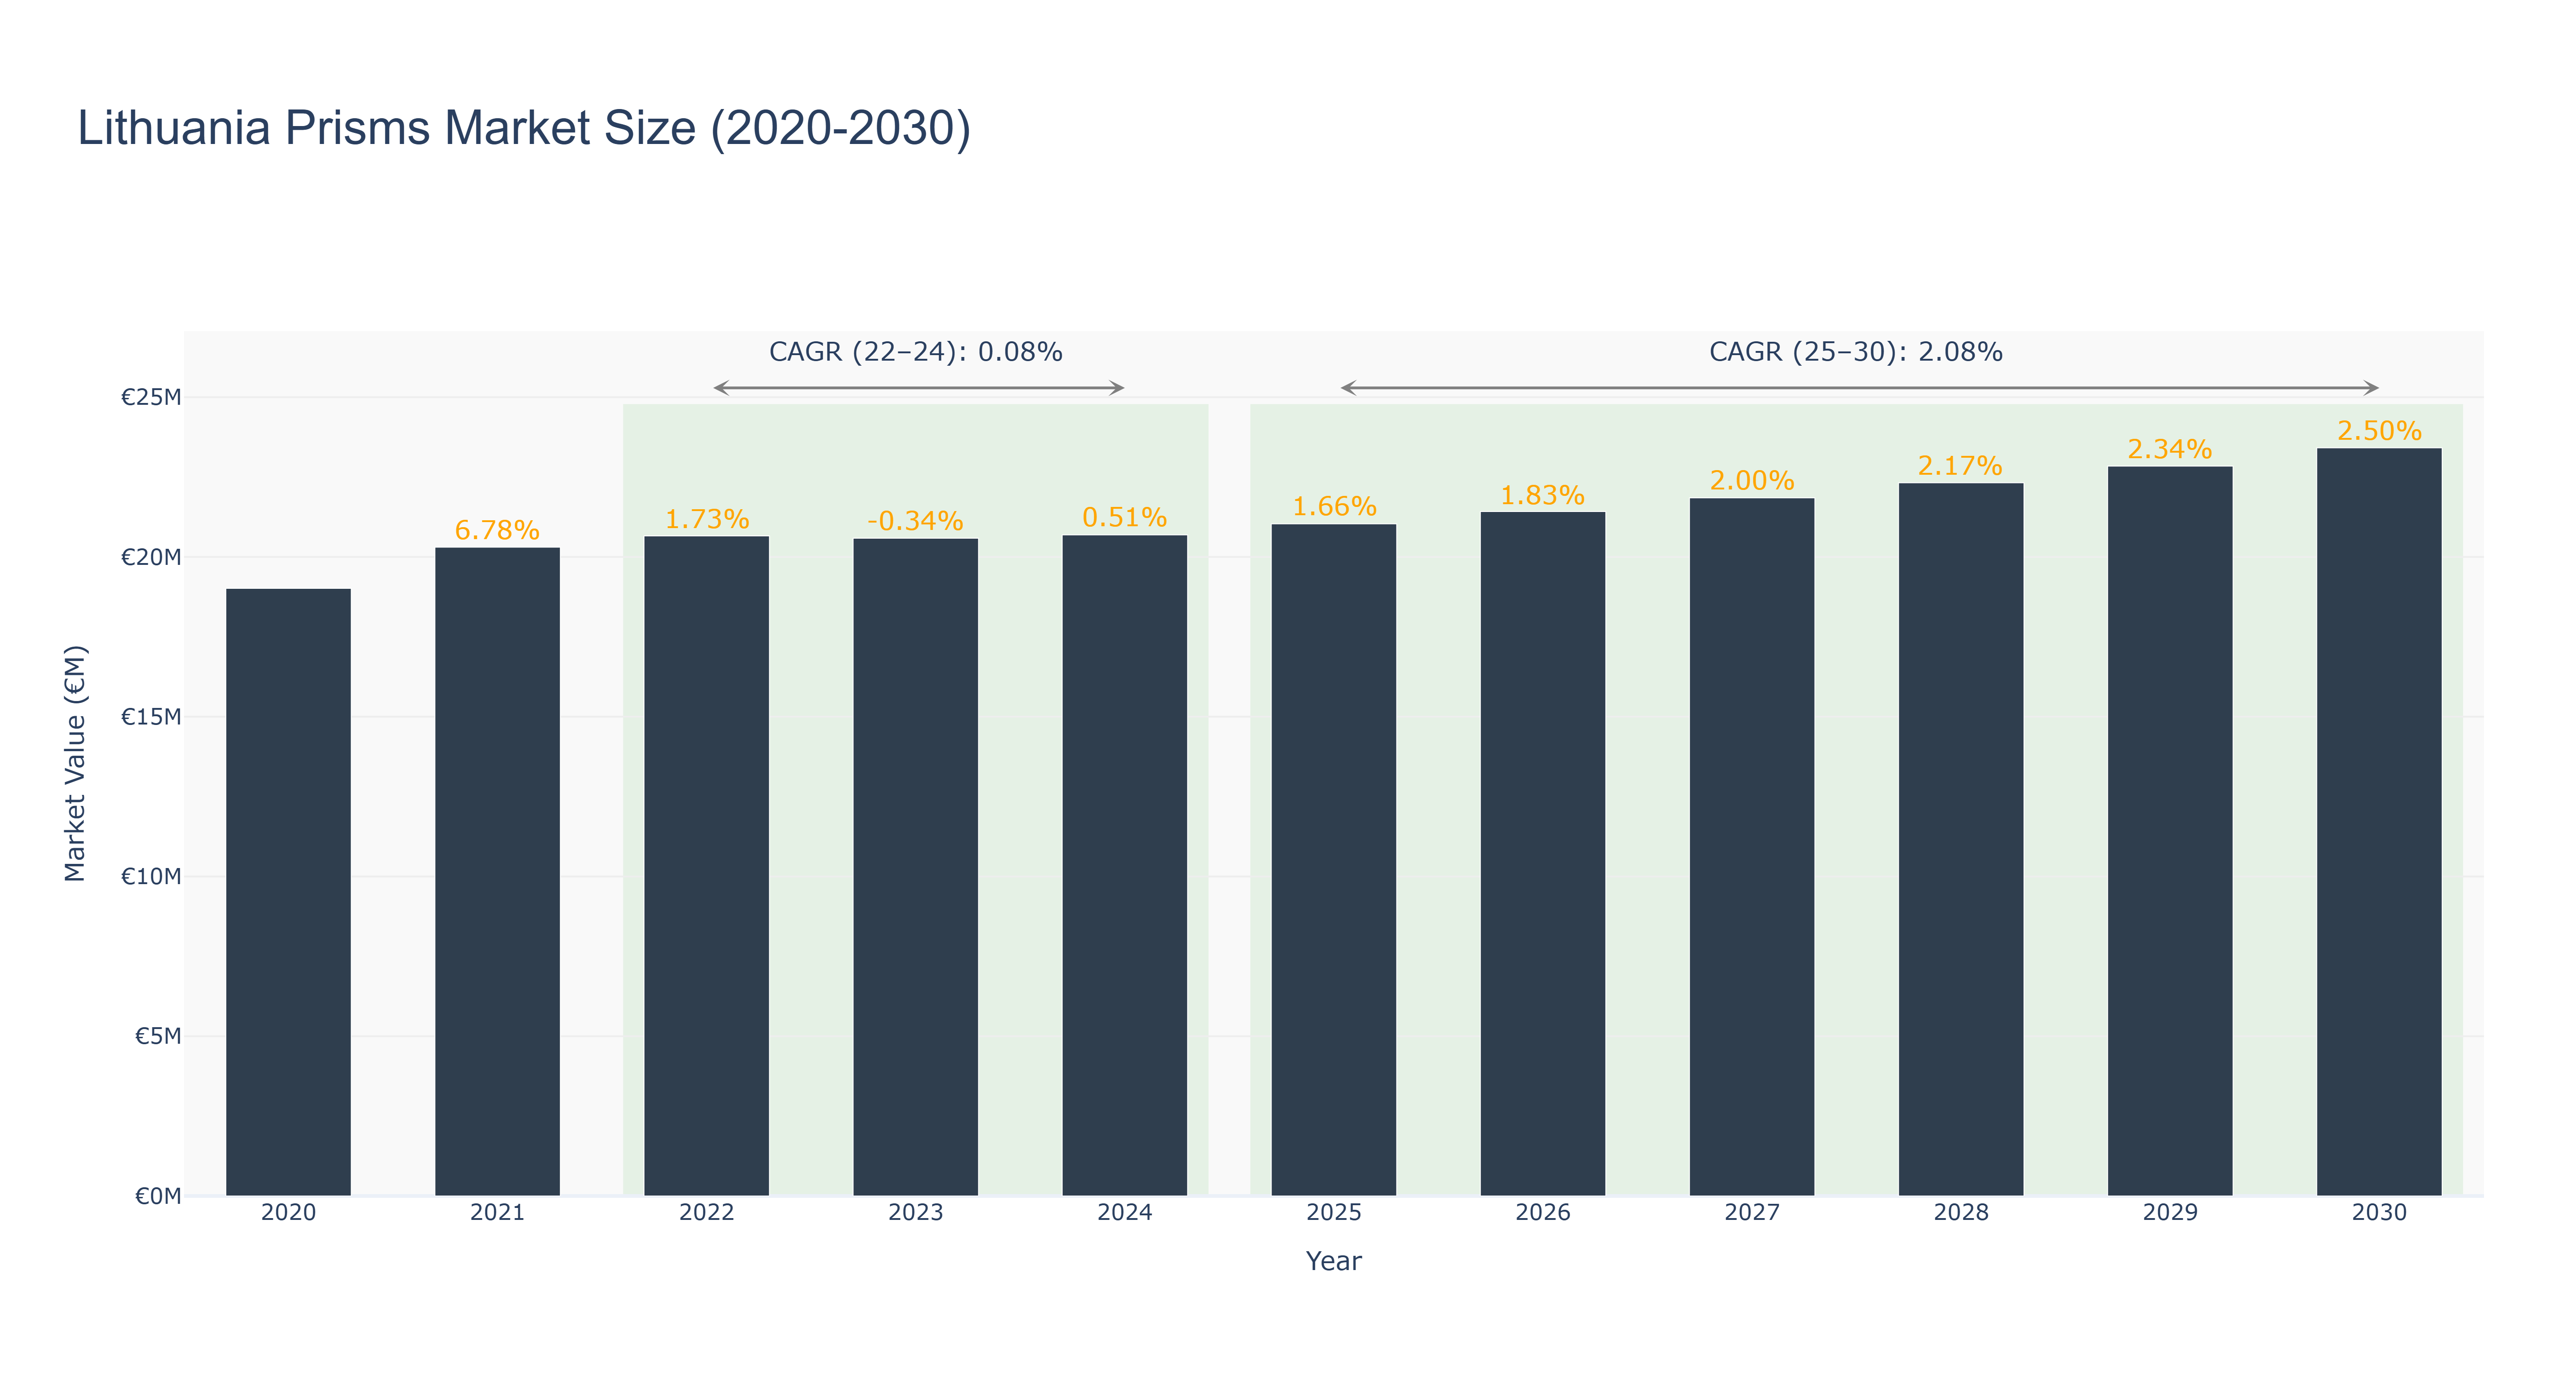
Lithuania Prisms Market has shown a steady growth trajectory, with the peak market size of €23.42 million expected in 2030. The market size increased from €19.02 million in 2020 to €20.69 million in 2024, with a slight decline in 2023 due to a temporary market adjustment. The forecasted growth from 2025 to 2030 is promising, with a CAGR of 2.08% during this period. The market's growth can be attributed to factors like increasing demand for advanced prism technologies in various industries and the country's focus on technological innovation. Looking ahead, Lithuania is set to launch a national initiative to promote the adoption of prism technologies in the manufacturing sector, further driving market growth. This initiative aims to enhance production efficiency and competitiveness, positioning Lithuania as a key player in the prism market on a global scale.
Lithuania Prisms Market: Production & Trade Performance (2019-2025)
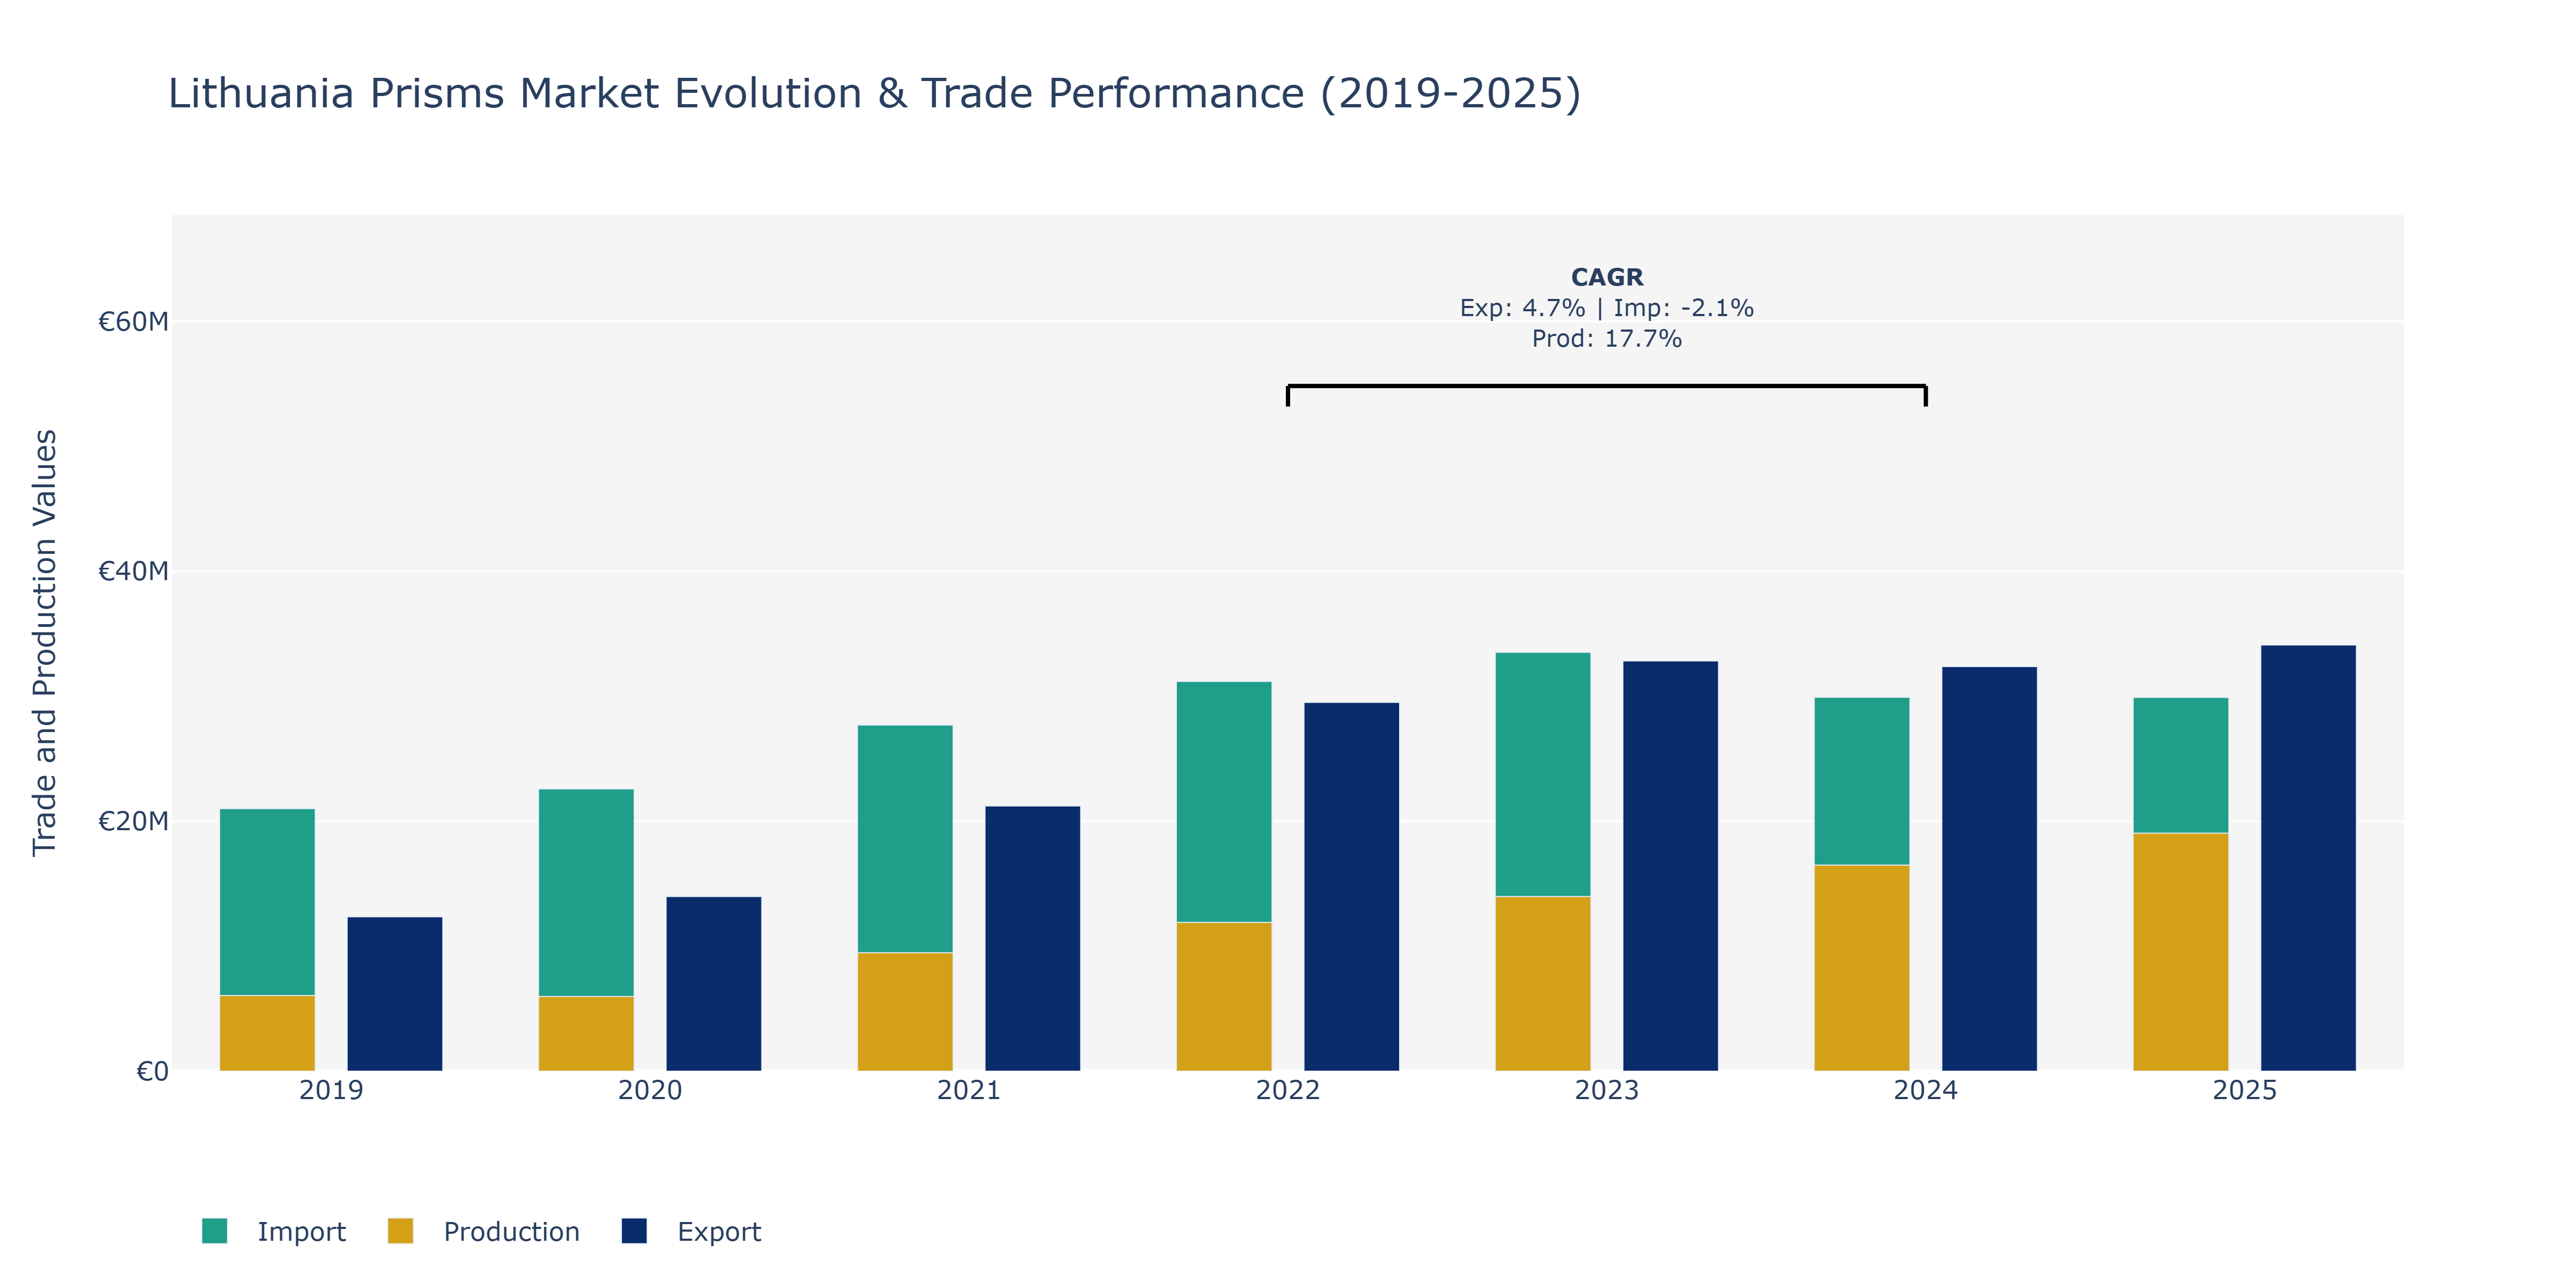
In the Lithuania Prisms Market, exports showcased a substantial growth trajectory from 2019 to 2025, increasing steadily each year and peaking in 2025 at approximately €34.11 million. Conversely, imports remained relatively stable between 2019 and 2020, experienced a slight dip in 2021, and then maintained a consistent level through 2025, hovering around €29.91 million. Production, on the other hand, demonstrated a notable upward trend, reaching its peak in 2025 at around €19.05 million. The surge in production can be attributed to advancements in manufacturing technologies and processes, leading to increased efficiency and capacity. The fluctuations in export and Import value were influenced by global demand shifts and trade policies impacting the prism market. The consistent growth in exports reflects Lithuania's competitive edge in producing prisms to meet international market demands, while the stable imports indicate a balanced trade landscape in the prism industry within the region.
Key Highlights of the Report:
- Lithuania Prisms Market Outlook
- Market Size of Lithuania Prisms Market, 2025
- Forecast of Lithuania Prisms Market, 2032
- Historical Data and Forecast of Lithuania Prisms Revenues & Volume for the Period 2022 - 2032F
- Lithuania Prisms Market Trend Evolution
- Lithuania Prisms Market Drivers and Challenges
- Lithuania Prisms Price Trends
- Lithuania Prisms Porter`s Five Forces
- Lithuania Prisms Industry Life Cycle
- Historical Data and Forecast of Lithuania Prisms Market Revenues & Volume By Product for the Period 2022 - 2032F
- Historical Data and Forecast of Lithuania Prisms Market Revenues & Volume By Dispersion Prisms for the Period 2022 - 2032F
- Historical Data and Forecast of Lithuania Prisms Market Revenues & Volume By Deviation Prisms for the Period 2022 - 2032F
- Historical Data and Forecast of Lithuania Prisms Market Revenues & Volume By Rotation Prisms for the Period 2022 - 2032F
- Historical Data and Forecast of Lithuania Prisms Market Revenues & Volume By Displacement Prisms for the Period 2022 - 2032F
- Historical Data and Forecast of Lithuania Prisms Market Revenues & Volume By Application for the Period 2022 - 2032F
- Historical Data and Forecast of Lithuania Prisms Market Revenues & Volume By Microscope for the Period 2022 - 2032F
- Historical Data and Forecast of Lithuania Prisms Market Revenues & Volume By Lens for the Period 2022 - 2032F
- Historical Data and Forecast of Lithuania Prisms Market Revenues & Volume By Telescope for the Period 2022 - 2032F
- Historical Data and Forecast of Lithuania Prisms Market Revenues & Volume By Others for the Period 2022 - 2032F
- Lithuania Prisms Import Export Trade Statistics
- Market Opportunity Assessment By Product
- Market Opportunity Assessment By Application
- Lithuania Prisms Top Companies Market Share
- Lithuania Prisms Competitive Benchmarking By Technical and Operational Parameters
- Lithuania Prisms Company Profiles
- Lithuania Prisms Key Strategic Recommendations
Frequently Asked Questions About the Market Study (FAQs):
6Wresearch actively monitors the Lithuania Prisms Market and publishes its comprehensive annual report, highlighting emerging trends, growth drivers, revenue analysis, and forecast outlook. Our insights help businesses to make data-backed strategic decisions with ongoing market dynamics. Our analysts track relevent industries related to the Lithuania Prisms Market, allowing our clients with actionable intelligence and reliable forecasts tailored to emerging regional needs.
Yes, we provide customisation as per your requirements. To learn more, feel free to contact us on sales@6wresearch.com
1 Executive Summary |
2 Introduction |
2.1 Key Highlights of the Report |
2.2 Report Description |
2.3 Market Scope & Segmentation |
2.4 Research Methodology |
2.5 Assumptions |
3 Lithuania Prisms Market Overview |
3.1 Lithuania Country Macro Economic Indicators |
3.2 Lithuania Prisms Market Revenues & Volume, 2022 & 2032F |
3.3 Lithuania Prisms Market - Industry Life Cycle |
3.4 Lithuania Prisms Market - Porter's Five Forces |
3.5 Lithuania Prisms Market Revenues & Volume Share, By Product, 2022 & 2032F |
3.6 Lithuania Prisms Market Revenues & Volume Share, By Application, 2022 & 2032F |
4 Lithuania Prisms Market Dynamics |
4.1 Impact Analysis |
4.2 Market Drivers |
4.2.1 Increasing demand for precision optical components in various industries |
4.2.2 Growth in the usage of prisms in advanced optical systems and applications |
4.2.3 Technological advancements leading to the development of high-quality prisms |
4.3 Market Restraints |
4.3.1 Intense competition from established global players in the prism market |
4.3.2 Fluctuations in raw material prices affecting production costs |
4.3.3 Regulatory challenges related to the manufacturing and sale of optical components |
5 Lithuania Prisms Market Trends |
6 Lithuania Prisms Market Segmentations |
6.1 Lithuania Prisms Market, By Product |
6.1.1 Overview and Analysis |
6.1.2 Lithuania Prisms Market Revenues & Volume, By Dispersion Prisms, 2022 - 2032F |
6.1.3 Lithuania Prisms Market Revenues & Volume, By Deviation Prisms, 2022 - 2032F |
6.1.4 Lithuania Prisms Market Revenues & Volume, By Rotation Prisms, 2022 - 2032F |
6.1.5 Lithuania Prisms Market Revenues & Volume, By Displacement Prisms, 2022 - 2032F |
6.2 Lithuania Prisms Market, By Application |
6.2.1 Overview and Analysis |
6.2.2 Lithuania Prisms Market Revenues & Volume, By Microscope, 2022 - 2032F |
6.2.3 Lithuania Prisms Market Revenues & Volume, By Lens, 2022 - 2032F |
6.2.4 Lithuania Prisms Market Revenues & Volume, By Telescope, 2022 - 2032F |
6.2.5 Lithuania Prisms Market Revenues & Volume, By Others, 2022 - 2032F |
7 Lithuania Prisms Market Import-Export Trade Statistics |
7.1 Lithuania Prisms Market Export to Major Countries |
7.2 Lithuania Prisms Market Imports from Major Countries |
8 Lithuania Prisms Market Key Performance Indicators |
8.1 Percentage growth in demand from key industries using prisms |
8.2 Number of new applications or industries adopting prism technology |
8.3 Innovation rate in prism design and materials |
8.4 Percentage of market share captured in specific niche markets for prisms |
8.5 Customer satisfaction index related to the quality and performance of prisms |
9 Lithuania Prisms Market - Opportunity Assessment |
9.1 Lithuania Prisms Market Opportunity Assessment, By Product, 2022 & 2032F |
9.2 Lithuania Prisms Market Opportunity Assessment, By Application, 2022 & 2032F |
10 Lithuania Prisms Market - Competitive Landscape |
10.1 Lithuania Prisms Market Revenue Share, By Companies, 2025 |
10.2 Lithuania Prisms Market Competitive Benchmarking, By Operating and Technical Parameters |
11 Company Profiles |
12 Recommendations | 13 Disclaimer |
Global Go To Market Strategy - 2030
Export potential enables firms to identify high-growth global markets with greater confidence by combining advanced trade intelligence with a structured quantitative methodology. The framework analyzes emerging demand trends and country-level import patterns while integrating macroeconomic and trade datasets such as GDP and population forecasts, bilateral import–export flows, tariff structures, elasticity differentials between developed and developing economies, geographic distance, and import demand projections. Using weighted trade values from 2020–2024 as the base period to project country-to-country export potential for 2030, these inputs are operationalized through calculated drivers such as gravity model parameters, tariff impact factors, and projected GDP per-capita growth. Through an analysis of hidden potentials, demand hotspots, and market conditions that are most favorable to success, this method enables firms to focus on target countries, maximize returns, and global expansion with data, backed by accuracy.
By factoring in the projected importer demand gap that is currently unmet and could be potential opportunity, it identifies the potential for the Exporter (Country) among 190 countries, against the general trade analysis, which identifies the biggest importer or exporter.
To discover high-growth global markets and optimize your business strategy:
Click Here
Pricing
- Single User License$ 1,995
- Department License$ 2,400
- Site License$ 3,120
- Global License$ 3,795

Leadership Perspectives from Industry Events
Search
Thought Leadership and Analyst Meet


Our Clients
6WResearch In News
- Doha a strategic location for EV manufacturing hub: IPA Qatar
- Demand for luxury TVs surging in the GCC, says Samsung
- Empowering Growth: The Thriving Journey of Bangladesh’s Cable Industry
- Demand for luxury TVs surging in the GCC, says Samsung
- Video call with a traditional healer? Once unthinkable, it’s now common in South Africa
- Intelligent Buildings To Smooth GCC’s Path To Net Zero
Latest Reports
- New Zealand Aseptic Manufacturing Market (2026-2032)
- Netherlands Aseptic Manufacturing Market (2026-2032)
- Nauru Aseptic Manufacturing Market (2026-2032)
- Namibia Aseptic Manufacturing Market (2026-2032)
- Mozambique Aseptic Manufacturing Market (2026-2032)
- Montenegro Aseptic Manufacturing Market (2026-2032)
- Mongolia Aseptic Manufacturing Market (2026-2032)
- Monaco Aseptic Manufacturing Market (2026-2032)
- Micronesia Aseptic Manufacturing Market (2026-2032)
- Mauritius Aseptic Manufacturing Market (2026-2032)
Industry Events and Analyst Meet

HIMTEX 2026

India Refining Summit 2026

India EV Show 2026

EV tech India Expo 2026

Auto Tech Asia 2026
Whitepaper
- Middle East & Africa Commercial Security Market Click here to view more.
- Middle East & Africa Fire Safety Systems & Equipment Market Click here to view more.
- GCC Drone Market Click here to view more.
- Middle East Lighting Fixture Market Click here to view more.
- GCC Physical & Perimeter Security Market Click here to view more.