Lithuania Smart water meters Market (2026-2032) | Industry, Trends, Outlook, Analysis, Revenue, Share, Size, Value, Growth, Forecast, Segmentation & Companies
Market Forecast By Type (Auto Meter Reading, Advanced metering Infrastructure), By Application (Residential, Commercial, Industrial) And Competitive Landscape
| Product Code: ETC4791251 | Publication Date: Nov 2023 | Updated Date: Apr 2026 | Product Type: Market Research Report | |
| Publisher: 6Wresearch | Author: Shubham Padhi | No. of Pages: 60 | No. of Figures: 30 | No. of Tables: 5 |
Lithuania Smart Water Meters Market Size (2020-2030)
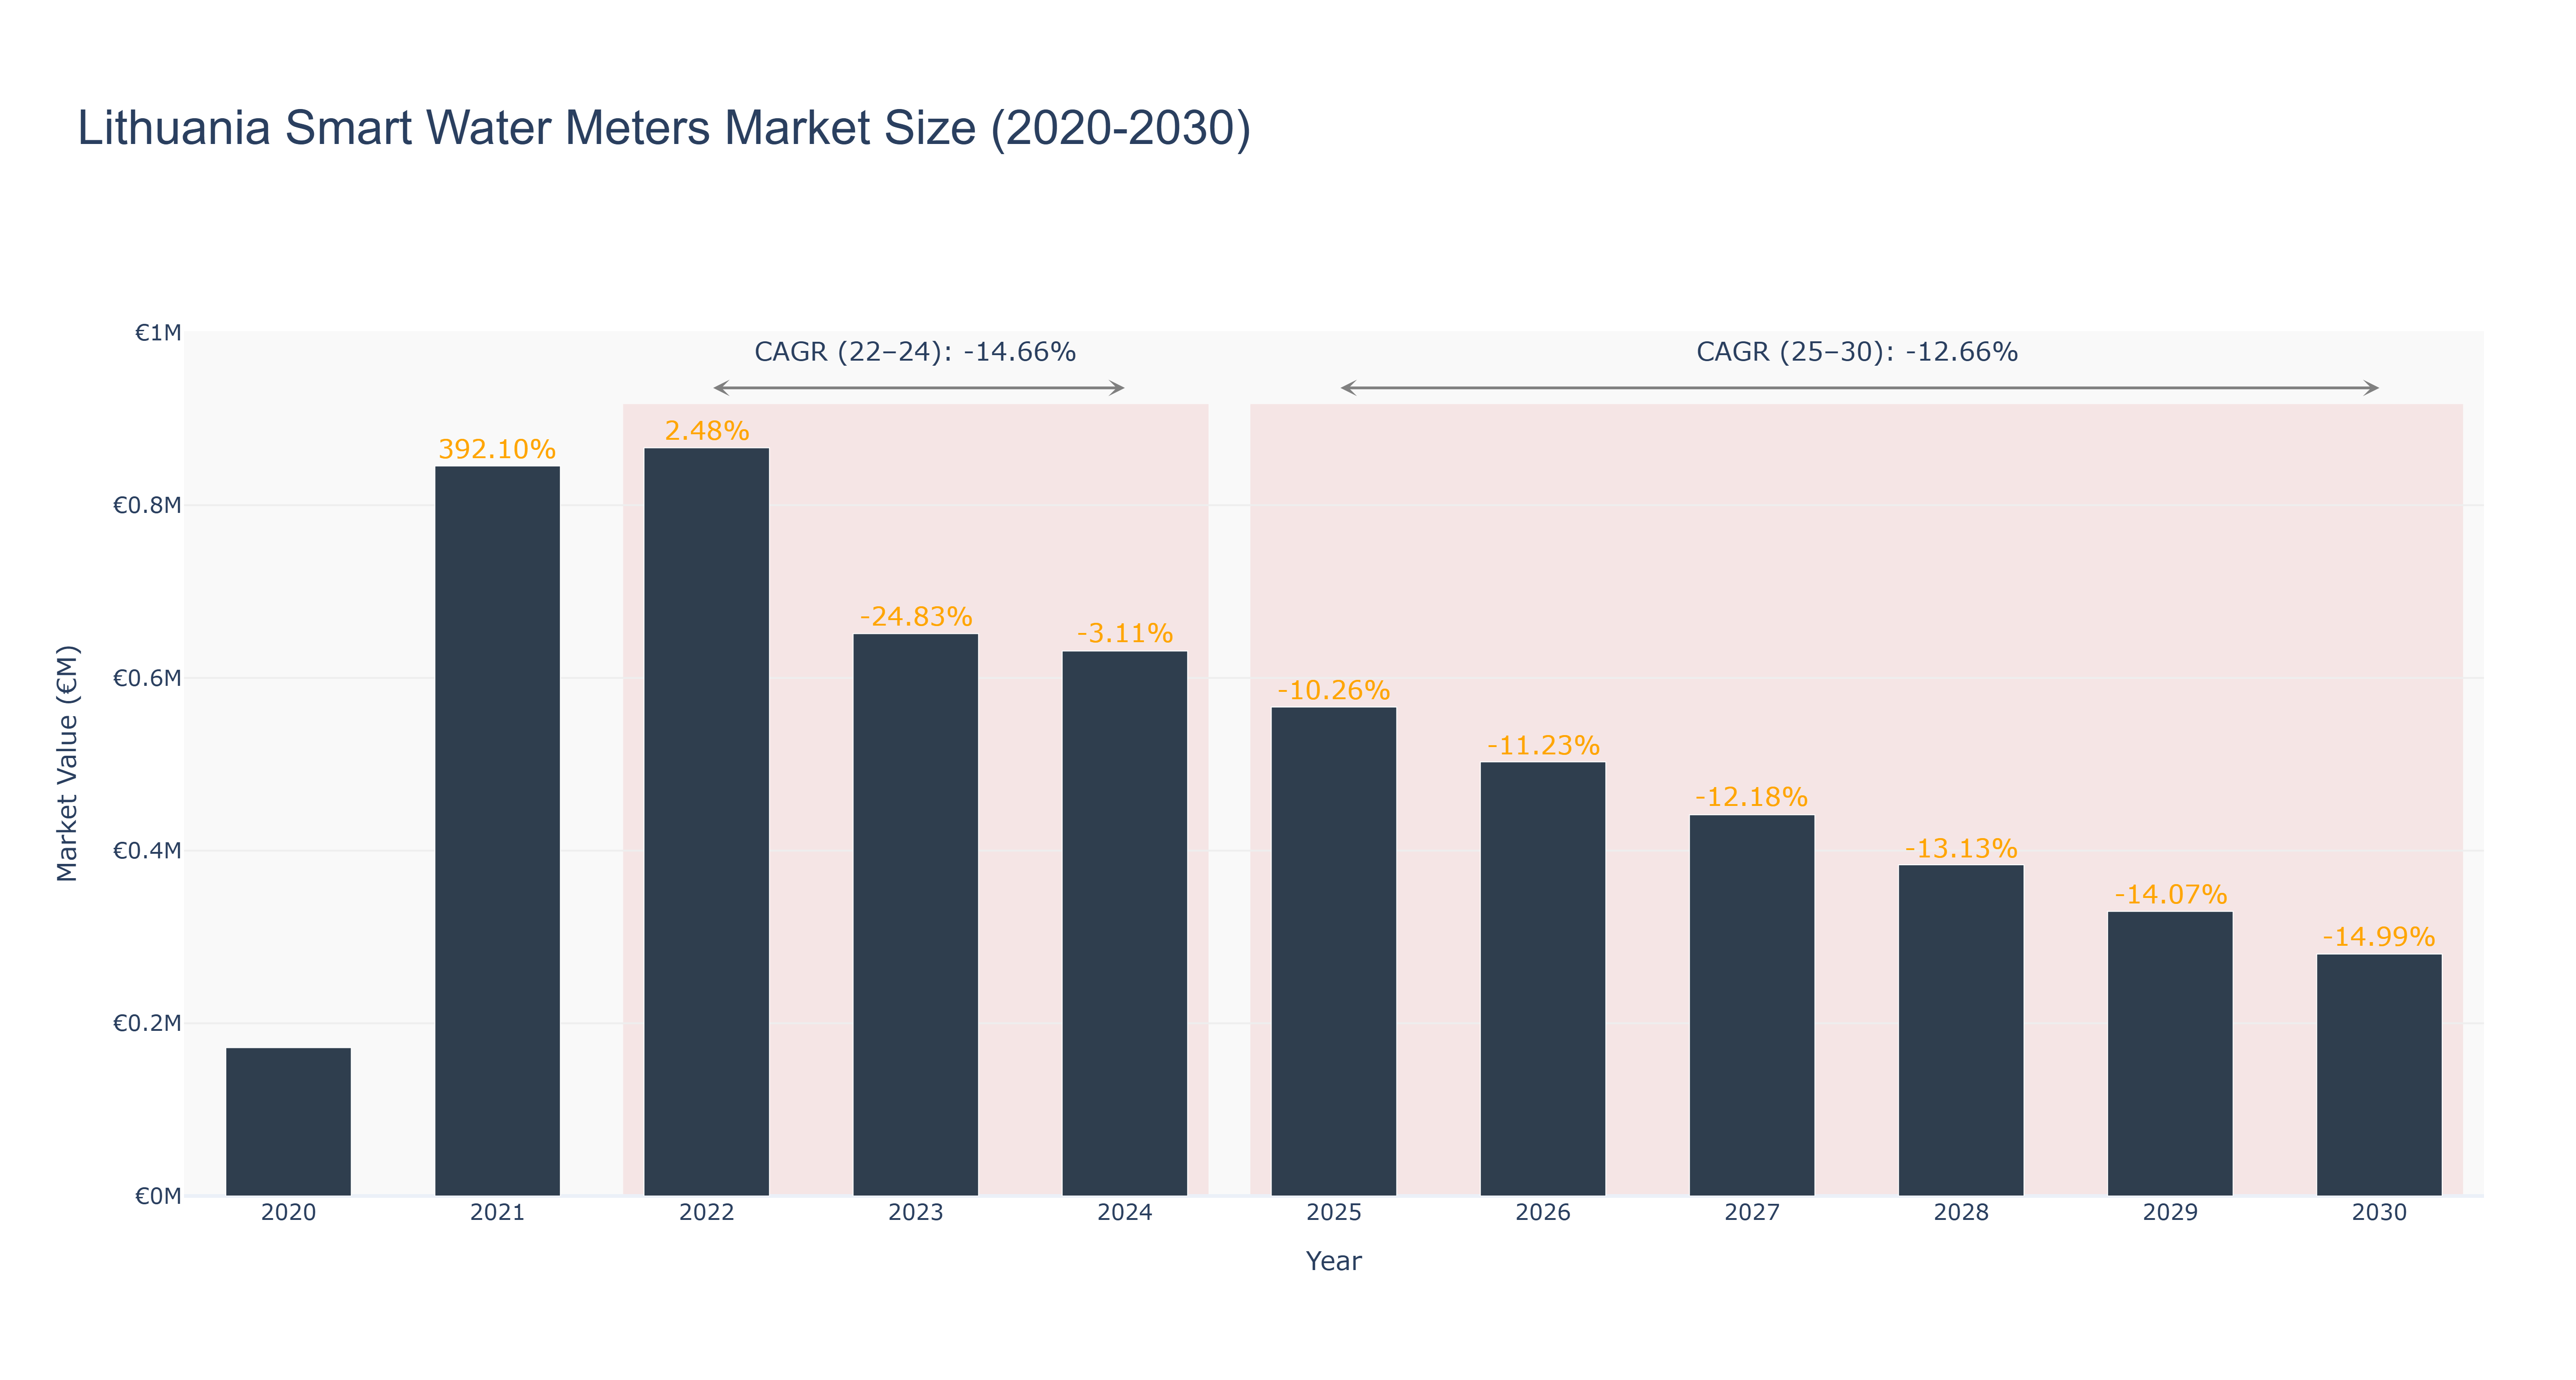
The Lithuania Smart Water Meters Market experienced a peak size of €0.87 million in 2022, followed by a gradual decline to €0.28 million in 2030. The actual market size decreased from €0.87 million in 2022 to €0.63 million in 2024, with a negative CAGR of -14.66% during 2022-24. The forecasted market size is expected to continue declining, with a CAGR of -12.66% from 2025 to 2030. The market trend reflects a challenging landscape, possibly influenced by factors such as regulatory changes, technological advancements, and shifting consumer preferences. Despite the downward trajectory, upcoming projects in smart water management and infrastructure upgrades in Lithuania may offer growth opportunities for the market in the near future. Industry drivers such as water conservation initiatives and the need for efficient resource management will likely shape the market's direction in the coming years.
Lithuania Smart Water Meters Market: Production & Trade Performance (2019-2025)
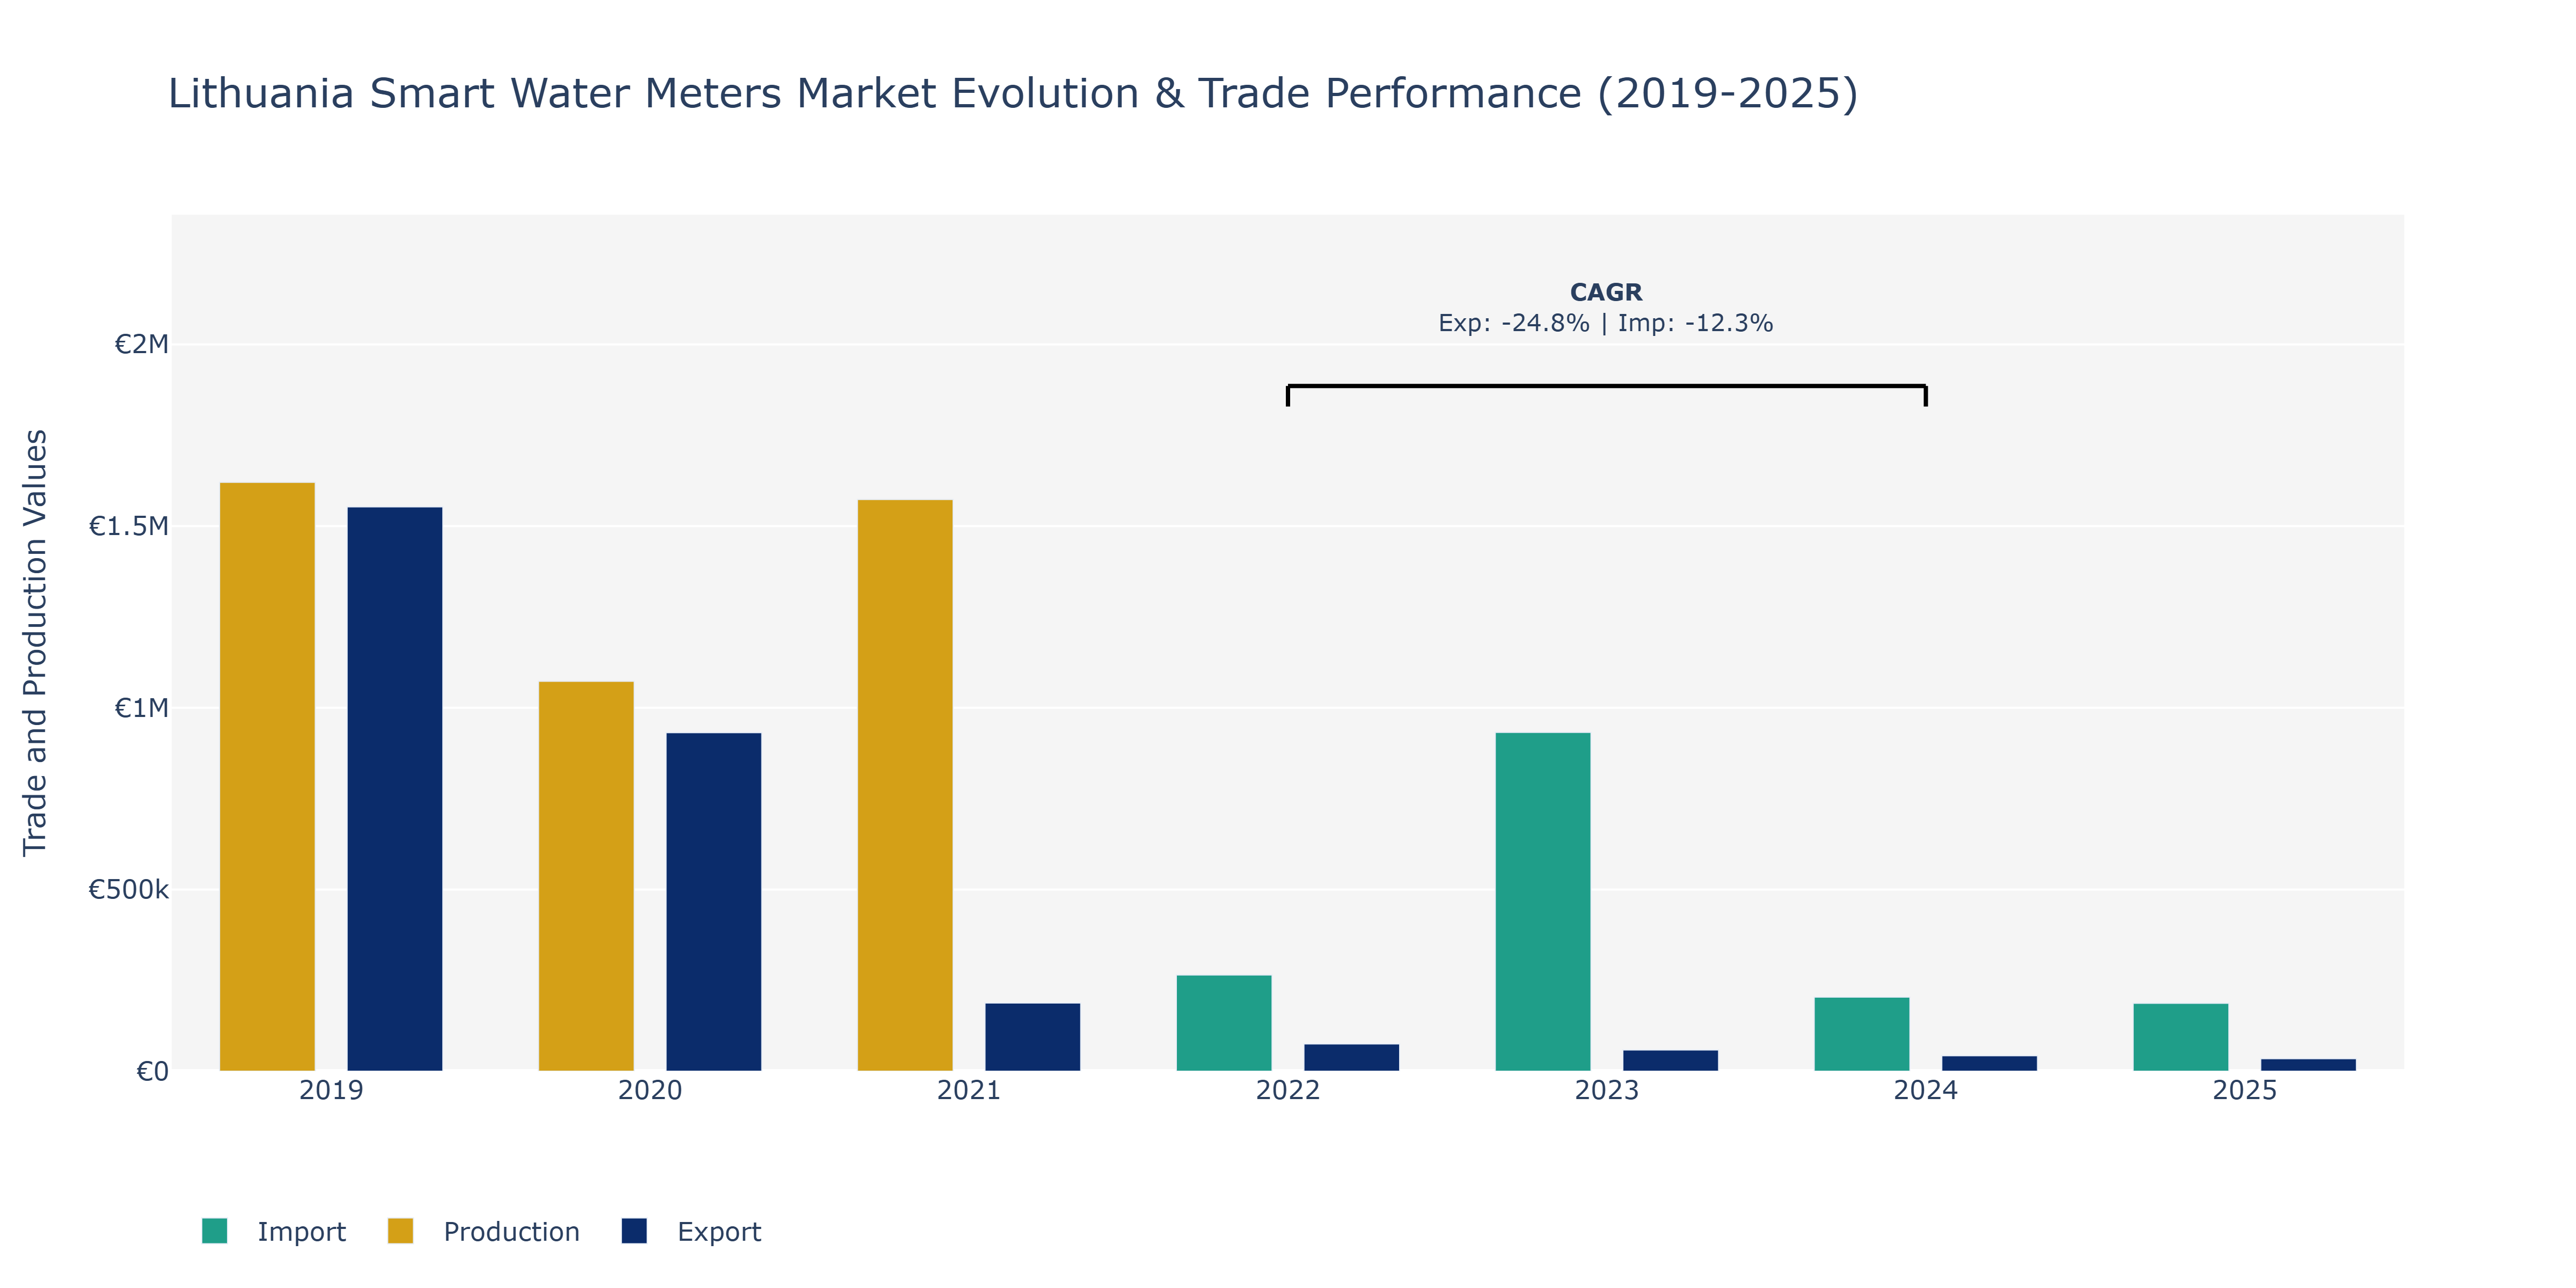
From 2019 to 2025, the Lithuania Smart Water Meters Market witnessed varying trends in Exports, Imports, and Production. In 2019, production stood at €1.62 billion, with exports at €1.55 billion and imports at €63.28 million. However, by 2021, there was a notable decline in exports to €0.19 billion, while imports rose to €87.48 million. This shift could be attributed to evolving trade agreements and market dynamics impacting international sales. Notably, in 2023, both exports and imports decreased significantly, potentially influenced by global economic factors affecting demand and supply chains. By 2025, both exports and imports continued to decline, reflecting potential shifts in consumer preferences or market competitiveness. These fluctuations emphasize the importance of market agility and strategic planning to navigate changing industry landscapes effectively. Further analysis incorporating qualitative insights on technological advancements and regulatory changes could provide a comprehensive understanding of these market dynamics in the Lithuania Smart Water Meters sector.
Key Highlights of the Report:
- Lithuania Smart water meters Market Outlook
- Market Size of Lithuania Smart water meters Market, 2025
- Forecast of Lithuania Smart water meters Market, 2032
- Historical Data and Forecast of Lithuania Smart water meters Revenues & Volume for the Period 2022 - 2032F
- Lithuania Smart water meters Market Trend Evolution
- Lithuania Smart water meters Market Drivers and Challenges
- Lithuania Smart water meters Price Trends
- Lithuania Smart water meters Porter`s Five Forces
- Lithuania Smart water meters Industry Life Cycle
- Historical Data and Forecast of Lithuania Smart water meters Market Revenues & Volume By Type for the Period 2022 - 2032F
- Historical Data and Forecast of Lithuania Smart water meters Market Revenues & Volume By Auto Meter Reading for the Period 2022 - 2032F
- Historical Data and Forecast of Lithuania Smart water meters Market Revenues & Volume By Advanced metering Infrastructure for the Period 2022 - 2032F
- Historical Data and Forecast of Lithuania Smart water meters Market Revenues & Volume By Application for the Period 2022 - 2032F
- Historical Data and Forecast of Lithuania Smart water meters Market Revenues & Volume By Residential for the Period 2022 - 2032F
- Historical Data and Forecast of Lithuania Smart water meters Market Revenues & Volume By Commercial for the Period 2022 - 2032F
- Historical Data and Forecast of Lithuania Smart water meters Market Revenues & Volume By Industrial for the Period 2022 - 2032F
- Lithuania Smart water meters Import Export Trade Statistics
- Market Opportunity Assessment By Type
- Market Opportunity Assessment By Application
- Lithuania Smart water meters Top Companies Market Share
- Lithuania Smart water meters Competitive Benchmarking By Technical and Operational Parameters
- Lithuania Smart water meters Company Profiles
- Lithuania Smart water meters Key Strategic Recommendations
Frequently Asked Questions About the Market Study (FAQs):
6Wresearch actively monitors the Lithuania Smart water meters Market and publishes its comprehensive annual report, highlighting emerging trends, growth drivers, revenue analysis, and forecast outlook. Our insights help businesses to make data-backed strategic decisions with ongoing market dynamics. Our analysts track relevent industries related to the Lithuania Smart water meters Market, allowing our clients with actionable intelligence and reliable forecasts tailored to emerging regional needs.
Yes, we provide customisation as per your requirements. To learn more, feel free to contact us on sales@6wresearch.com
1 Executive Summary |
2 Introduction |
2.1 Key Highlights of the Report |
2.2 Report Description |
2.3 Market Scope & Segmentation |
2.4 Research Methodology |
2.5 Assumptions |
3 Lithuania Smart water meters Market Overview |
3.1 Lithuania Country Macro Economic Indicators |
3.2 Lithuania Smart water meters Market Revenues & Volume, 2022 & 2032F |
3.3 Lithuania Smart water meters Market - Industry Life Cycle |
3.4 Lithuania Smart water meters Market - Porter's Five Forces |
3.5 Lithuania Smart water meters Market Revenues & Volume Share, By Type, 2022 & 2032F |
3.6 Lithuania Smart water meters Market Revenues & Volume Share, By Application, 2022 & 2032F |
4 Lithuania Smart water meters Market Dynamics |
4.1 Impact Analysis |
4.2 Market Drivers |
4.2.1 Growing demand for efficient water management solutions |
4.2.2 Government initiatives promoting smart technology adoption in utilities sector |
4.2.3 Increasing awareness about water conservation and sustainability |
4.3 Market Restraints |
4.3.1 High initial costs associated with smart water meter installation |
4.3.2 Resistance to change from traditional water metering systems |
4.3.3 Concerns regarding data privacy and security |
5 Lithuania Smart water meters Market Trends |
6 Lithuania Smart water meters Market Segmentations |
6.1 Lithuania Smart water meters Market, By Type |
6.1.1 Overview and Analysis |
6.1.2 Lithuania Smart water meters Market Revenues & Volume, By Auto Meter Reading, 2022 - 2032F |
6.1.3 Lithuania Smart water meters Market Revenues & Volume, By Advanced metering Infrastructure, 2022 - 2032F |
6.2 Lithuania Smart water meters Market, By Application |
6.2.1 Overview and Analysis |
6.2.2 Lithuania Smart water meters Market Revenues & Volume, By Residential, 2022 - 2032F |
6.2.3 Lithuania Smart water meters Market Revenues & Volume, By Commercial, 2022 - 2032F |
6.2.4 Lithuania Smart water meters Market Revenues & Volume, By Industrial, 2022 - 2032F |
7 Lithuania Smart water meters Market Import-Export Trade Statistics |
7.1 Lithuania Smart water meters Market Export to Major Countries |
7.2 Lithuania Smart water meters Market Imports from Major Countries |
8 Lithuania Smart water meters Market Key Performance Indicators |
8.1 Percentage of households or businesses using smart water meters |
8.2 Rate of adoption of smart water metering technology |
8.3 Reduction in water consumption after smart meter installation |
8.4 Frequency of maintenance and repair of smart water meters |
8.5 Customer satisfaction levels with smart water metering services |
9 Lithuania Smart water meters Market - Opportunity Assessment |
9.1 Lithuania Smart water meters Market Opportunity Assessment, By Type, 2022 & 2032F |
9.2 Lithuania Smart water meters Market Opportunity Assessment, By Application, 2022 & 2032F |
10 Lithuania Smart water meters Market - Competitive Landscape |
10.1 Lithuania Smart water meters Market Revenue Share, By Companies, 2025 |
10.2 Lithuania Smart water meters Market Competitive Benchmarking, By Operating and Technical Parameters |
11 Company Profiles |
12 Recommendations | 13 Disclaimer |
Global Go To Market Strategy - 2030
Export potential enables firms to identify high-growth global markets with greater confidence by combining advanced trade intelligence with a structured quantitative methodology. The framework analyzes emerging demand trends and country-level import patterns while integrating macroeconomic and trade datasets such as GDP and population forecasts, bilateral import–export flows, tariff structures, elasticity differentials between developed and developing economies, geographic distance, and import demand projections. Using weighted trade values from 2020–2024 as the base period to project country-to-country export potential for 2030, these inputs are operationalized through calculated drivers such as gravity model parameters, tariff impact factors, and projected GDP per-capita growth. Through an analysis of hidden potentials, demand hotspots, and market conditions that are most favorable to success, this method enables firms to focus on target countries, maximize returns, and global expansion with data, backed by accuracy.
By factoring in the projected importer demand gap that is currently unmet and could be potential opportunity, it identifies the potential for the Exporter (Country) among 190 countries, against the general trade analysis, which identifies the biggest importer or exporter.
To discover high-growth global markets and optimize your business strategy:
Click Here
Pricing
- Single User License$ 1,995
- Department License$ 2,400
- Site License$ 3,120
- Global License$ 3,795

Leadership Perspectives from Industry Events
Search
Thought Leadership and Analyst Meet


Our Clients
6WResearch In News
- India Air Conditioner Market Set for Strong Rebound in 2026 After Weather-Led Correction and GST-Driven Recovery: 6Wresearch
- ADAS in India: How Automatic Emergency Braking, Blind Spot Detection & Driver Monitoring are Transforming Road Safety
- Doha a strategic location for EV manufacturing hub: IPA Qatar
- Demand for luxury TVs surging in the GCC, says Samsung
- Empowering Growth: The Thriving Journey of Bangladesh’s Cable Industry
- Demand for luxury TVs surging in the GCC, says Samsung
Latest Reports
- Nicaragua RPG Gaming Market (2026-2032)
- New Zealand RPG Gaming Market (2026-2032)
- Netherlands RPG Gaming Market (2026-2032)
- Nauru RPG Gaming Market (2026-2032)
- Namibia RPG Gaming Market (2026-2032)
- Mozambique RPG Gaming Market (2026-2032)
- Montenegro RPG Gaming Market (2026-2032)
- Mongolia RPG Gaming Market (2026-2032)
- Monaco RPG Gaming Market (2026-2032)
- Micronesia RPG Gaming Market (2026-2032)
Industry Events and Analyst Meet

EV India Expo 2026

HIMTEX 2026

India Refining Summit 2026

India EV Show 2026

EV tech India Expo 2026
Whitepaper
- Middle East & Africa Commercial Security Market Click here to view more.
- Middle East & Africa Fire Safety Systems & Equipment Market Click here to view more.
- GCC Drone Market Click here to view more.
- Middle East Lighting Fixture Market Click here to view more.
- GCC Physical & Perimeter Security Market Click here to view more.