Lithuania Thermal Transfer Ribbon Market (2026-2032) | Outlook, Trends, Growth, Forecast, Size & Revenue, Industry, Share, Value, Competitive Landscape, Companies, Analysis, Segmentation
Market Forecast By Type (Wax Base Thermal Transfer Ribbon, Wax/Resin Mixed Base Thermal Transfer Ribbon, Resin Base Thermal Transfer Ribbon), By Application (Packaging, Manufacturing, Retail, Others) And Competitive Landscape
| Product Code: ETC8052944 | Publication Date: Sep 2024 | Updated Date: Apr 2026 | Product Type: Market Research Report | |
| Publisher: 6Wresearch | Author: Shubham Padhi | No. of Pages: 75 | No. of Figures: 35 | No. of Tables: 20 |
Lithuania Thermal Transfer Ribbon Market Size (2020-2030)
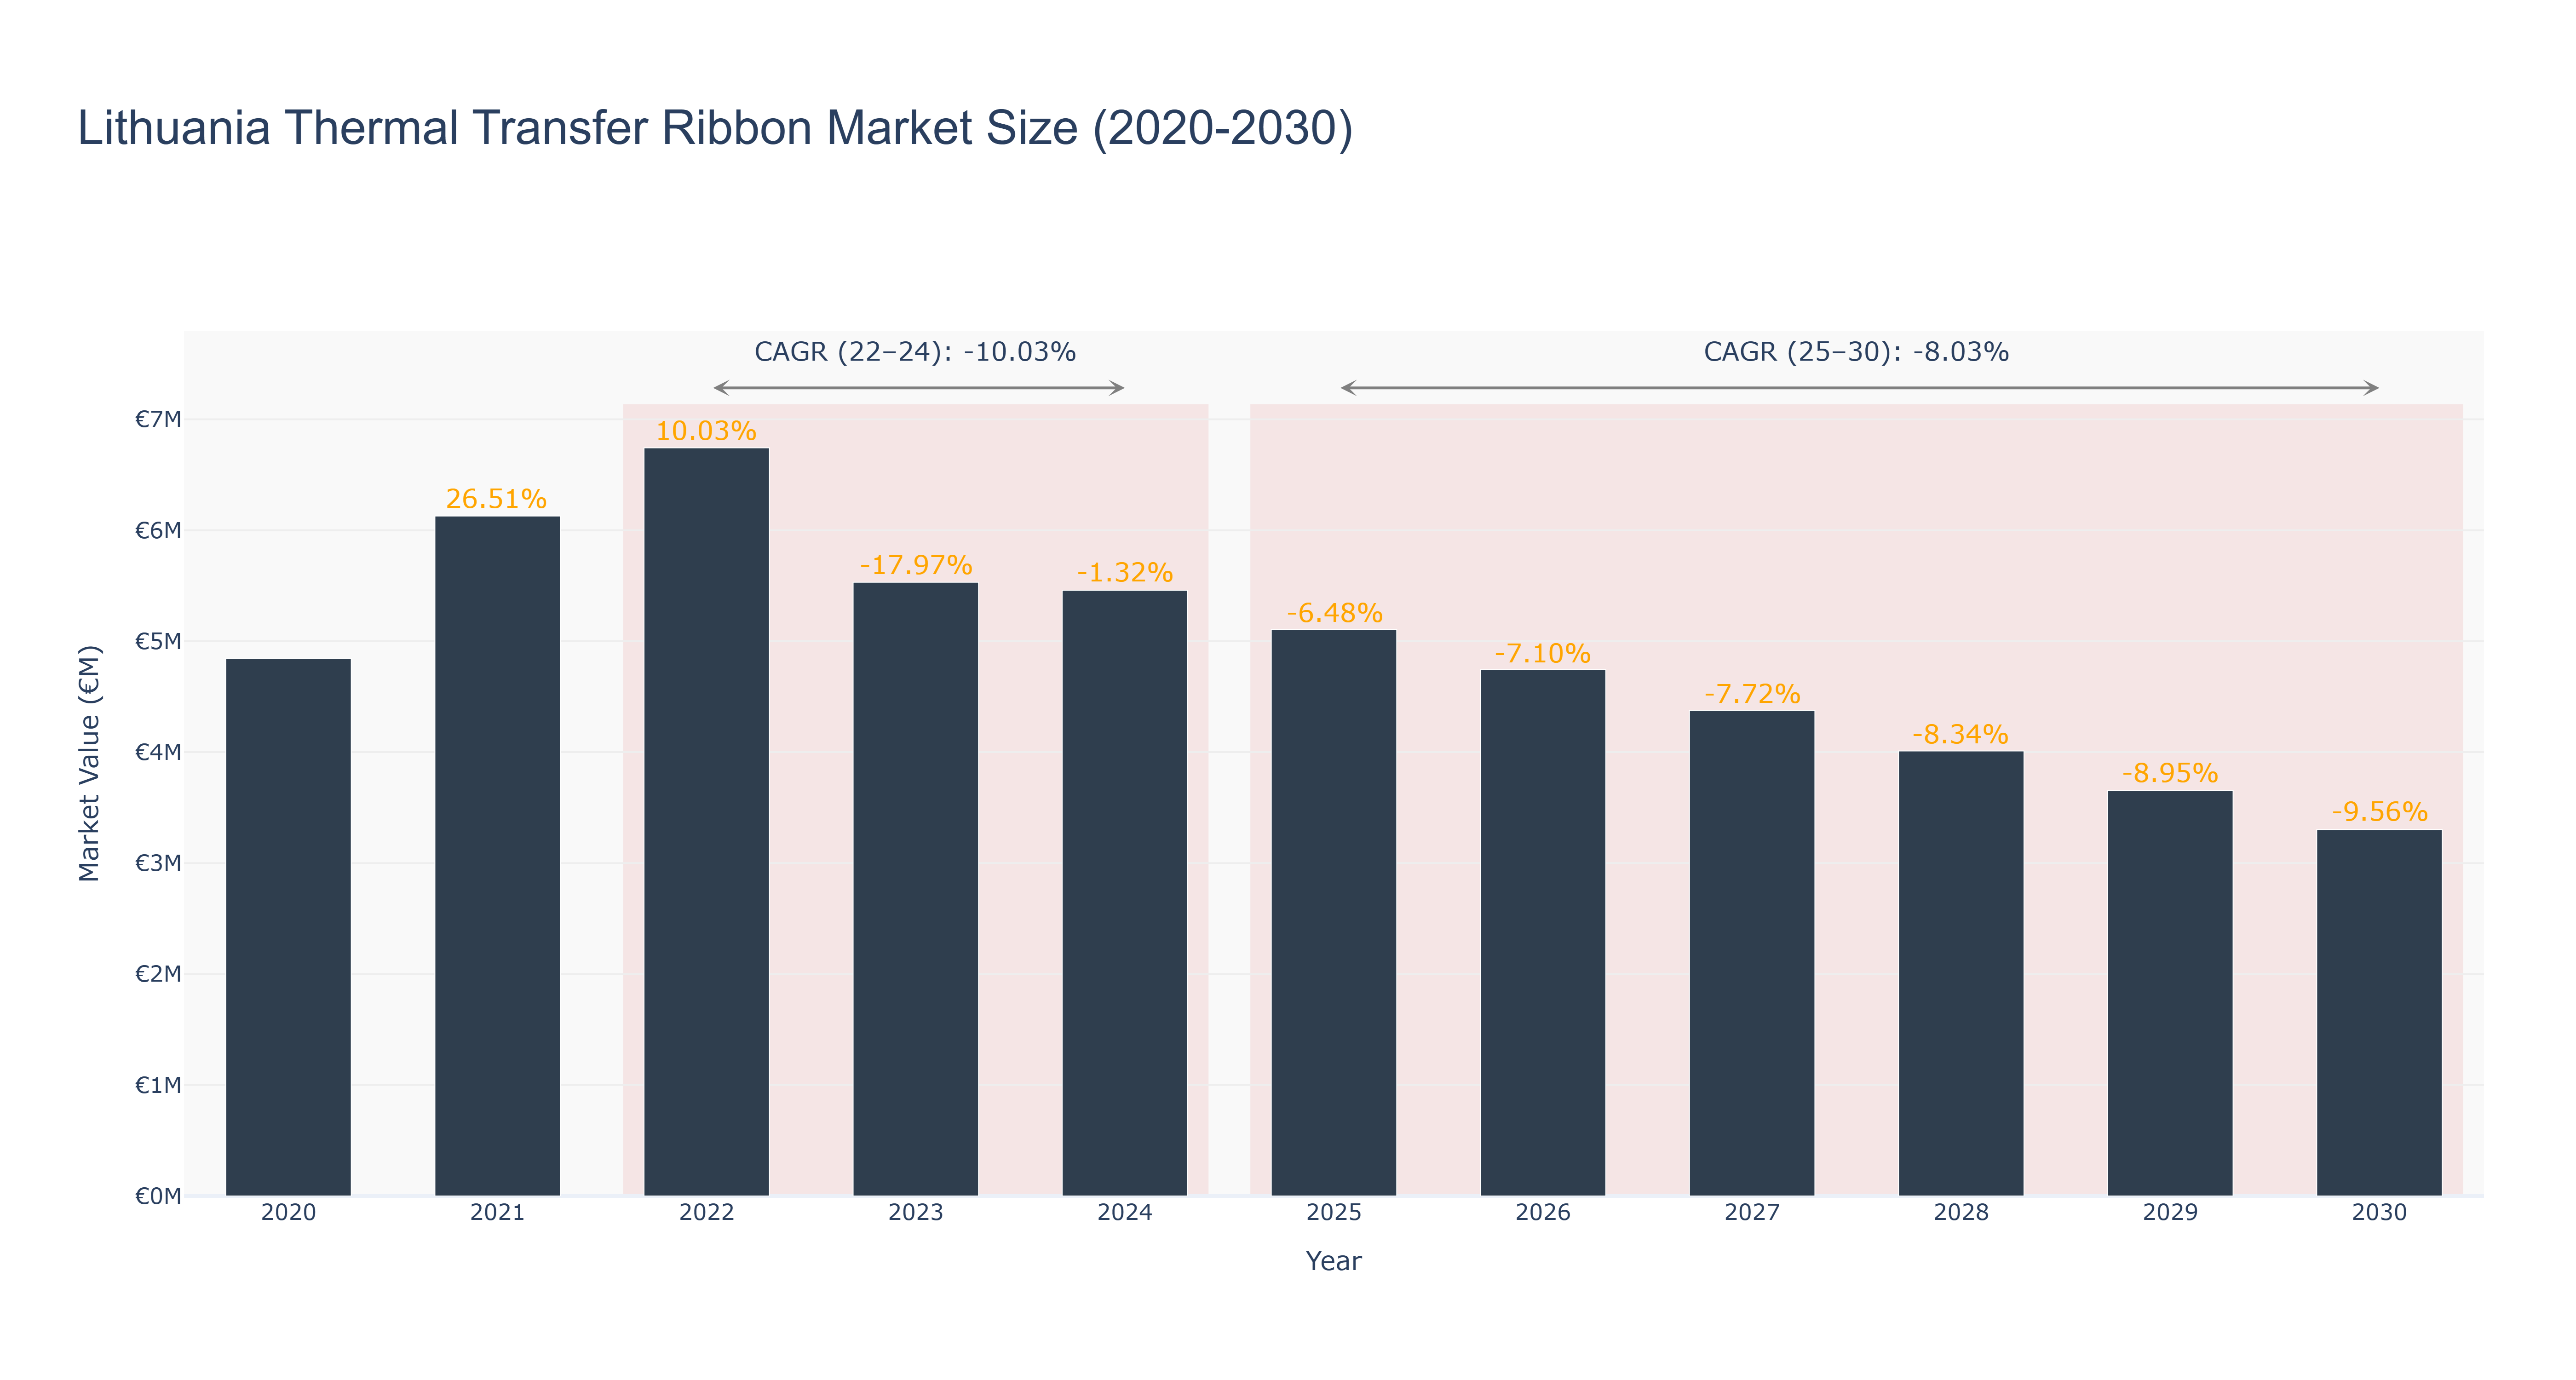
Lithuania Thermal Transfer Ribbon Market has experienced a decline in market size from €4.84 million in 2020 to €3.30 million in 2030, with a notable drop between 2022 and 2024 and a forecasted continuous decrease from 2025 to 2030. The peak market size was recorded in 2022 at €6.74 million. The CAGR for the period 2022-24 was -10.03%, and for 2025-30, it is projected to be -8.03%. The market downturn can be attributed to factors such as technological advancements leading to reduced demand, cost pressures impacting pricing strategies, and evolving consumer preferences towards alternative products. Looking ahead, Lithuania is focusing on enhancing its manufacturing capabilities in the thermal transfer ribbon sector to boost competitiveness and cater to changing market dynamics. Industry drivers for the Lithuania Thermal Transfer Ribbon Market include increasing demand for barcode labels in various industries, the growing e-commerce sector, and the need for efficient labeling solutions for product identification and tracking purposes.
Lithuania Thermal Transfer Ribbon Market: Production & Trade Performance (2019-2025)
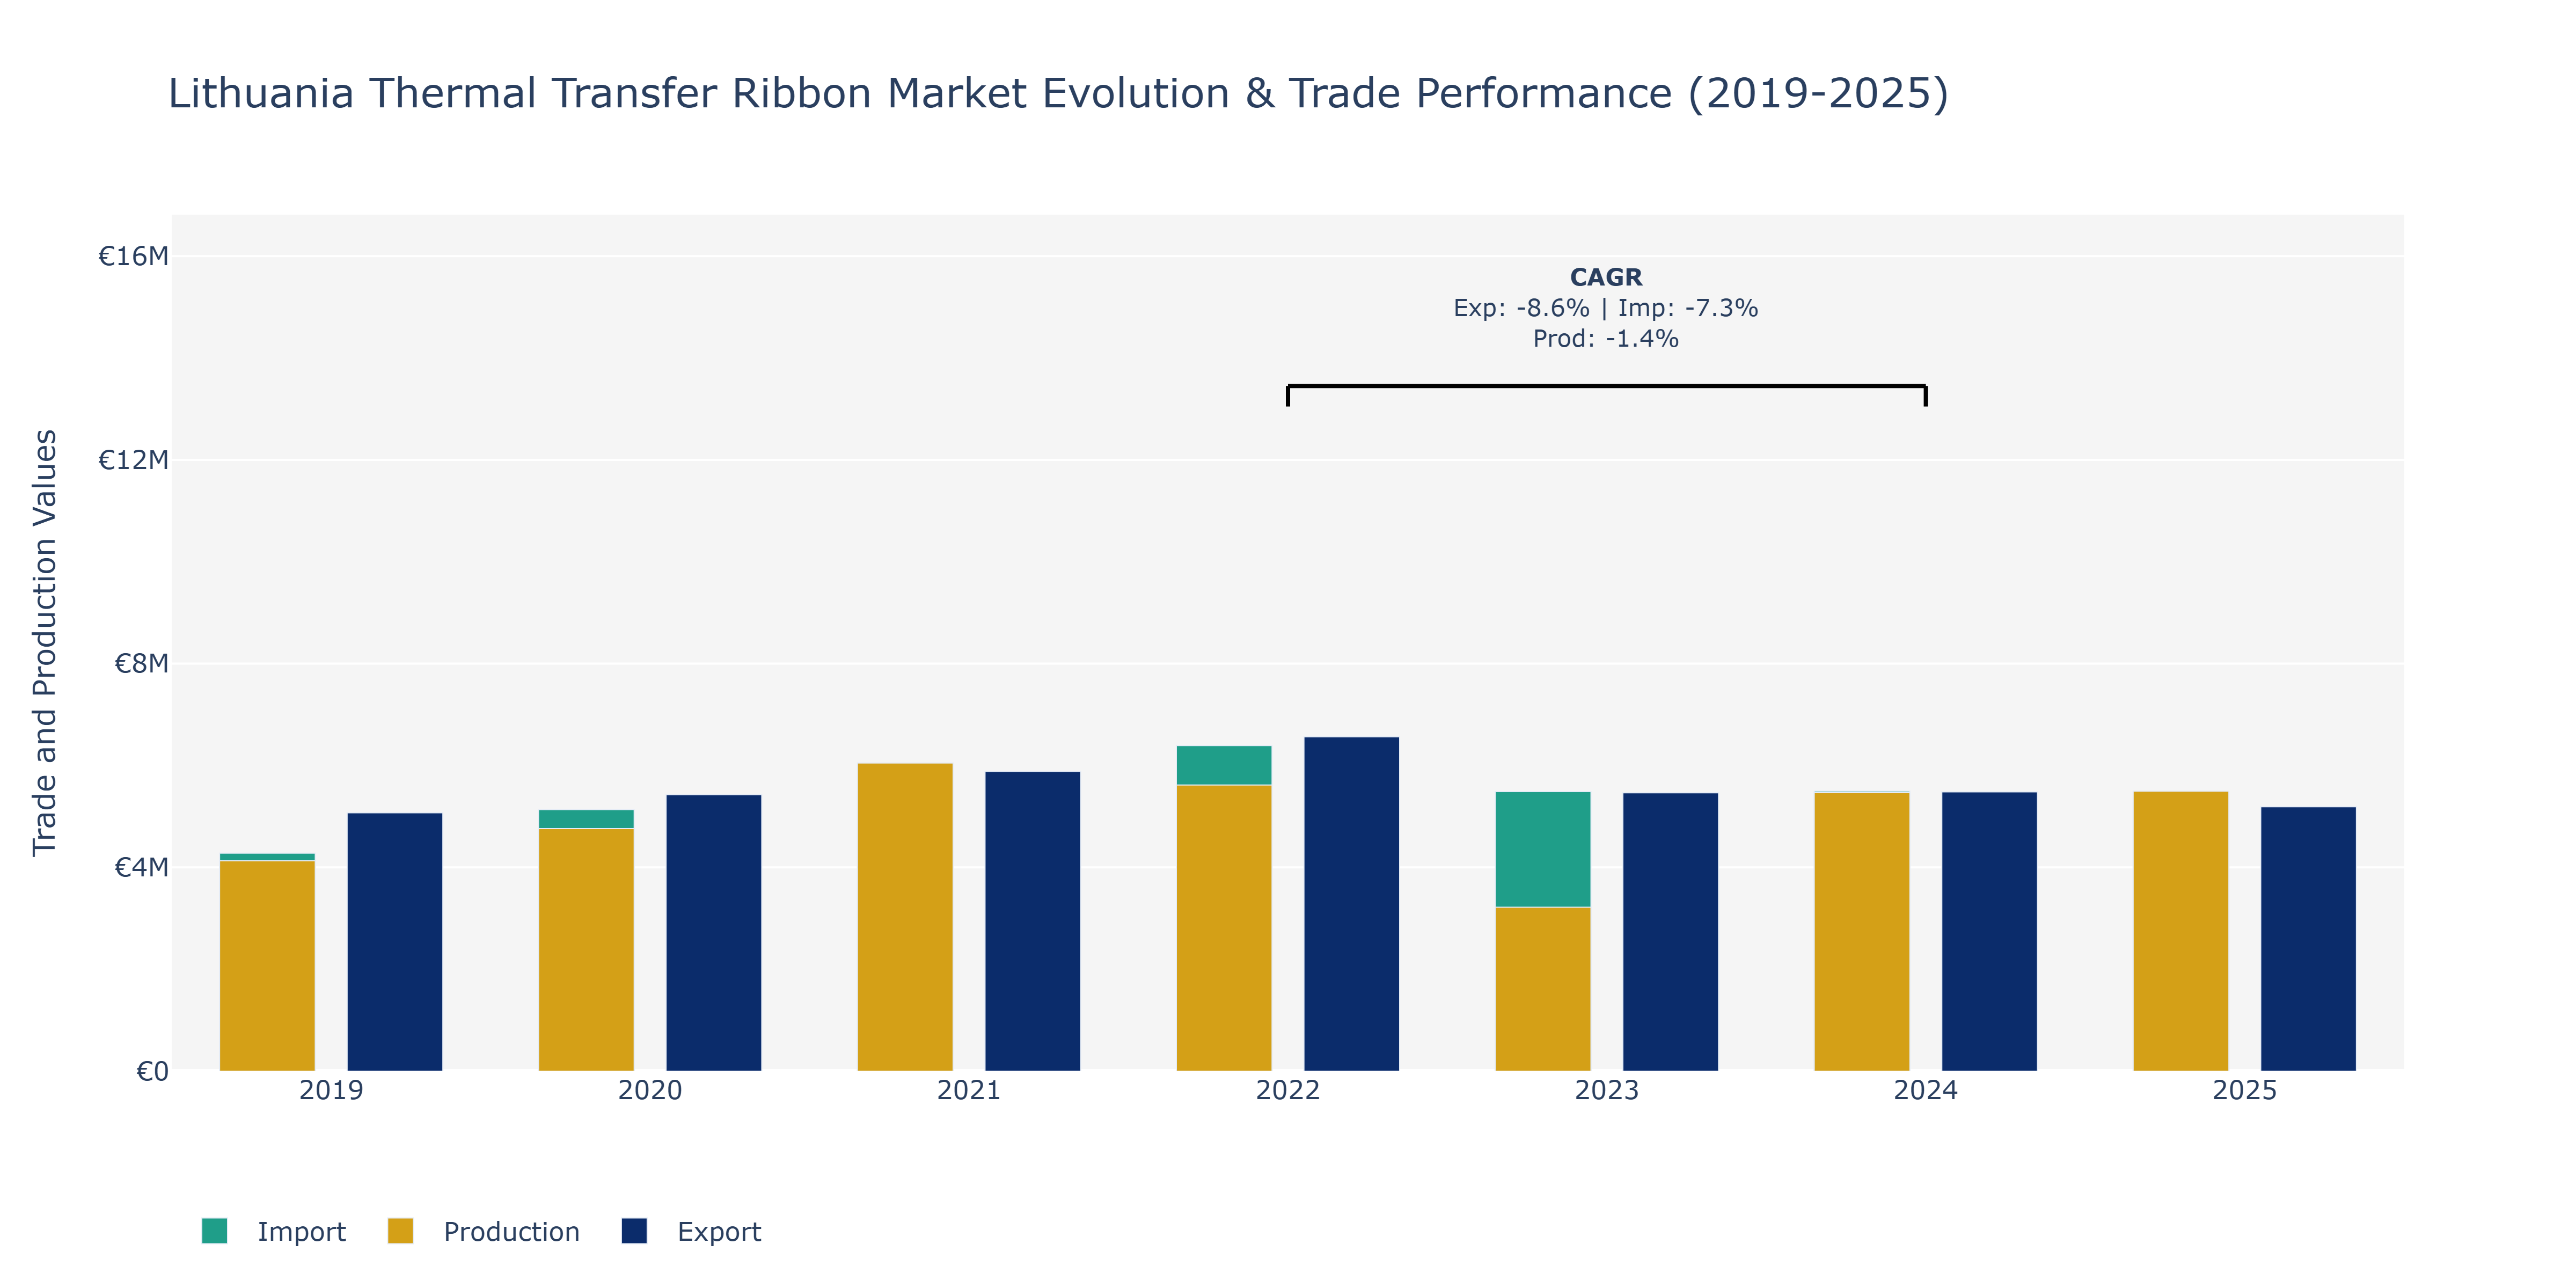
In the Lithuania Thermal Transfer Ribbon Market, exports showed a fluctuating trend over the years, starting at €5.07 million in 2019, increasing to €6.56 million in 2022, and then declining to €5.19 million in 2025. This decline can be attributed to various factors such as changes in global demand, competition from other markets, or shifts in pricing strategies. Imports followed a similar pattern, rising from €4.28 million in 2019 to €6.39 million in 2022, before decreasing to €5.26 million in 2025. Production levels also fluctuated, with a peak in 2021 at €5.88 million, followed by a significant drop to €5.47 million in 2023, and a gradual recovery thereafter. These fluctuations could be influenced by technological advancements impacting production efficiency, market saturation, or changes in raw material costs. The market may benefit from strategic partnerships to boost exports, optimize production processes, and manage import costs effectively, ensuring sustained growth in the coming years.
Key Highlights of the Report:
- Lithuania Thermal Transfer Ribbon Market Outlook
- Market Size of Lithuania Thermal Transfer Ribbon Market, 2025
- Forecast of Lithuania Thermal Transfer Ribbon Market, 2032
- Historical Data and Forecast of Lithuania Thermal Transfer Ribbon Revenues & Volume for the Period 2022 - 2032
- Lithuania Thermal Transfer Ribbon Market Trend Evolution
- Lithuania Thermal Transfer Ribbon Market Drivers and Challenges
- Lithuania Thermal Transfer Ribbon Price Trends
- Lithuania Thermal Transfer Ribbon Porter's Five Forces
- Lithuania Thermal Transfer Ribbon Industry Life Cycle
- Historical Data and Forecast of Lithuania Thermal Transfer Ribbon Market Revenues & Volume By Type for the Period 2022 - 2032
- Historical Data and Forecast of Lithuania Thermal Transfer Ribbon Market Revenues & Volume By Wax Base Thermal Transfer Ribbon for the Period 2022 - 2032
- Historical Data and Forecast of Lithuania Thermal Transfer Ribbon Market Revenues & Volume By Wax/Resin Mixed Base Thermal Transfer Ribbon for the Period 2022 - 2032
- Historical Data and Forecast of Lithuania Thermal Transfer Ribbon Market Revenues & Volume By Resin Base Thermal Transfer Ribbon for the Period 2022 - 2032
- Historical Data and Forecast of Lithuania Thermal Transfer Ribbon Market Revenues & Volume By Application for the Period 2022 - 2032
- Historical Data and Forecast of Lithuania Thermal Transfer Ribbon Market Revenues & Volume By Packaging for the Period 2022 - 2032
- Historical Data and Forecast of Lithuania Thermal Transfer Ribbon Market Revenues & Volume By Manufacturing for the Period 2022 - 2032
- Historical Data and Forecast of Lithuania Thermal Transfer Ribbon Market Revenues & Volume By Retail for the Period 2022 - 2032
- Historical Data and Forecast of Lithuania Thermal Transfer Ribbon Market Revenues & Volume By Others for the Period 2022 - 2032
- Lithuania Thermal Transfer Ribbon Import Export Trade Statistics
- Market Opportunity Assessment By Type
- Market Opportunity Assessment By Application
- Lithuania Thermal Transfer Ribbon Top Companies Market Share
- Lithuania Thermal Transfer Ribbon Competitive Benchmarking By Technical and Operational Parameters
- Lithuania Thermal Transfer Ribbon Company Profiles
- Lithuania Thermal Transfer Ribbon Key Strategic Recommendations
Frequently Asked Questions About the Market Study (FAQs):
6Wresearch actively monitors the Lithuania Thermal Transfer Ribbon Market and publishes its comprehensive annual report, highlighting emerging trends, growth drivers, revenue analysis, and forecast outlook. Our insights help businesses to make data-backed strategic decisions with ongoing market dynamics. Our analysts track relevent industries related to the Lithuania Thermal Transfer Ribbon Market, allowing our clients with actionable intelligence and reliable forecasts tailored to emerging regional needs.
Yes, we provide customisation as per your requirements. To learn more, feel free to contact us on sales@6wresearch.com
1 Executive Summary |
2 Introduction |
2.1 Key Highlights of the Report |
2.2 Report Description |
2.3 Market Scope & Segmentation |
2.4 Research Methodology |
2.5 Assumptions |
3 Lithuania Thermal Transfer Ribbon Market Overview |
3.1 Lithuania Country Macro Economic Indicators |
3.2 Lithuania Thermal Transfer Ribbon Market Revenues & Volume, 2022 & 2032F |
3.3 Lithuania Thermal Transfer Ribbon Market - Industry Life Cycle |
3.4 Lithuania Thermal Transfer Ribbon Market - Porter's Five Forces |
3.5 Lithuania Thermal Transfer Ribbon Market Revenues & Volume Share, By Type, 2022 & 2032F |
3.6 Lithuania Thermal Transfer Ribbon Market Revenues & Volume Share, By Application, 2022 & 2032F |
4 Lithuania Thermal Transfer Ribbon Market Dynamics |
4.1 Impact Analysis |
4.2 Market Drivers |
4.2.1 Growing demand for barcode labeling in various industries |
4.2.2 Increasing adoption of thermal transfer printing technology |
4.2.3 Rising emphasis on product traceability and anti-counterfeiting measures |
4.3 Market Restraints |
4.3.1 High initial investment cost for thermal transfer printing equipment |
4.3.2 Competition from alternative printing technologies such as direct thermal printing |
4.3.3 Limited awareness about the benefits of thermal transfer ribbons among end-users |
5 Lithuania Thermal Transfer Ribbon Market Trends |
6 Lithuania Thermal Transfer Ribbon Market, By Types |
6.1 Lithuania Thermal Transfer Ribbon Market, By Type |
6.1.1 Overview and Analysis |
6.1.2 Lithuania Thermal Transfer Ribbon Market Revenues & Volume, By Type, 2022 - 2032F |
6.1.3 Lithuania Thermal Transfer Ribbon Market Revenues & Volume, By Wax Base Thermal Transfer Ribbon, 2022 - 2032F |
6.1.4 Lithuania Thermal Transfer Ribbon Market Revenues & Volume, By Wax/Resin Mixed Base Thermal Transfer Ribbon, 2022 - 2032F |
6.1.5 Lithuania Thermal Transfer Ribbon Market Revenues & Volume, By Resin Base Thermal Transfer Ribbon, 2022 - 2032F |
6.2 Lithuania Thermal Transfer Ribbon Market, By Application |
6.2.1 Overview and Analysis |
6.2.2 Lithuania Thermal Transfer Ribbon Market Revenues & Volume, By Packaging, 2022 - 2032F |
6.2.3 Lithuania Thermal Transfer Ribbon Market Revenues & Volume, By Manufacturing, 2022 - 2032F |
6.2.4 Lithuania Thermal Transfer Ribbon Market Revenues & Volume, By Retail, 2022 - 2032F |
6.2.5 Lithuania Thermal Transfer Ribbon Market Revenues & Volume, By Others, 2022 - 2032F |
7 Lithuania Thermal Transfer Ribbon Market Import-Export Trade Statistics |
7.1 Lithuania Thermal Transfer Ribbon Market Export to Major Countries |
7.2 Lithuania Thermal Transfer Ribbon Market Imports from Major Countries |
8 Lithuania Thermal Transfer Ribbon Market Key Performance Indicators |
8.1 Percentage increase in the number of barcode labels used in industries |
8.2 Adoption rate of thermal transfer printing technology in key sectors |
8.3 Number of anti-counterfeiting initiatives utilizing thermal transfer ribbons |
9 Lithuania Thermal Transfer Ribbon Market - Opportunity Assessment |
9.1 Lithuania Thermal Transfer Ribbon Market Opportunity Assessment, By Type, 2022 & 2032F |
9.2 Lithuania Thermal Transfer Ribbon Market Opportunity Assessment, By Application, 2022 & 2032F |
10 Lithuania Thermal Transfer Ribbon Market - Competitive Landscape |
10.1 Lithuania Thermal Transfer Ribbon Market Revenue Share, By Companies, 2025 |
10.2 Lithuania Thermal Transfer Ribbon Market Competitive Benchmarking, By Operating and Technical Parameters |
11 Company Profiles |
12 Recommendations |
13 Disclaimer |
Export potential assessment - trade Analytics for 2030
Export potential enables firms to identify high-growth global markets with greater confidence by combining advanced trade intelligence with a structured quantitative methodology. The framework analyzes emerging demand trends and country-level import patterns while integrating macroeconomic and trade datasets such as GDP and population forecasts, bilateral import–export flows, tariff structures, elasticity differentials between developed and developing economies, geographic distance, and import demand projections. Using weighted trade values from 2020–2024 as the base period to project country-to-country export potential for 2030, these inputs are operationalized through calculated drivers such as gravity model parameters, tariff impact factors, and projected GDP per-capita growth. Through an analysis of hidden potentials, demand hotspots, and market conditions that are most favorable to success, this method enables firms to focus on target countries, maximize returns, and global expansion with data, backed by accuracy.
By factoring in the projected importer demand gap that is currently unmet and could be potential opportunity, it identifies the potential for the Exporter (Country) among 190 countries, against the general trade analysis, which identifies the biggest importer or exporter.
To discover high-growth global markets and optimize your business strategy:
Click Here
Pricing
- Single User License$ 1,995
- Department License$ 2,400
- Site License$ 3,120
- Global License$ 3,795

Search
Thought Leadership and Analyst Meet


Our Clients
Latest Reports
- United Kingdom (UK) Outdoor Cooking Equipment Market (2026-2032) | Investment Opportunities, Outlook, Growth, Competition, Trends, Pricing, Demand, Insights, Challenges, Drivers, Size, Restraints, segmentation, Value, Share, Forecast, Companies, Analysis, Revenue, Strategy
- United Arab Emirates (UAE) Outdoor Cooking Equipment Market (2026-2032) | Challenges, Value, Restraints, Growth, Competition, Revenue, Trends, Outlook, Analysis, Drivers, Share, Investment Opportunities, Strategy, Demand, Companies, Forecast, Pricing, segmentation, Size, Insights
- Vietnam Outdoor Cooking Equipment Market (2026-2032) | Demand, Investment Opportunities, Growth, Pricing, Trends, Restraints, Competition, Outlook, Drivers, Strategy, Challenges, Revenue, Analysis, segmentation, Value, Size, Share, Insights, Companies, Forecast
- Venezuela Outdoor Cooking Equipment Market (2026-2032) | Challenges, Revenue, Demand, Value, Pricing, Strategy, Competition, Analysis, Companies, Insights, Growth, Outlook, Forecast, Size, Restraints, segmentation, Drivers, Trends, Investment Opportunities, Share
- Uganda Outdoor Cooking Equipment Market (2026-2032) | Drivers, Pricing, Challenges, Value, Growth, Companies, segmentation, Strategy, Analysis, Demand, Outlook, Size, Competition, Restraints, Revenue, Forecast, Investment Opportunities, Insights, Trends, Share
- Turkey Outdoor Cooking Equipment Market (2026-2032) | Size, Competition, Outlook, Strategy, Forecast, Drivers, Trends, Companies, Revenue, Growth, Analysis, segmentation, Insights, Pricing, Restraints, Demand, Investment Opportunities, Value, Share, Challenges
- Tunisia Outdoor Cooking Equipment Market (2026-2032) | Analysis, Share, Pricing, Trends, Size, Outlook, Revenue, segmentation, Demand, Insights, Investment Opportunities, Restraints, Growth, Forecast, Competition, Drivers, Challenges, Companies, Strategy, Value
- Thailand Outdoor Cooking Equipment Market (2026-2032) | Growth, Revenue, Insights, Companies, Drivers, Strategy, Forecast, Size, Analysis, segmentation, Trends, Challenges, Competition, Share, Investment Opportunities, Demand, Pricing, Value, Restraints, Outlook
- Tanzania Outdoor Cooking Equipment Market (2026-2032) | Share, Drivers, Forecast, Revenue, Growth, Outlook, Analysis, Investment Opportunities, Restraints, segmentation, Demand, Pricing, Size, Insights, Challenges, Competition, Companies, Value, Trends, Strategy
- Tajikistan Outdoor Cooking Equipment Market (2026-2032) | Value, Pricing, Companies, Share, Strategy, Revenue, Investment Opportunities, Demand, Forecast, Size, Competition, Challenges, Growth, Insights, Restraints, segmentation, Analysis, Trends, Drivers, Outlook
Industry Events and Analyst Meet

HIMTEX 2026

India Refining Summit 2026

India EV Show 2026

EV tech India Expo 2026

Auto Tech Asia 2026
Whitepaper
- Middle East & Africa Commercial Security Market Click here to view more.
- Middle East & Africa Fire Safety Systems & Equipment Market Click here to view more.
- GCC Drone Market Click here to view more.
- Middle East Lighting Fixture Market Click here to view more.
- GCC Physical & Perimeter Security Market Click here to view more.
6WResearch In News
- Doha a strategic location for EV manufacturing hub: IPA Qatar
- Demand for luxury TVs surging in the GCC, says Samsung
- Empowering Growth: The Thriving Journey of Bangladesh’s Cable Industry
- Demand for luxury TVs surging in the GCC, says Samsung
- Video call with a traditional healer? Once unthinkable, it’s now common in South Africa
- Intelligent Buildings To Smooth GCC’s Path To Net Zero