Luxembourg Automated Curtains Market (2026-2032) | Analysis, Share, Value, Competitive Landscape, Companies, Segmentation, Industry, Forecast, Trends, Size & Revenue, Growth, Outlook
Market Forecast By Product (Ripplefold, Pinch Pleat), By Application (Residential, Commercial) And Competitive Landscape
| Product Code: ETC8056362 | Publication Date: Sep 2024 | Updated Date: Apr 2026 | Product Type: Market Research Report | |
| Publisher: 6Wresearch | Author: Sumit Sagar | No. of Pages: 75 | No. of Figures: 35 | No. of Tables: 20 |
Luxembourg Automated Curtains Market Size (2020-2030)
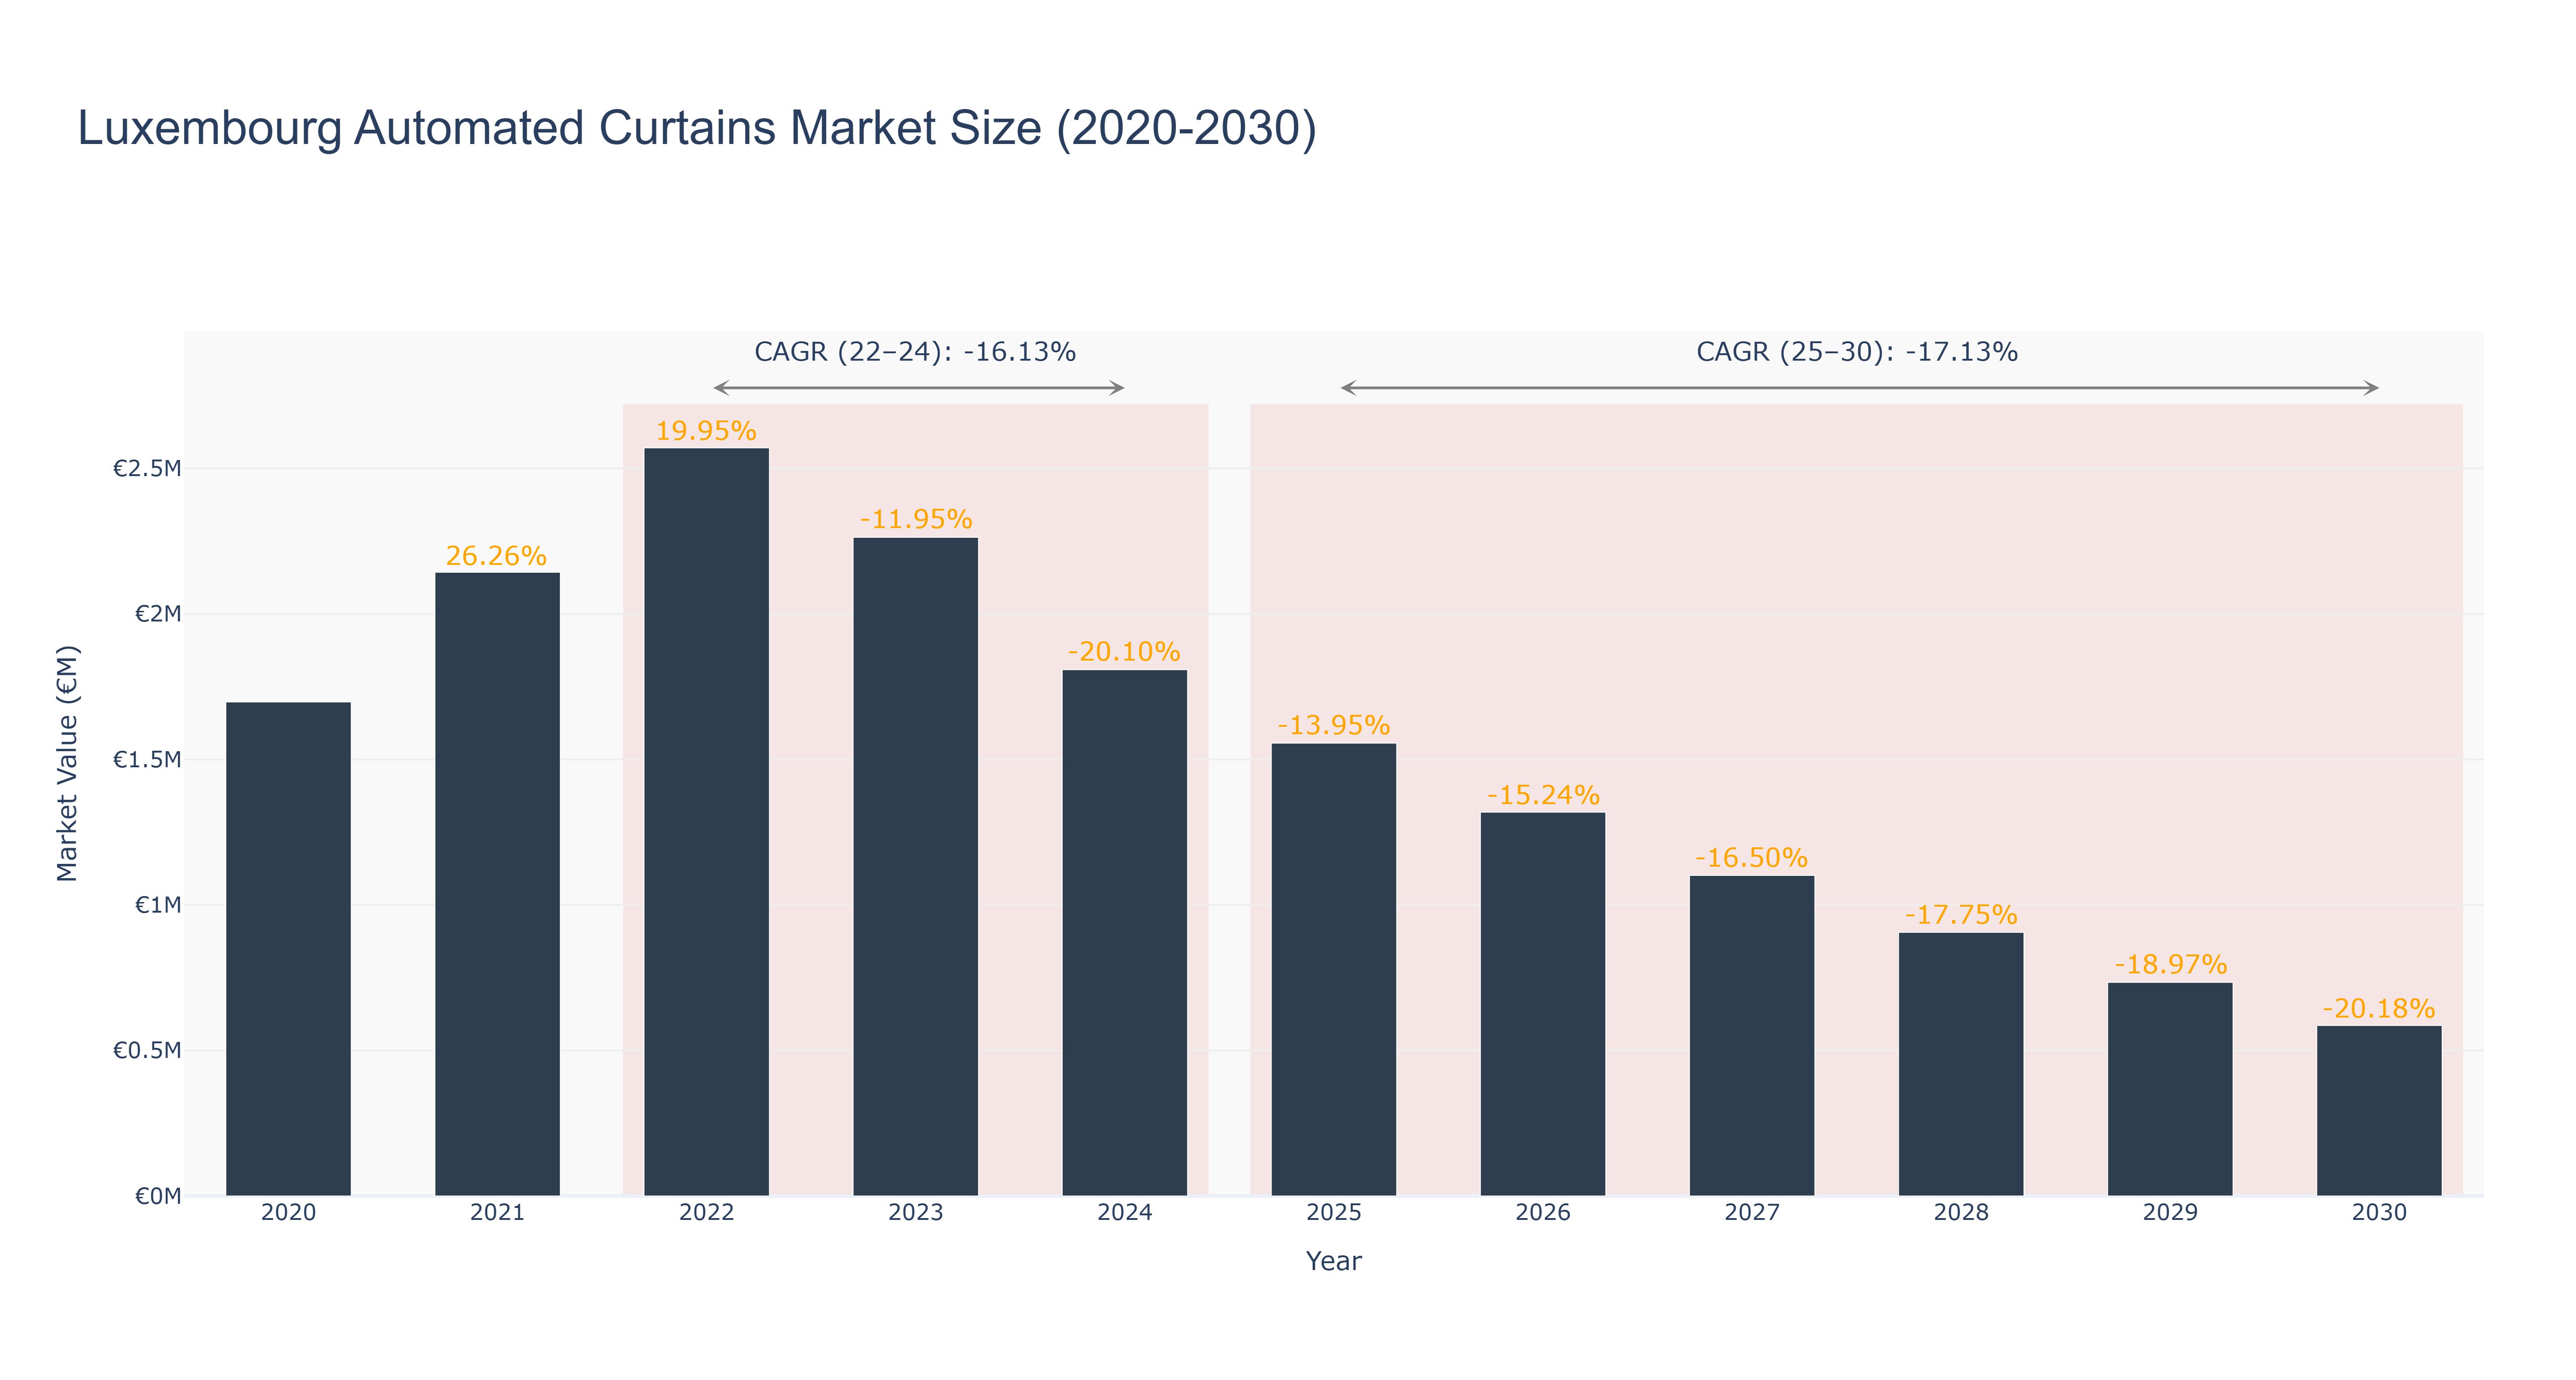
Luxembourg Automated Curtains Market has seen a decline in market size over the years, with a peak size of €2.57 million in 2022. The actual market size decreased to €1.81 million in 2024, showcasing a negative growth trend. Forecasted market size is expected to continue this downward trajectory, reaching €0.59 million by 2030. The CAGR values of -16.13% (2022-24) and -17.13% (2025-30) further emphasize the market's contraction. The decline can be attributed to evolving consumer preferences towards more cost-effective and sustainable alternatives, impacting the demand for automated curtains. Looking ahead, Luxembourg is set to invest in smart home technologies, potentially revitalizing the market with innovative solutions tailored to modern lifestyles. This shift aligns with the industry driver of technological advancements driving market evolution and consumer engagement.
Luxembourg Automated Curtains Market: Production & Trade Performance (2019-2025)
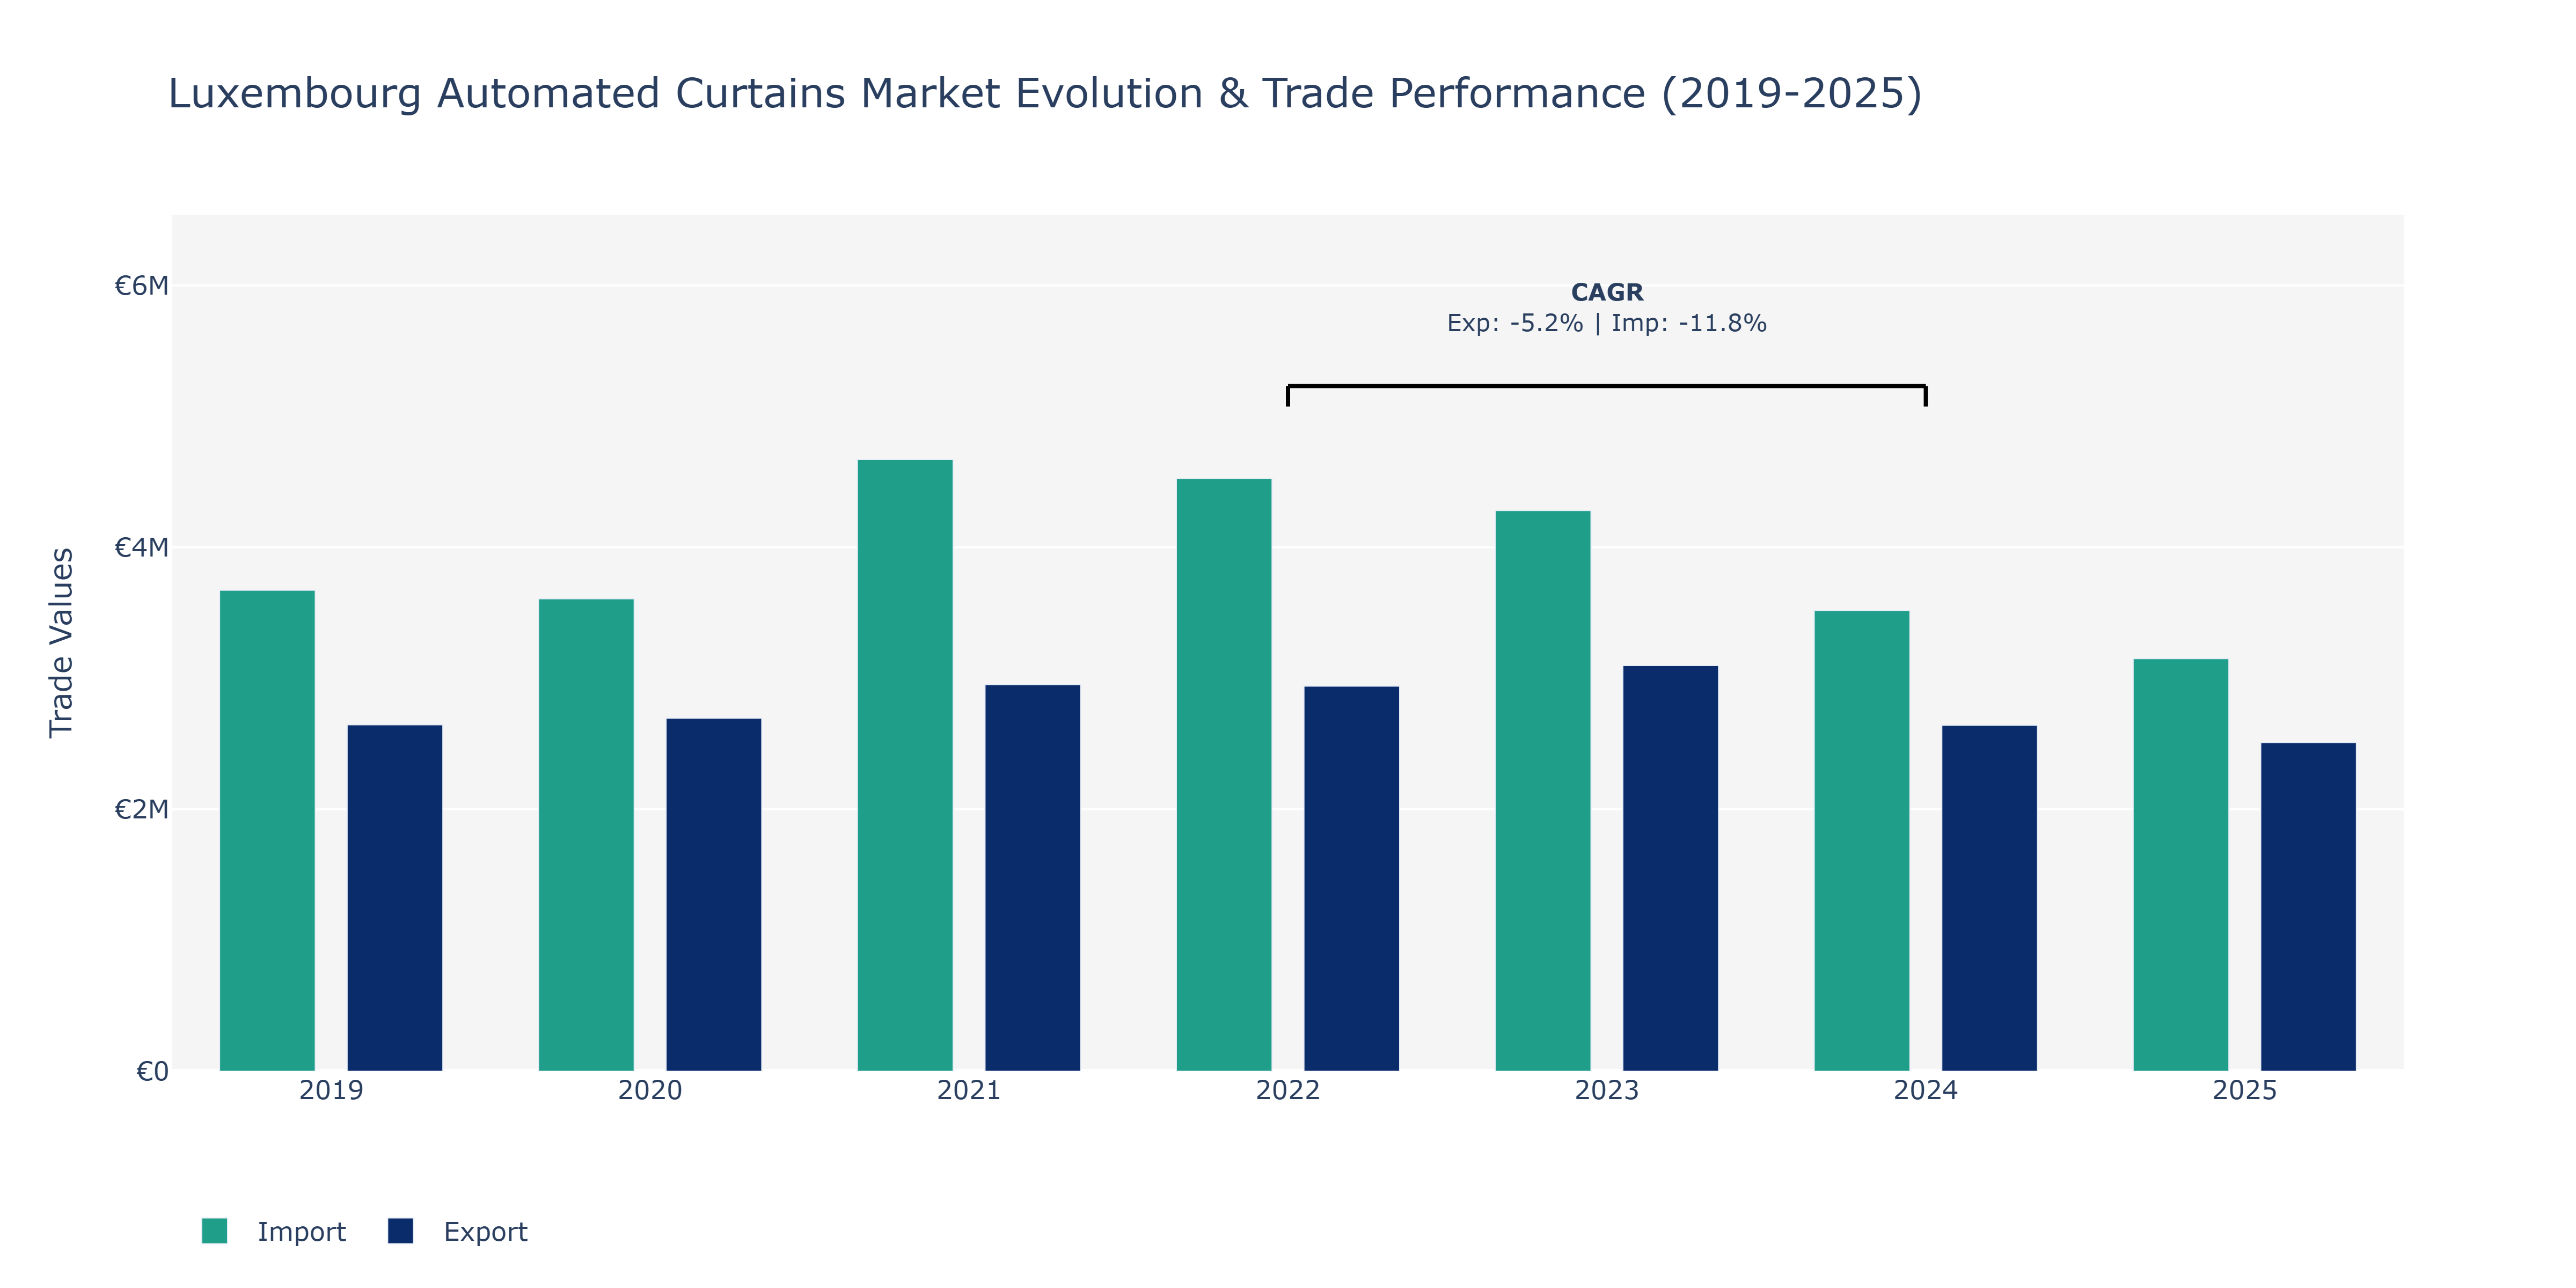
In the Luxembourg Automated Curtains Market, exports and imports showed varying trends over the years. In 2019, exports stood at €2.64 million, while imports were recorded at €3.67 million, indicating a trade deficit. The following year, both exports and imports experienced a slight decrease, with export revenues totaling €2.7 million and imports at €3.61 million. In 2021, there was a noticeable upturn in trade activity, with exports reaching €2.95 million and imports significantly rising to €4.67 million, marking a peak for imports. However, by 2024, both exports and imports declined, with exports falling to €2.64 million and imports decreasing to €3.52 million. The year 2025 saw a further decline in both metrics, with exports at €2.51 million and imports at €3.15 million. These fluctuations could be attributed to changing consumer preferences, economic conditions affecting purchasing power, and advancements in technology impacting trade flows within the automated curtains market in Luxembourg.
Key Highlights of the Report:
- Luxembourg Automated Curtains Market Outlook
- Market Size of Luxembourg Automated Curtains Market, 2025
- Forecast of Luxembourg Automated Curtains Market, 2032
- Historical Data and Forecast of Luxembourg Automated Curtains Revenues & Volume for the Period 2022-2032F
- Luxembourg Automated Curtains Market Trend Evolution
- Luxembourg Automated Curtains Market Drivers and Challenges
- Luxembourg Automated Curtains Price Trends
- Luxembourg Automated Curtains Porter's Five Forces
- Luxembourg Automated Curtains Industry Life Cycle
- Historical Data and Forecast of Luxembourg Automated Curtains Market Revenues & Volume By Product for the Period 2022-2032F
- Historical Data and Forecast of Luxembourg Automated Curtains Market Revenues & Volume By Ripplefold for the Period 2022-2032F
- Historical Data and Forecast of Luxembourg Automated Curtains Market Revenues & Volume By Pinch Pleat for the Period 2022-2032F
- Historical Data and Forecast of Luxembourg Automated Curtains Market Revenues & Volume By Application for the Period 2022-2032F
- Historical Data and Forecast of Luxembourg Automated Curtains Market Revenues & Volume By Residential for the Period 2022-2032F
- Historical Data and Forecast of Luxembourg Automated Curtains Market Revenues & Volume By Commercial for the Period 2022-2032F
- Luxembourg Automated Curtains Import Export Trade Statistics
- Market Opportunity Assessment By Product
- Market Opportunity Assessment By Application
- Luxembourg Automated Curtains Top Companies Market Share
- Luxembourg Automated Curtains Competitive Benchmarking By Technical and Operational Parameters
- Luxembourg Automated Curtains Company Profiles
- Luxembourg Automated Curtains Key Strategic Recommendations
Frequently Asked Questions About the Market Study (FAQs):
6Wresearch actively monitors the Luxembourg Automated Curtains Market and publishes its comprehensive annual report, highlighting emerging trends, growth drivers, revenue analysis, and forecast outlook. Our insights help businesses to make data-backed strategic decisions with ongoing market dynamics. Our analysts track relevent industries related to the Luxembourg Automated Curtains Market, allowing our clients with actionable intelligence and reliable forecasts tailored to emerging regional needs.
Yes, we provide customisation as per your requirements. To learn more, feel free to contact us on sales@6wresearch.com
1 Executive Summary |
2 Introduction |
2.1 Key Highlights of the Report |
2.2 Report Description |
2.3 Market Scope & Segmentation |
2.4 Research Methodology |
2.5 Assumptions |
3 Luxembourg Automated Curtains Market Overview |
3.1 Luxembourg Country Macro Economic Indicators |
3.2 Luxembourg Automated Curtains Market Revenues & Volume, 2022 & 2032F |
3.3 Luxembourg Automated Curtains Market - Industry Life Cycle |
3.4 Luxembourg Automated Curtains Market - Porter's Five Forces |
3.5 Luxembourg Automated Curtains Market Revenues & Volume Share, By Product, 2022 & 2032F |
3.6 Luxembourg Automated Curtains Market Revenues & Volume Share, By Application, 2022 & 2032F |
4 Luxembourg Automated Curtains Market Dynamics |
4.1 Impact Analysis |
4.2 Market Drivers |
4.2.1 Growing demand for smart home automation solutions |
4.2.2 Increasing focus on energy efficiency and sustainability |
4.2.3 Technological advancements in automated curtain systems |
4.3 Market Restraints |
4.3.1 High initial investment costs for automated curtain systems |
4.3.2 Limited awareness and adoption of automated curtain technology |
4.3.3 Dependence on stable internet connectivity for remote operation |
5 Luxembourg Automated Curtains Market Trends |
6 Luxembourg Automated Curtains Market, By Types |
6.1 Luxembourg Automated Curtains Market, By Product |
6.1.1 Overview and Analysis |
6.1.2 Luxembourg Automated Curtains Market Revenues & Volume, By Product, 2022-2032F |
6.1.3 Luxembourg Automated Curtains Market Revenues & Volume, By Ripplefold, 2022-2032F |
6.1.4 Luxembourg Automated Curtains Market Revenues & Volume, By Pinch Pleat, 2022-2032F |
6.2 Luxembourg Automated Curtains Market, By Application |
6.2.1 Overview and Analysis |
6.2.2 Luxembourg Automated Curtains Market Revenues & Volume, By Residential, 2022-2032F |
6.2.3 Luxembourg Automated Curtains Market Revenues & Volume, By Commercial, 2022-2032F |
7 Luxembourg Automated Curtains Market Import-Export Trade Statistics |
7.1 Luxembourg Automated Curtains Market Export to Major Countries |
7.2 Luxembourg Automated Curtains Market Imports from Major Countries |
8 Luxembourg Automated Curtains Market Key Performance Indicators |
8.1 Average installation time for automated curtain systems |
8.2 Percentage increase in smart home penetration rate in Luxembourg |
8.3 Number of new technological features introduced in automated curtain systems |
9 Luxembourg Automated Curtains Market - Opportunity Assessment |
9.1 Luxembourg Automated Curtains Market Opportunity Assessment, By Product, 2022 & 2032F |
9.2 Luxembourg Automated Curtains Market Opportunity Assessment, By Application, 2022 & 2032F |
10 Luxembourg Automated Curtains Market - Competitive Landscape |
10.1 Luxembourg Automated Curtains Market Revenue Share, By Companies, 2025 |
10.2 Luxembourg Automated Curtains Market Competitive Benchmarking, By Operating and Technical Parameters |
11 Company Profiles |
12 Recommendations |
13 Disclaimer |
Global Go To Market Strategy - 2030
Export potential enables firms to identify high-growth global markets with greater confidence by combining advanced trade intelligence with a structured quantitative methodology. The framework analyzes emerging demand trends and country-level import patterns while integrating macroeconomic and trade datasets such as GDP and population forecasts, bilateral import–export flows, tariff structures, elasticity differentials between developed and developing economies, geographic distance, and import demand projections. Using weighted trade values from 2020–2024 as the base period to project country-to-country export potential for 2030, these inputs are operationalized through calculated drivers such as gravity model parameters, tariff impact factors, and projected GDP per-capita growth. Through an analysis of hidden potentials, demand hotspots, and market conditions that are most favorable to success, this method enables firms to focus on target countries, maximize returns, and global expansion with data, backed by accuracy.
By factoring in the projected importer demand gap that is currently unmet and could be potential opportunity, it identifies the potential for the Exporter (Country) among 190 countries, against the general trade analysis, which identifies the biggest importer or exporter.
To discover high-growth global markets and optimize your business strategy:
Click Here
Pricing
- Single User License$ 1,995
- Department License$ 2,400
- Site License$ 3,120
- Global License$ 3,795

Leadership Perspectives from Industry Events
Search
Thought Leadership and Analyst Meet


Our Clients
6WResearch In News
- Doha a strategic location for EV manufacturing hub: IPA Qatar
- Demand for luxury TVs surging in the GCC, says Samsung
- Empowering Growth: The Thriving Journey of Bangladesh’s Cable Industry
- Demand for luxury TVs surging in the GCC, says Samsung
- Video call with a traditional healer? Once unthinkable, it’s now common in South Africa
- Intelligent Buildings To Smooth GCC’s Path To Net Zero
Latest Reports
- New Zealand Aseptic Manufacturing Market (2026-2032)
- Netherlands Aseptic Manufacturing Market (2026-2032)
- Nauru Aseptic Manufacturing Market (2026-2032)
- Namibia Aseptic Manufacturing Market (2026-2032)
- Mozambique Aseptic Manufacturing Market (2026-2032)
- Montenegro Aseptic Manufacturing Market (2026-2032)
- Mongolia Aseptic Manufacturing Market (2026-2032)
- Monaco Aseptic Manufacturing Market (2026-2032)
- Micronesia Aseptic Manufacturing Market (2026-2032)
- Mauritius Aseptic Manufacturing Market (2026-2032)
Industry Events and Analyst Meet

HIMTEX 2026

India Refining Summit 2026

India EV Show 2026

EV tech India Expo 2026

Auto Tech Asia 2026
Whitepaper
- Middle East & Africa Commercial Security Market Click here to view more.
- Middle East & Africa Fire Safety Systems & Equipment Market Click here to view more.
- GCC Drone Market Click here to view more.
- Middle East Lighting Fixture Market Click here to view more.
- GCC Physical & Perimeter Security Market Click here to view more.