Luxembourg Noble Gases Market (2026-2032) | Competition, Investment Trends, Segmentation, Analysis, Drivers, Restraints, Supply, Pricing Analysis, Forecast, Industry, Outlook, Opportunities, Strategic Insights, Challenges, Value, Strategy, Size, Growth, Competitive, Consumer Insights, Share, Companies, Segments, Revenue, Demand, Trends
Market Forecast By Type (Helium, Neon, Argon, Krypton), By Application (Cryogenics, Lighting, Welding, Insulation), By End User (Healthcare, Electronics, Metal Industry, Construction) And Competitive Landscape
| Product Code: ETC12753787 | Publication Date: Apr 2025 | Updated Date: Apr 2026 | Product Type: Market Research Report | |
| Publisher: 6Wresearch | Author: Sachin Kumar Rai | No. of Pages: 65 | No. of Figures: 34 | No. of Tables: 19 |
Luxembourg Noble Gases Market Size (2020-2030)
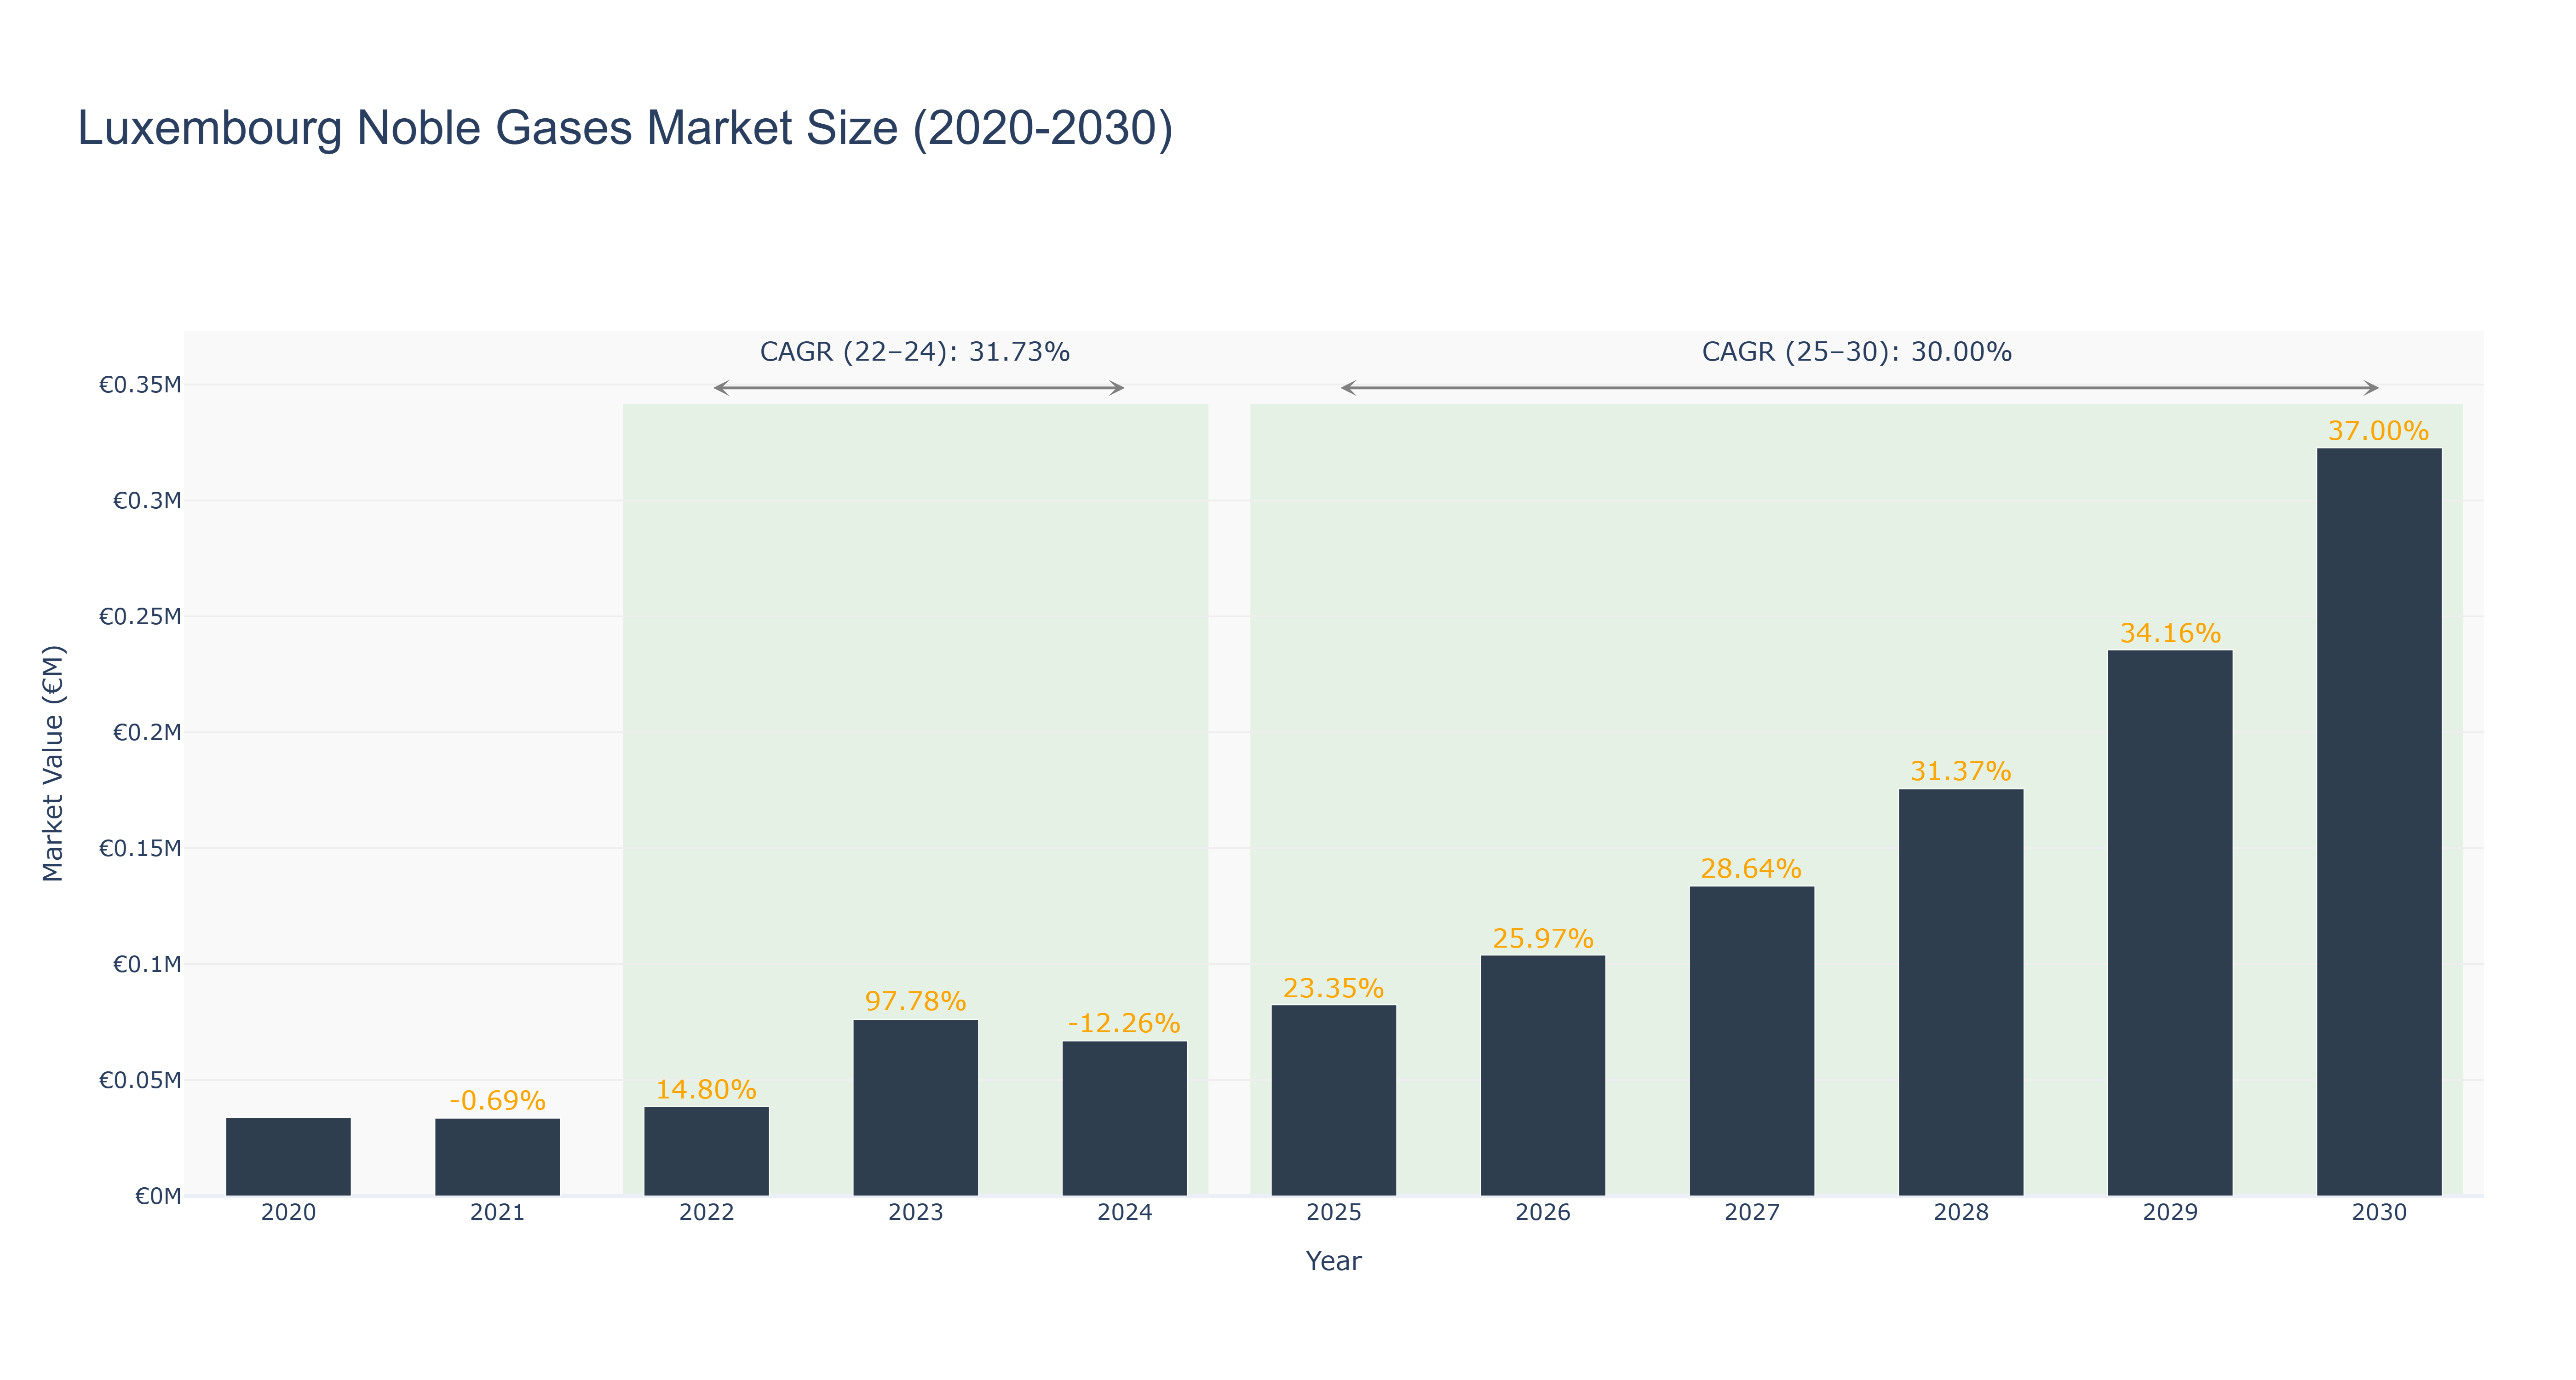
Luxembourg Noble Gases Market has shown a positive growth trend over the years. The peak market size of €0.32 million is forecasted for 2030, with steady growth from €0.03 million in 2020. The market experienced fluctuations, with a notable decline in 2024 followed by significant growth in subsequent years. The CAGR for 2022-24 is 31.73%, indicating a rapid expansion period, while the CAGR for 2025-30 is projected at 30.0%. Industry drivers such as technological advancements in gas applications and increasing demand for noble gases in various sectors have contributed to this upward trajectory. Looking ahead, upcoming projects in gas exploration and utilization are expected to further boost market growth in Luxembourg, positioning the noble gases market for continued success.
Luxembourg Noble Gases Market: Production & Trade Performance (2019-2025)
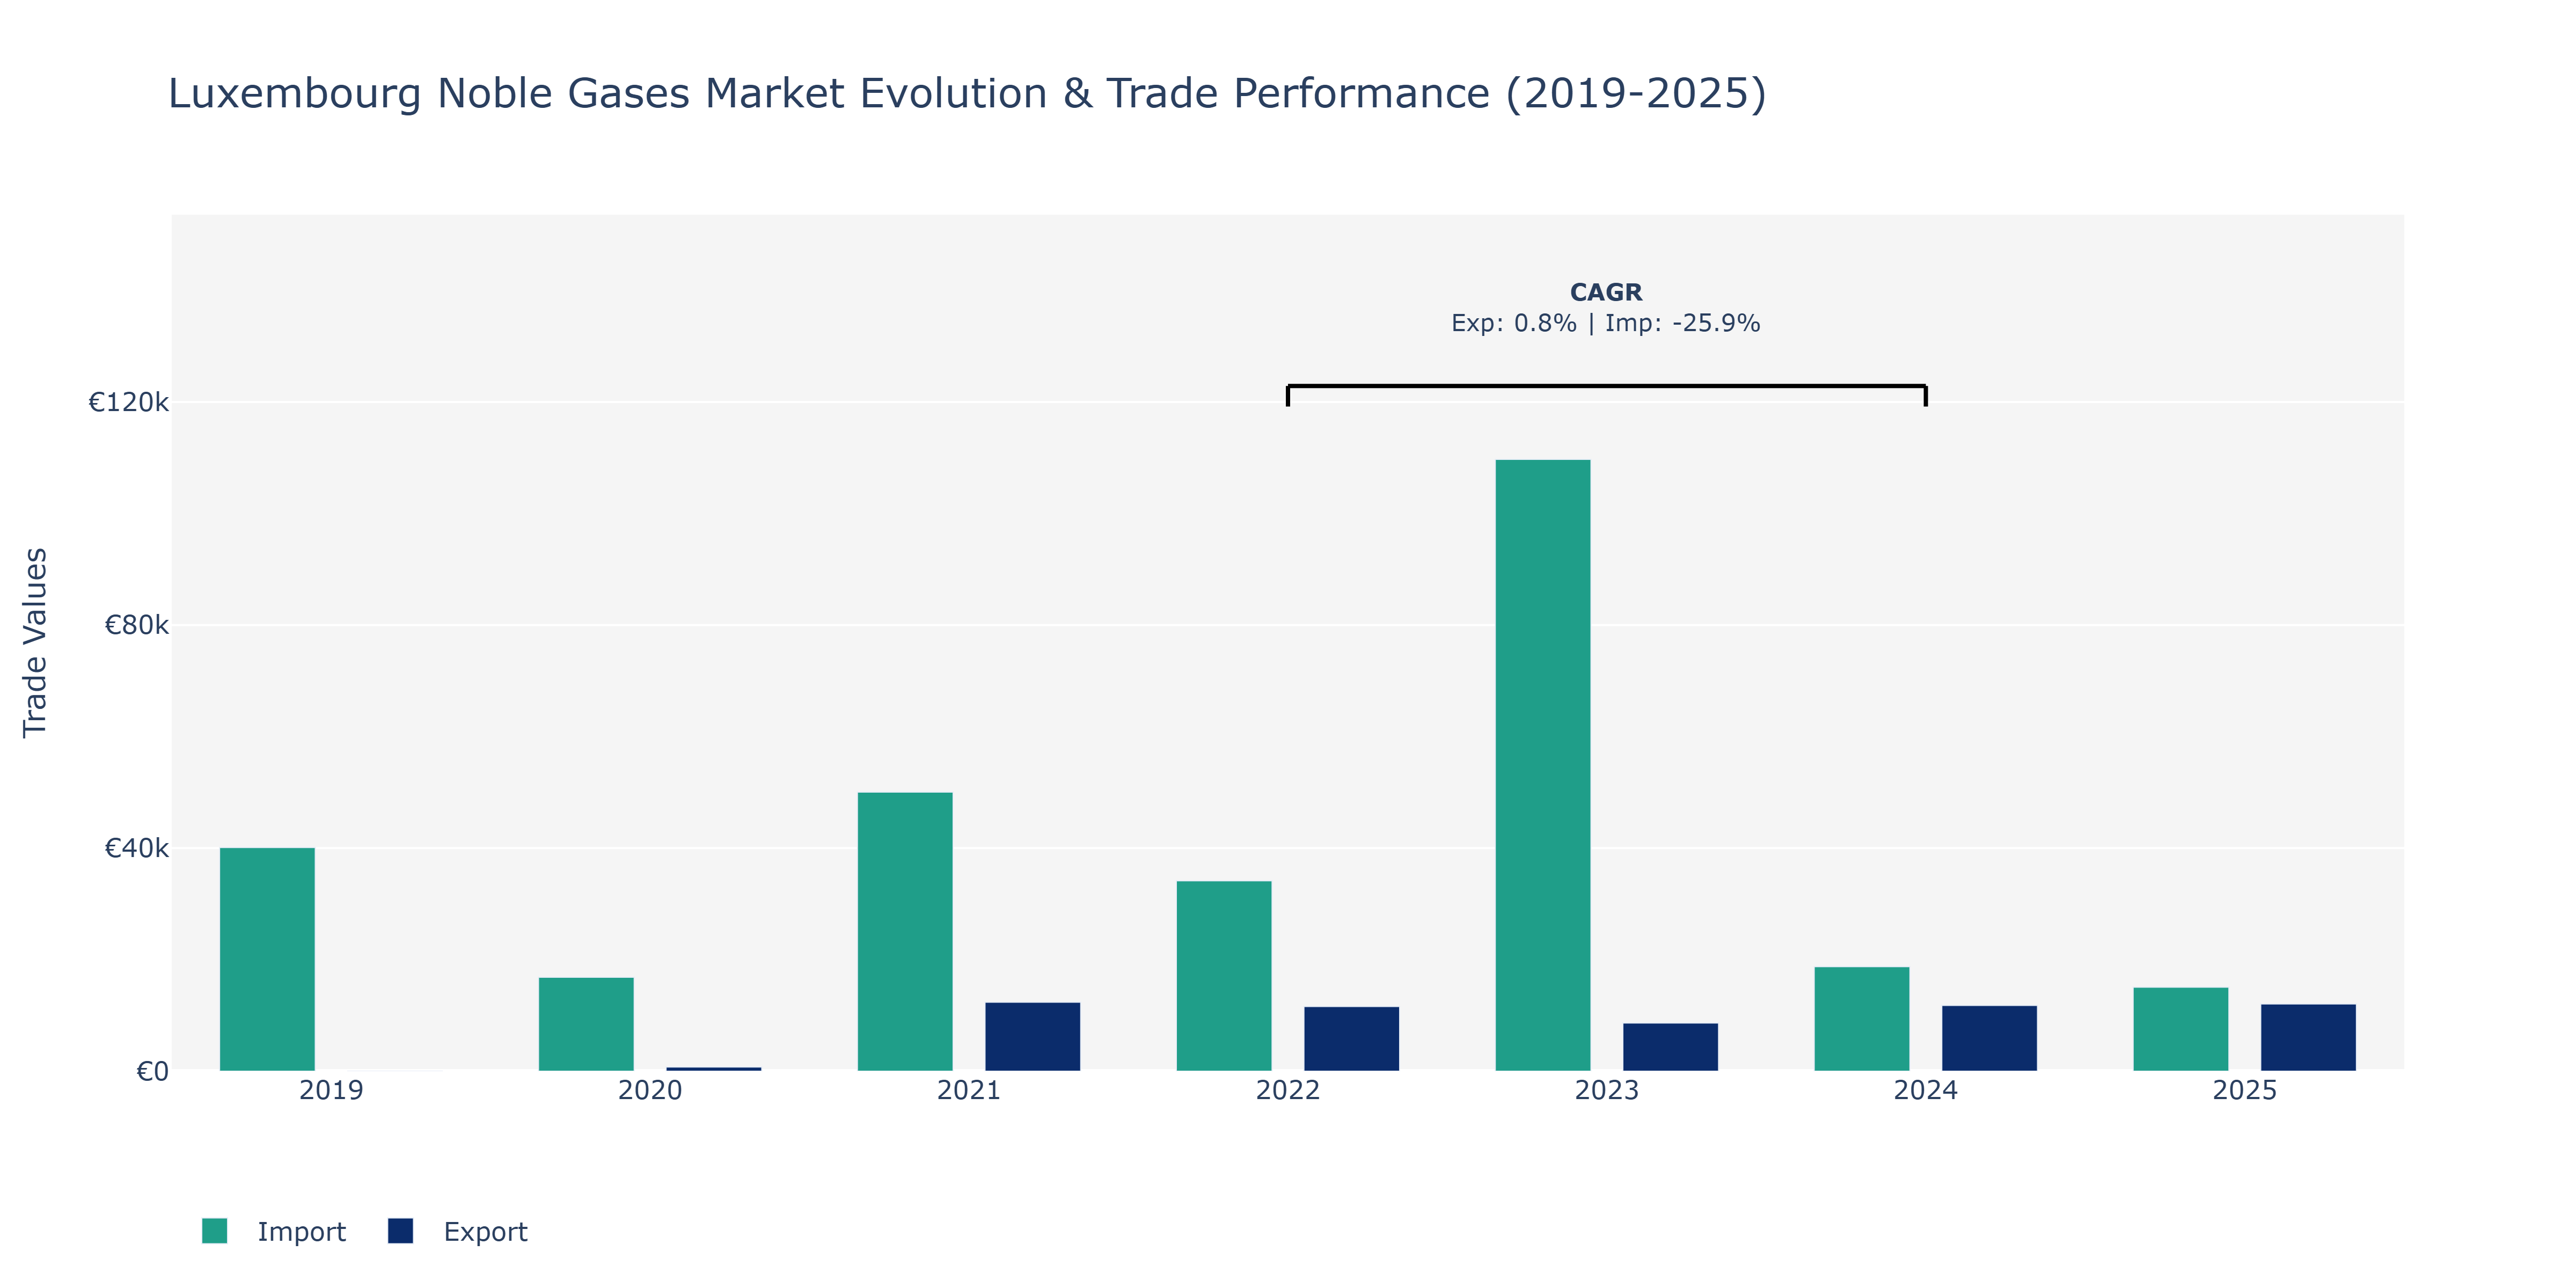
Between 2019 and 2025, Luxembourg's Noble Gases Market witnessed fluctuations in both Exports and Imports. Exports showed a mixed trend, with a peak in 2023 at €11.78 thousand, followed by a slight increase in 2025 to approximately €12.04 thousand. On the other hand, Imports fluctuated notably, reaching the highest value in 2023 at around €109.7 thousand, but then dropping to about €15.06 thousand in 2025. The significant increase in Imports in 2023 could be attributed to growing industrial demand for noble gases in various sectors, such as healthcare and electronics manufacturing. The subsequent drop in Imports in 2025 might be linked to shifts in global market dynamics impacting Luxembourg's trade partnerships or changes in domestic consumption patterns. These fluctuations highlight the market's sensitivity to external factors and the need for strategic planning to navigate such volatility effectively.
Key Highlights of the Report:
- Luxembourg Noble Gases Market Outlook
- Market Size of Luxembourg Noble Gases Market, 2025
- Forecast of Luxembourg Noble Gases Market, 2032
- Historical Data and Forecast of Luxembourg Noble Gases Revenues & Volume for the Period 2022-2032F
- Luxembourg Noble Gases Market Trend Evolution
- Luxembourg Noble Gases Market Drivers and Challenges
- Luxembourg Noble Gases Price Trends
- Luxembourg Noble Gases Porter's Five Forces
- Luxembourg Noble Gases Industry Life Cycle
- Historical Data and Forecast of Luxembourg Noble Gases Market Revenues & Volume By Type for the Period 2022-2032F
- Historical Data and Forecast of Luxembourg Noble Gases Market Revenues & Volume By Helium for the Period 2022-2032F
- Historical Data and Forecast of Luxembourg Noble Gases Market Revenues & Volume By Neon for the Period 2022-2032F
- Historical Data and Forecast of Luxembourg Noble Gases Market Revenues & Volume By Argon for the Period 2022-2032F
- Historical Data and Forecast of Luxembourg Noble Gases Market Revenues & Volume By Krypton for the Period 2022-2032F
- Historical Data and Forecast of Luxembourg Noble Gases Market Revenues & Volume By Application for the Period 2022-2032F
- Historical Data and Forecast of Luxembourg Noble Gases Market Revenues & Volume By Cryogenics for the Period 2022-2032F
- Historical Data and Forecast of Luxembourg Noble Gases Market Revenues & Volume By Lighting for the Period 2022-2032F
- Historical Data and Forecast of Luxembourg Noble Gases Market Revenues & Volume By Welding for the Period 2022-2032F
- Historical Data and Forecast of Luxembourg Noble Gases Market Revenues & Volume By Insulation for the Period 2022-2032F
- Historical Data and Forecast of Luxembourg Noble Gases Market Revenues & Volume By End User for the Period 2022-2032F
- Historical Data and Forecast of Luxembourg Noble Gases Market Revenues & Volume By Healthcare for the Period 2022-2032F
- Historical Data and Forecast of Luxembourg Noble Gases Market Revenues & Volume By Electronics for the Period 2022-2032F
- Historical Data and Forecast of Luxembourg Noble Gases Market Revenues & Volume By Metal Industry for the Period 2022-2032F
- Historical Data and Forecast of Luxembourg Noble Gases Market Revenues & Volume By Construction for the Period 2022-2032F
- Luxembourg Noble Gases Import Export Trade Statistics
- Market Opportunity Assessment By Type
- Market Opportunity Assessment By Application
- Market Opportunity Assessment By End User
- Luxembourg Noble Gases Top Companies Market Share
- Luxembourg Noble Gases Competitive Benchmarking By Technical and Operational Parameters
- Luxembourg Noble Gases Company Profiles
- Luxembourg Noble Gases Key Strategic Recommendations
Frequently Asked Questions About the Market Study (FAQs):
6Wresearch actively monitors the Luxembourg Noble Gases Market and publishes its comprehensive annual report, highlighting emerging trends, growth drivers, revenue analysis, and forecast outlook. Our insights help businesses to make data-backed strategic decisions with ongoing market dynamics. Our analysts track relevent industries related to the Luxembourg Noble Gases Market, allowing our clients with actionable intelligence and reliable forecasts tailored to emerging regional needs.
Yes, we provide customisation as per your requirements. To learn more, feel free to contact us on sales@6wresearch.com
1 Executive Summary |
2 Introduction |
2.1 Key Highlights of the Report |
2.2 Report Description |
2.3 Market Scope & Segmentation |
2.4 Research Methodology |
2.5 Assumptions |
3 Luxembourg Noble Gases Market Overview |
3.1 Luxembourg Country Macro Economic Indicators |
3.2 Luxembourg Noble Gases Market Revenues & Volume, 2022 & 2032F |
3.3 Luxembourg Noble Gases Market - Industry Life Cycle |
3.4 Luxembourg Noble Gases Market - Porter's Five Forces |
3.5 Luxembourg Noble Gases Market Revenues & Volume Share, By Type, 2022 & 2032F |
3.6 Luxembourg Noble Gases Market Revenues & Volume Share, By Application, 2022 & 2032F |
3.7 Luxembourg Noble Gases Market Revenues & Volume Share, By End User, 2022 & 2032F |
4 Luxembourg Noble Gases Market Dynamics |
4.1 Impact Analysis |
4.2 Market Drivers |
4.2.1 Growing demand for noble gases in the semiconductor industry for various applications such as etching, sputtering, and lithography. |
4.2.2 Increasing usage of noble gases in healthcare for medical imaging and radiation therapy. |
4.2.3 Rising adoption of noble gases in the lighting industry for producing energy-efficient lighting solutions. |
4.3 Market Restraints |
4.3.1 High costs associated with the production and purification of noble gases. |
4.3.2 Limited availability of noble gases due to their extraction from the air separation process and low natural abundance. |
5 Luxembourg Noble Gases Market Trends |
6 Luxembourg Noble Gases Market, By Types |
6.1 Luxembourg Noble Gases Market, By Type |
6.1.1 Overview and Analysis |
6.1.2 Luxembourg Noble Gases Market Revenues & Volume, By Type, 2022 - 2032F |
6.1.3 Luxembourg Noble Gases Market Revenues & Volume, By Helium, 2022 - 2032F |
6.1.4 Luxembourg Noble Gases Market Revenues & Volume, By Neon, 2022 - 2032F |
6.1.5 Luxembourg Noble Gases Market Revenues & Volume, By Argon, 2022 - 2032F |
6.1.6 Luxembourg Noble Gases Market Revenues & Volume, By Krypton, 2022 - 2032F |
6.2 Luxembourg Noble Gases Market, By Application |
6.2.1 Overview and Analysis |
6.2.2 Luxembourg Noble Gases Market Revenues & Volume, By Cryogenics, 2022 - 2032F |
6.2.3 Luxembourg Noble Gases Market Revenues & Volume, By Lighting, 2022 - 2032F |
6.2.4 Luxembourg Noble Gases Market Revenues & Volume, By Welding, 2022 - 2032F |
6.2.5 Luxembourg Noble Gases Market Revenues & Volume, By Insulation, 2022 - 2032F |
6.3 Luxembourg Noble Gases Market, By End User |
6.3.1 Overview and Analysis |
6.3.2 Luxembourg Noble Gases Market Revenues & Volume, By Healthcare, 2022 - 2032F |
6.3.3 Luxembourg Noble Gases Market Revenues & Volume, By Electronics, 2022 - 2032F |
6.3.4 Luxembourg Noble Gases Market Revenues & Volume, By Metal Industry, 2022 - 2032F |
6.3.5 Luxembourg Noble Gases Market Revenues & Volume, By Construction, 2022 - 2032F |
7 Luxembourg Noble Gases Market Import-Export Trade Statistics |
7.1 Luxembourg Noble Gases Market Export to Major Countries |
7.2 Luxembourg Noble Gases Market Imports from Major Countries |
8 Luxembourg Noble Gases Market Key Performance Indicators |
8.1 Average selling price of noble gases in Luxembourg. |
8.2 Number of new applications or industries adopting noble gases. |
8.3 Investment in research and development for the advancement of noble gas technologies in Luxembourg. |
9 Luxembourg Noble Gases Market - Opportunity Assessment |
9.1 Luxembourg Noble Gases Market Opportunity Assessment, By Type, 2022 & 2032F |
9.2 Luxembourg Noble Gases Market Opportunity Assessment, By Application, 2022 & 2032F |
9.3 Luxembourg Noble Gases Market Opportunity Assessment, By End User, 2022 & 2032F |
10 Luxembourg Noble Gases Market - Competitive Landscape |
10.1 Luxembourg Noble Gases Market Revenue Share, By Companies, 2025 |
10.2 Luxembourg Noble Gases Market Competitive Benchmarking, By Operating and Technical Parameters |
11 Company Profiles |
12 Recommendations |
13 Disclaimer |
Export potential assessment - trade Analytics for 2030
Export potential enables firms to identify high-growth global markets with greater confidence by combining advanced trade intelligence with a structured quantitative methodology. The framework analyzes emerging demand trends and country-level import patterns while integrating macroeconomic and trade datasets such as GDP and population forecasts, bilateral import–export flows, tariff structures, elasticity differentials between developed and developing economies, geographic distance, and import demand projections. Using weighted trade values from 2020–2024 as the base period to project country-to-country export potential for 2030, these inputs are operationalized through calculated drivers such as gravity model parameters, tariff impact factors, and projected GDP per-capita growth. Through an analysis of hidden potentials, demand hotspots, and market conditions that are most favorable to success, this method enables firms to focus on target countries, maximize returns, and global expansion with data, backed by accuracy.
By factoring in the projected importer demand gap that is currently unmet and could be potential opportunity, it identifies the potential for the Exporter (Country) among 190 countries, against the general trade analysis, which identifies the biggest importer or exporter.
To discover high-growth global markets and optimize your business strategy:
Click Here
Pricing
- Single User License$ 1,995
- Department License$ 2,400
- Site License$ 3,120
- Global License$ 3,795

Thought Leadership
Search
Thought Leadership and Analyst Meet


Our Clients
Latest Reports
- New Zealand Aseptic Manufacturing Market (2026-2032)
- Netherlands Aseptic Manufacturing Market (2026-2032)
- Nauru Aseptic Manufacturing Market (2026-2032)
- Namibia Aseptic Manufacturing Market (2026-2032)
- Mozambique Aseptic Manufacturing Market (2026-2032)
- Montenegro Aseptic Manufacturing Market (2026-2032)
- Mongolia Aseptic Manufacturing Market (2026-2032)
- Monaco Aseptic Manufacturing Market (2026-2032)
- Micronesia Aseptic Manufacturing Market (2026-2032)
- Mauritius Aseptic Manufacturing Market (2026-2032)
Industry Events and Analyst Meet

HIMTEX 2026

India Refining Summit 2026

India EV Show 2026

EV tech India Expo 2026

Auto Tech Asia 2026
Whitepaper
- Middle East & Africa Commercial Security Market Click here to view more.
- Middle East & Africa Fire Safety Systems & Equipment Market Click here to view more.
- GCC Drone Market Click here to view more.
- Middle East Lighting Fixture Market Click here to view more.
- GCC Physical & Perimeter Security Market Click here to view more.
6WResearch In News
- Doha a strategic location for EV manufacturing hub: IPA Qatar
- Demand for luxury TVs surging in the GCC, says Samsung
- Empowering Growth: The Thriving Journey of Bangladesh’s Cable Industry
- Demand for luxury TVs surging in the GCC, says Samsung
- Video call with a traditional healer? Once unthinkable, it’s now common in South Africa
- Intelligent Buildings To Smooth GCC’s Path To Net Zero