Luxembourg Prisms Market (2026-2032) | Revenue, Analysis, Forecast, Value, Share, Segmentation, Industry, Size, Trends, Companies, Outlook & Growth
Market Forecast By Product (Dispersion Prisms, Deviation Prisms, Rotation Prisms, Displacement Prisms), By Application (Microscope, Lens, Telescope, Others) And Competitive Landscape
| Product Code: ETC4957369 | Publication Date: Nov 2023 | Updated Date: Apr 2026 | Product Type: Market Research Report | |
| Publisher: 6Wresearch | Author: Shubham Padhi | No. of Pages: 60 | No. of Figures: 30 | No. of Tables: 5 |
Luxembourg Prisms Market Size (2020-2030)
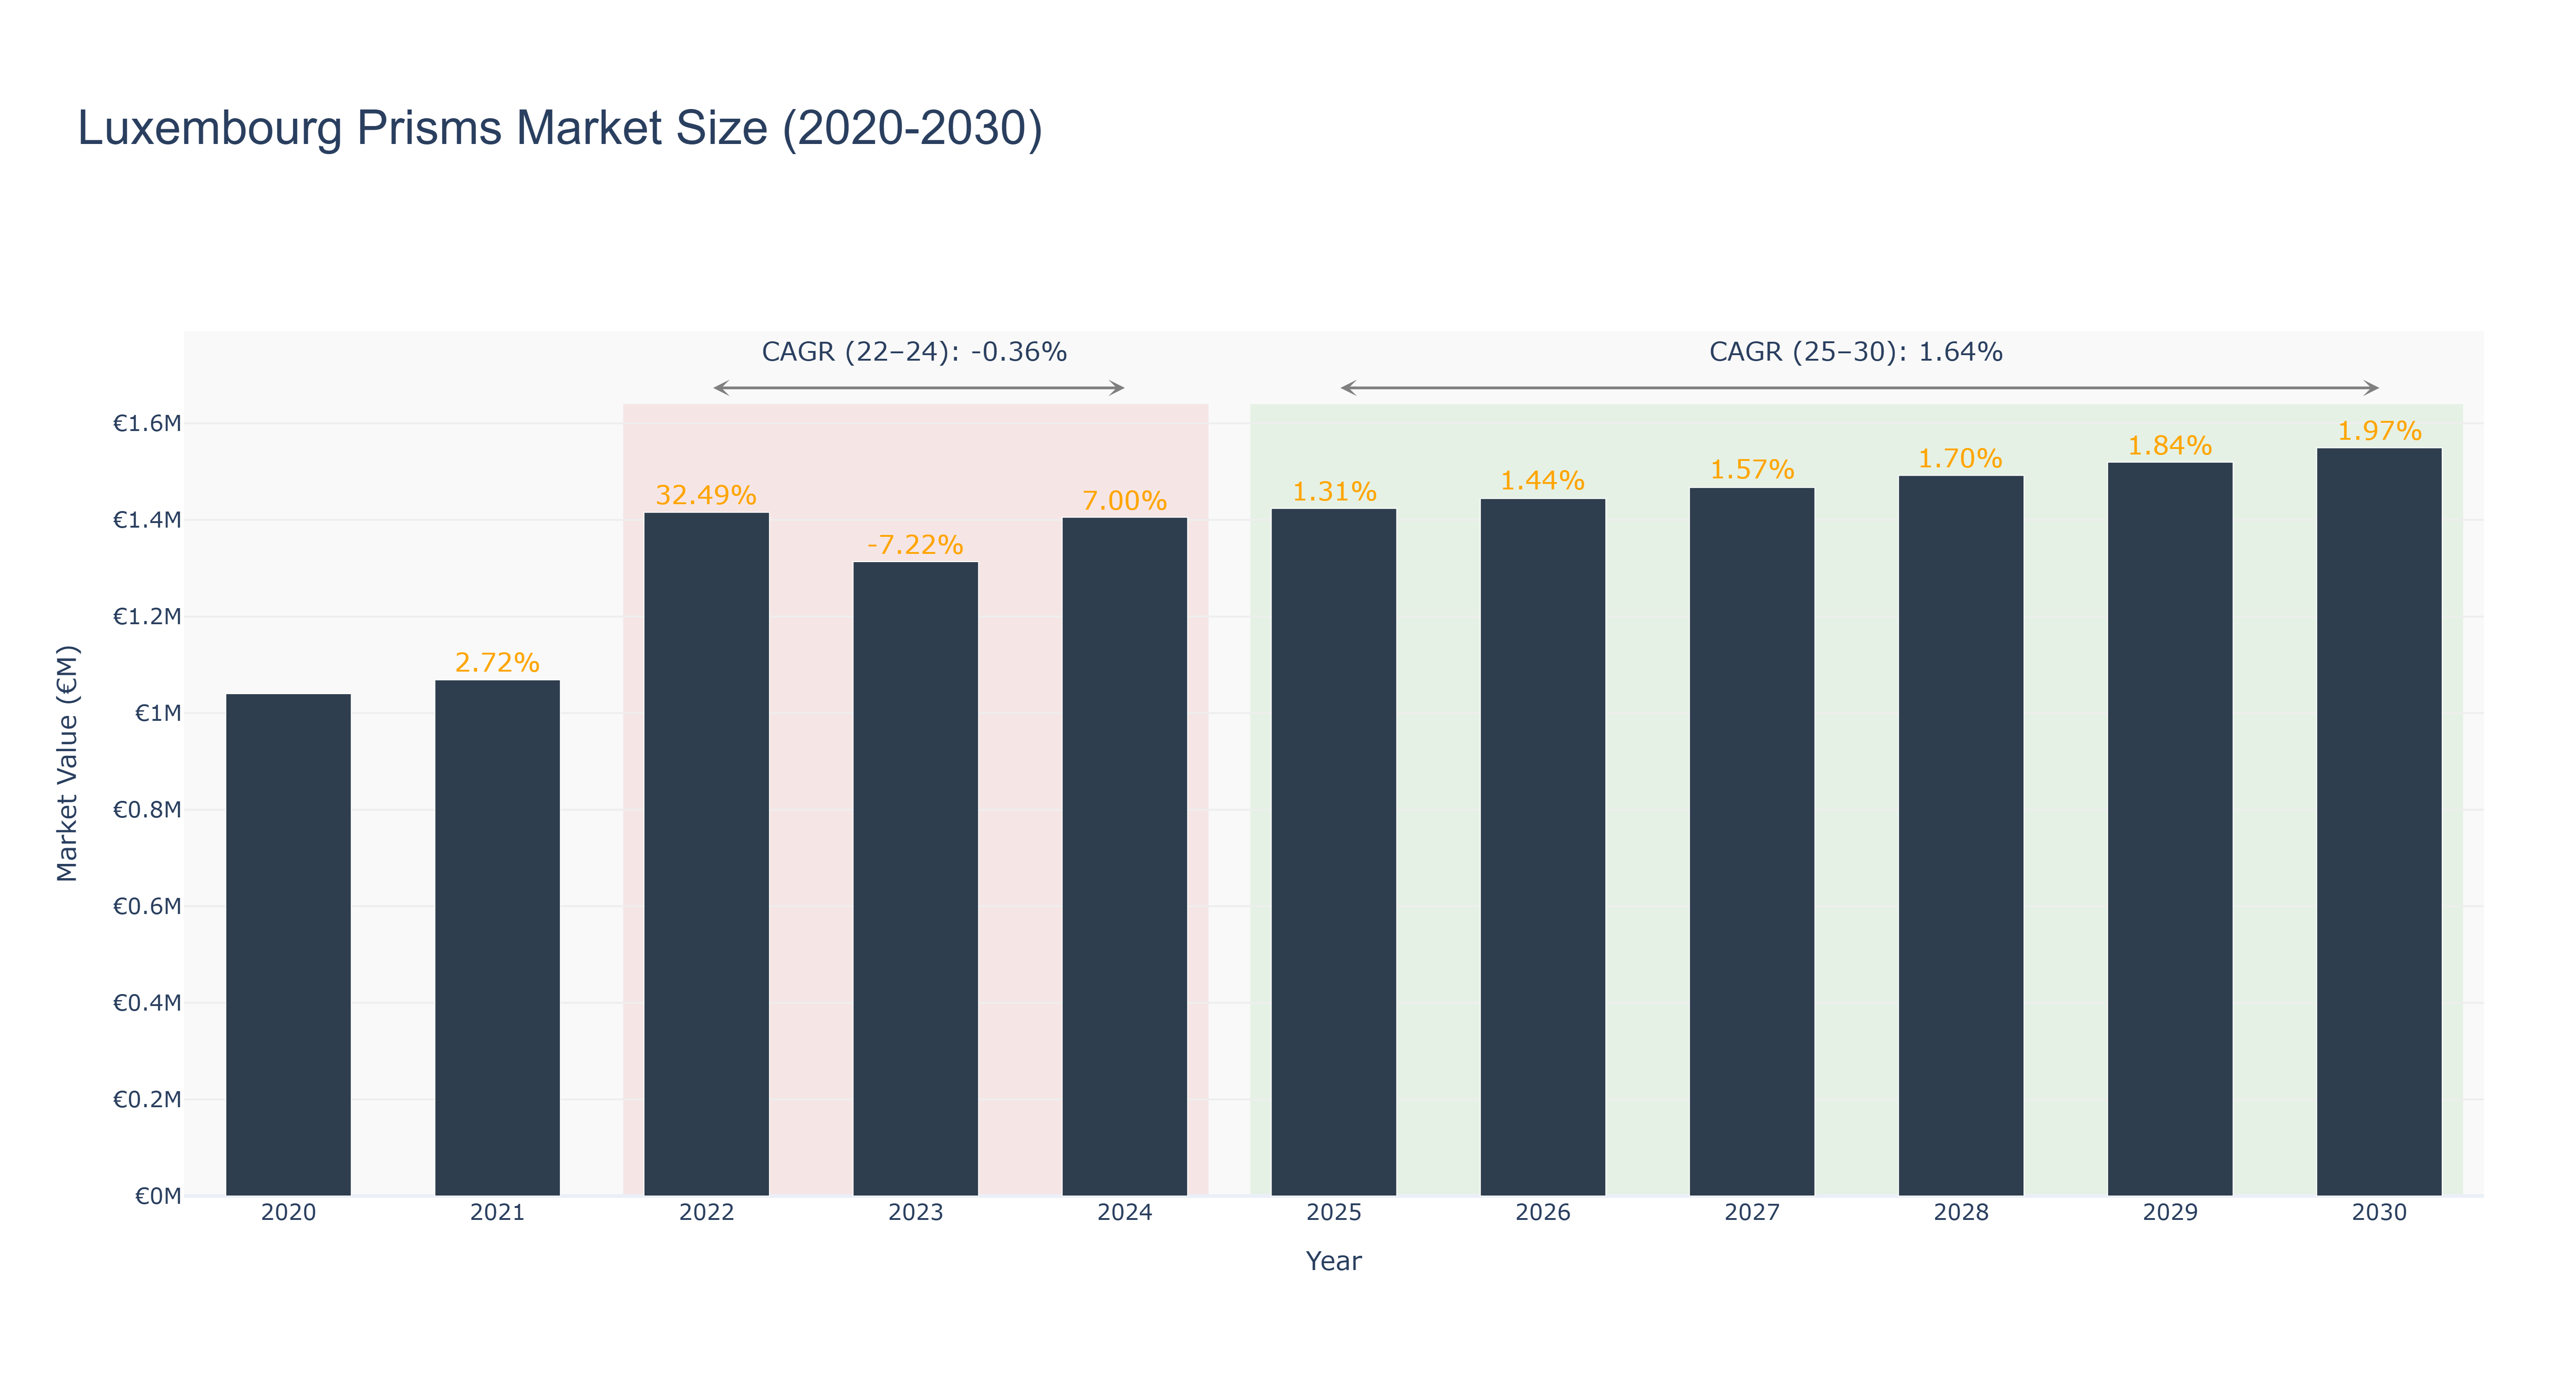
Luxembourg Prisms Market has shown a fluctuating trend over the years. The market peaked at €1.42 million in 2022, experiencing a decline to €1.31 million in 2023, followed by a recovery to €1.41 million in 2024. The forecasted market size is expected to grow steadily from €1.42 million in 2025 to €1.55 million in 2030, with a CAGR of -0.36% from 2022 to 2024 and a CAGR of 1.64% from 2025 to 2030. The market faced challenges in 2023 due to economic uncertainties, but rebounded in 2024 driven by increased demand. Looking ahead, the Luxembourg Prisms Market is poised for growth with advancements in optical technology and expanding applications in various industries. Future developments include collaborations with research institutions to enhance product innovation and meet evolving market demands.
Luxembourg Prisms Market: Production & Trade Performance (2019-2025)
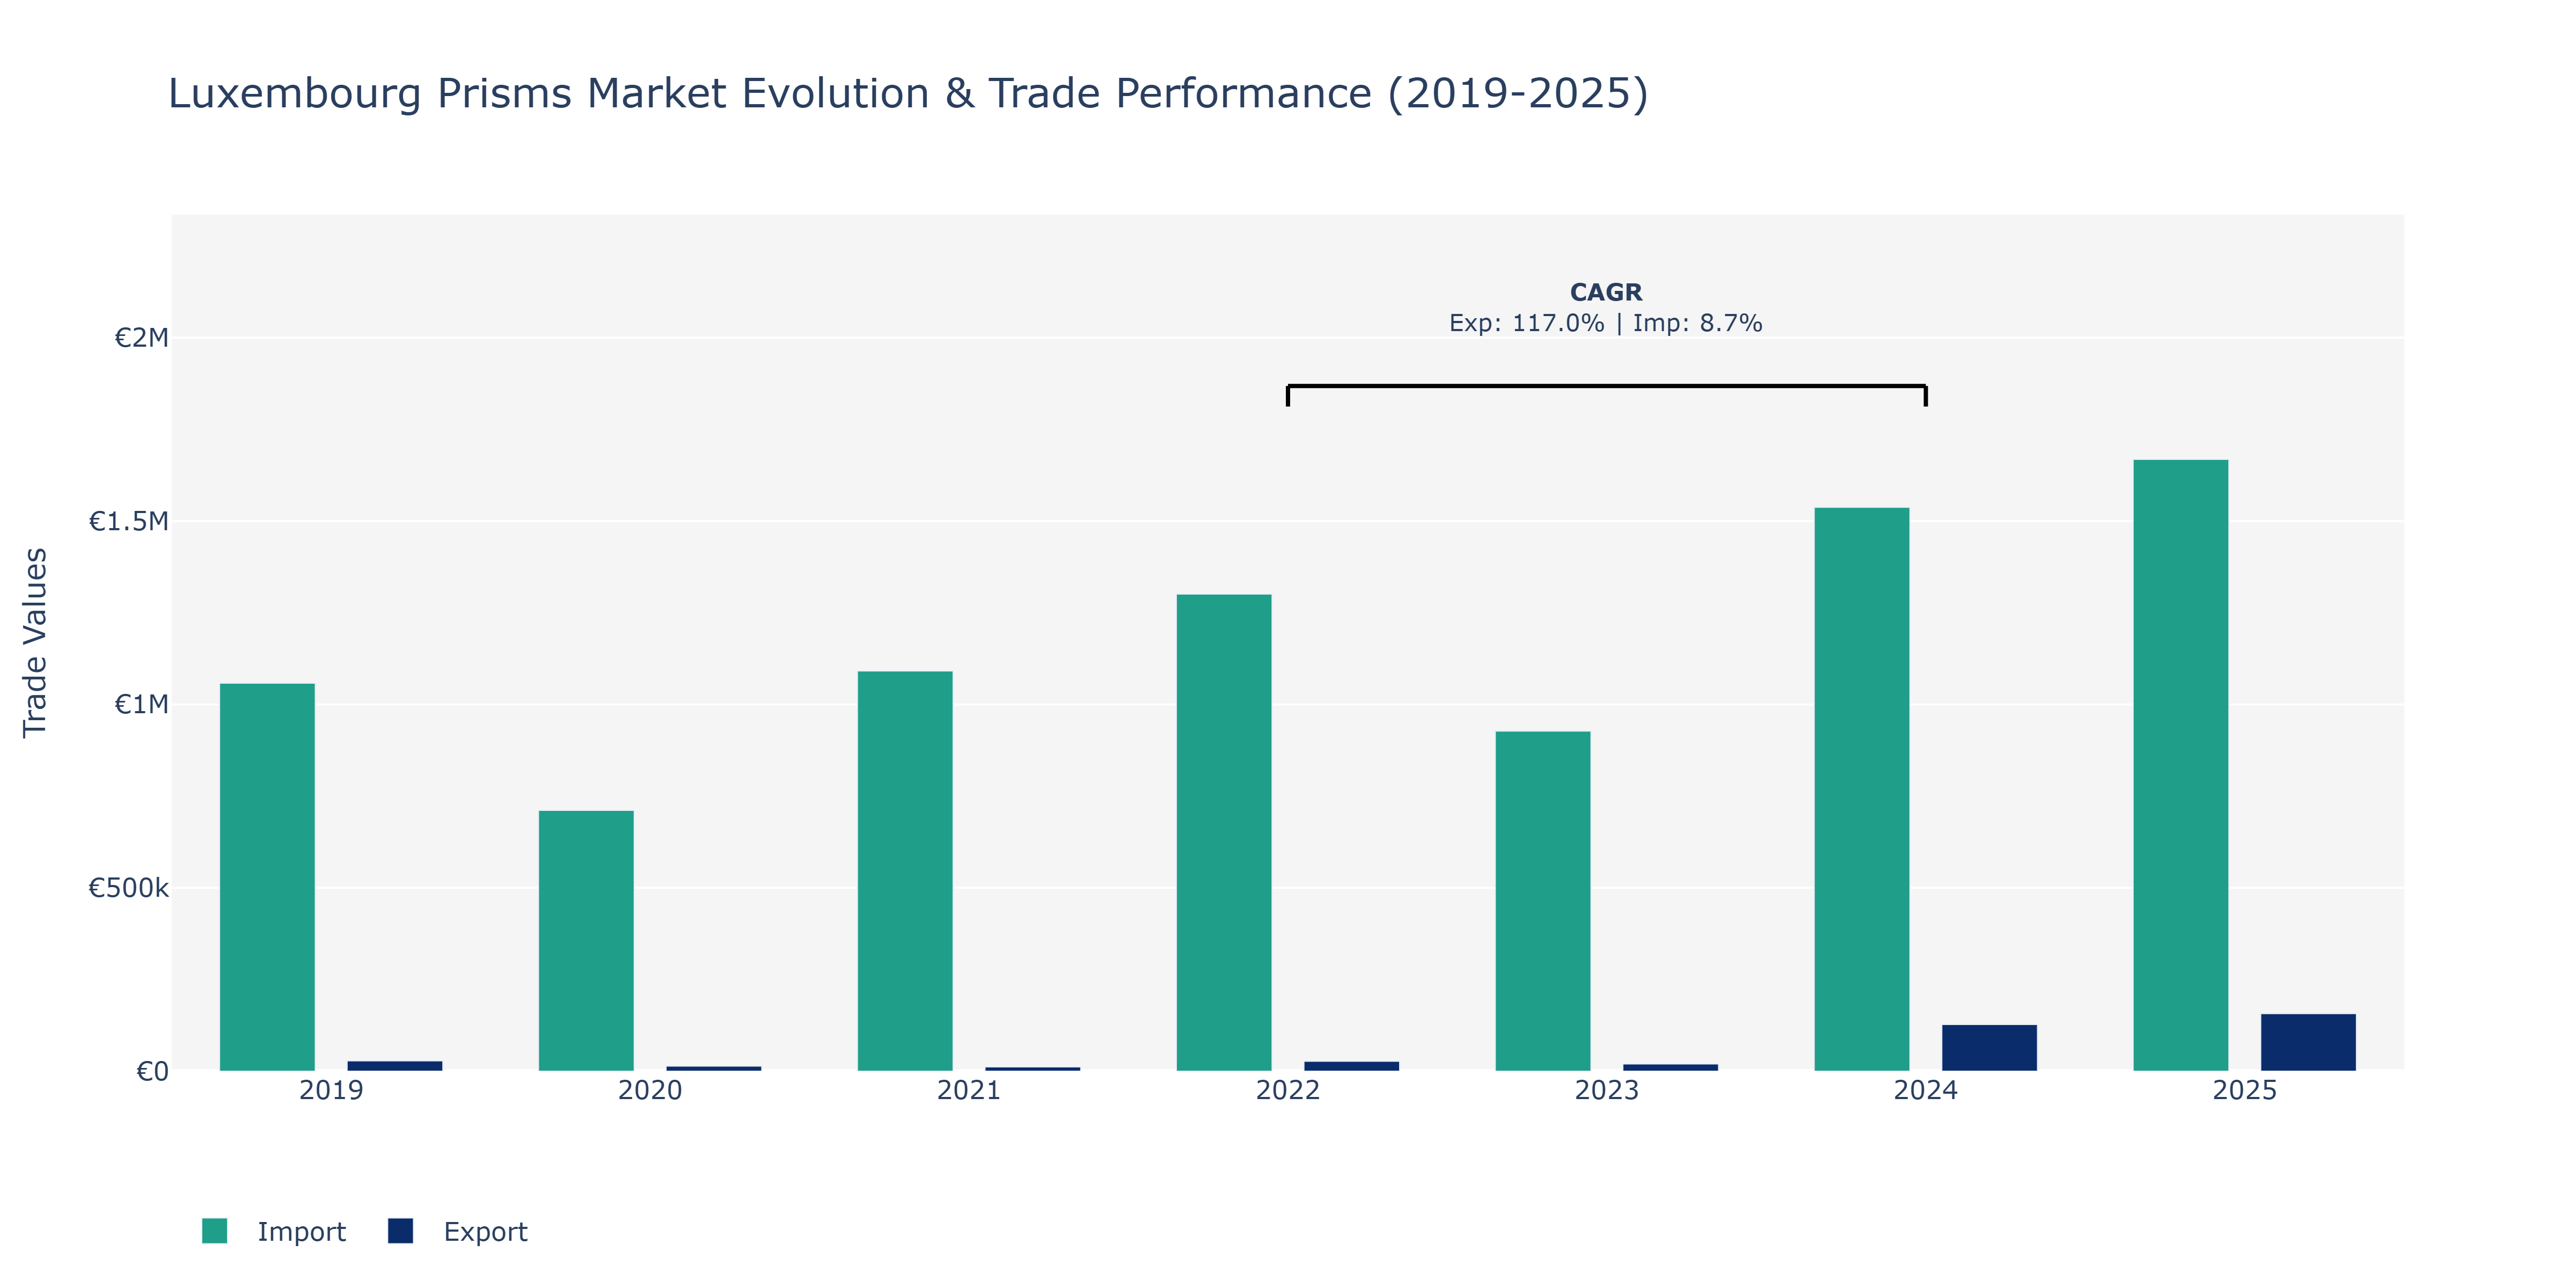
Between 2019 and 2025, Luxembourg's Prisms Market witnessed notable fluctuations in both exports and imports. In 2019, exports were €28.32 thousand, dropping to €13.88 thousand in 2020 before rebounding slightly in 2021 to €11.7 thousand. The peak export value of €157.07 thousand was recorded in 2025. Imports followed a similar trend, with a significant decline from €1.06 million in 2019 to €711.22 thousand in 2020, reaching a peak of €1.66 million in 2025. The surge in exports in 2025 can be attributed to increased global demand for Luxembourg's prisms, possibly due to advancements in technology requiring such optical components. On the other hand, the rise in imports can indicate a growing need for raw materials or specialized prisms not readily available domestically, leading to increased imports to meet local manufacturing requirements. These trends highlight the market's responsiveness to technological shifts and international trade dynamics.
Key Highlights of the Report:
- Luxembourg Prisms Market Outlook
- Market Size of Luxembourg Prisms Market, 2025
- Forecast of Luxembourg Prisms Market, 2032
- Historical Data and Forecast of Luxembourg Prisms Revenues & Volume for the Period 2022-2032F
- Luxembourg Prisms Market Trend Evolution
- Luxembourg Prisms Market Drivers and Challenges
- Luxembourg Prisms Price Trends
- Luxembourg Prisms Porter`s Five Forces
- Luxembourg Prisms Industry Life Cycle
- Historical Data and Forecast of Luxembourg Prisms Market Revenues & Volume By Product for the Period 2022-2032F
- Historical Data and Forecast of Luxembourg Prisms Market Revenues & Volume By Dispersion Prisms for the Period 2022-2032F
- Historical Data and Forecast of Luxembourg Prisms Market Revenues & Volume By Deviation Prisms for the Period 2022-2032F
- Historical Data and Forecast of Luxembourg Prisms Market Revenues & Volume By Rotation Prisms for the Period 2022-2032F
- Historical Data and Forecast of Luxembourg Prisms Market Revenues & Volume By Displacement Prisms for the Period 2022-2032F
- Historical Data and Forecast of Luxembourg Prisms Market Revenues & Volume By Application for the Period 2022-2032F
- Historical Data and Forecast of Luxembourg Prisms Market Revenues & Volume By Microscope for the Period 2022-2032F
- Historical Data and Forecast of Luxembourg Prisms Market Revenues & Volume By Lens for the Period 2022-2032F
- Historical Data and Forecast of Luxembourg Prisms Market Revenues & Volume By Telescope for the Period 2022-2032F
- Historical Data and Forecast of Luxembourg Prisms Market Revenues & Volume By Others for the Period 2022-2032F
- Luxembourg Prisms Import Export Trade Statistics
- Market Opportunity Assessment By Product
- Market Opportunity Assessment By Application
- Luxembourg Prisms Top Companies Market Share
- Luxembourg Prisms Competitive Benchmarking By Technical and Operational Parameters
- Luxembourg Prisms Company Profiles
- Luxembourg Prisms Key Strategic Recommendations
Frequently Asked Questions About the Market Study (FAQs):
6Wresearch actively monitors the Luxembourg Prisms Market and publishes its comprehensive annual report, highlighting emerging trends, growth drivers, revenue analysis, and forecast outlook. Our insights help businesses to make data-backed strategic decisions with ongoing market dynamics. Our analysts track relevent industries related to the Luxembourg Prisms Market, allowing our clients with actionable intelligence and reliable forecasts tailored to emerging regional needs.
Yes, we provide customisation as per your requirements. To learn more, feel free to contact us on sales@6wresearch.com
1 Executive Summary |
2 Introduction |
2.1 Key Highlights of the Report |
2.2 Report Description |
2.3 Market Scope & Segmentation |
2.4 Research Methodology |
2.5 Assumptions |
3 Luxembourg Prisms Market Overview |
3.1 Luxembourg Country Macro Economic Indicators |
3.2 Luxembourg Prisms Market Revenues & Volume, 2022 & 2032F |
3.3 Luxembourg Prisms Market - Industry Life Cycle |
3.4 Luxembourg Prisms Market - Porter's Five Forces |
3.5 Luxembourg Prisms Market Revenues & Volume Share, By Product, 2022 & 2032F |
3.6 Luxembourg Prisms Market Revenues & Volume Share, By Application, 2022 & 2032F |
4 Luxembourg Prisms Market Dynamics |
4.1 Impact Analysis |
4.2 Market Drivers |
4.2.1 Increasing demand for high-quality optical components in various industries |
4.2.2 Technological advancements leading to the development of innovative prism solutions |
4.2.3 Growing investments in research and development activities in the optics industry |
4.3 Market Restraints |
4.3.1 Intense competition from established players in the global prism market |
4.3.2 Fluctuations in raw material prices impacting production costs |
4.3.3 Regulatory challenges and standards affecting the import and export of prisms |
5 Luxembourg Prisms Market Trends |
6 Luxembourg Prisms Market Segmentations |
6.1 Luxembourg Prisms Market, By Product |
6.1.1 Overview and Analysis |
6.1.2 Luxembourg Prisms Market Revenues & Volume, By Dispersion Prisms, 2022-2032F |
6.1.3 Luxembourg Prisms Market Revenues & Volume, By Deviation Prisms, 2022-2032F |
6.1.4 Luxembourg Prisms Market Revenues & Volume, By Rotation Prisms, 2022-2032F |
6.1.5 Luxembourg Prisms Market Revenues & Volume, By Displacement Prisms, 2022-2032F |
6.2 Luxembourg Prisms Market, By Application |
6.2.1 Overview and Analysis |
6.2.2 Luxembourg Prisms Market Revenues & Volume, By Microscope, 2022-2032F |
6.2.3 Luxembourg Prisms Market Revenues & Volume, By Lens, 2022-2032F |
6.2.4 Luxembourg Prisms Market Revenues & Volume, By Telescope, 2022-2032F |
6.2.5 Luxembourg Prisms Market Revenues & Volume, By Others, 2022-2032F |
7 Luxembourg Prisms Market Import-Export Trade Statistics |
7.1 Luxembourg Prisms Market Export to Major Countries |
7.2 Luxembourg Prisms Market Imports from Major Countries |
8 Luxembourg Prisms Market Key Performance Indicators |
8.1 Percentage of revenue allocated to RD for prism innovation |
8.2 Number of patents filed for new prism technologies |
8.3 Adoption rate of advanced prism solutions in key industries |
8.4 Rate of return on investment in prism manufacturing processes |
8.5 Customer satisfaction ratings for prism quality and performance |
9 Luxembourg Prisms Market - Opportunity Assessment |
9.1 Luxembourg Prisms Market Opportunity Assessment, By Product, 2022 & 2032F |
9.2 Luxembourg Prisms Market Opportunity Assessment, By Application, 2022 & 2032F |
10 Luxembourg Prisms Market - Competitive Landscape |
10.1 Luxembourg Prisms Market Revenue Share, By Companies, 2025 |
10.2 Luxembourg Prisms Market Competitive Benchmarking, By Operating and Technical Parameters |
11 Company Profiles |
12 Recommendations | 13 Disclaimer |
Global Go To Market Strategy - 2030
Export potential enables firms to identify high-growth global markets with greater confidence by combining advanced trade intelligence with a structured quantitative methodology. The framework analyzes emerging demand trends and country-level import patterns while integrating macroeconomic and trade datasets such as GDP and population forecasts, bilateral import–export flows, tariff structures, elasticity differentials between developed and developing economies, geographic distance, and import demand projections. Using weighted trade values from 2020–2024 as the base period to project country-to-country export potential for 2030, these inputs are operationalized through calculated drivers such as gravity model parameters, tariff impact factors, and projected GDP per-capita growth. Through an analysis of hidden potentials, demand hotspots, and market conditions that are most favorable to success, this method enables firms to focus on target countries, maximize returns, and global expansion with data, backed by accuracy.
By factoring in the projected importer demand gap that is currently unmet and could be potential opportunity, it identifies the potential for the Exporter (Country) among 190 countries, against the general trade analysis, which identifies the biggest importer or exporter.
To discover high-growth global markets and optimize your business strategy:
Click Here
Pricing
- Single User License$ 1,995
- Department License$ 2,400
- Site License$ 3,120
- Global License$ 3,795

Leadership Perspectives from Industry Events
Search
Thought Leadership and Analyst Meet


Our Clients
6WResearch In News
- Doha a strategic location for EV manufacturing hub: IPA Qatar
- Demand for luxury TVs surging in the GCC, says Samsung
- Empowering Growth: The Thriving Journey of Bangladesh’s Cable Industry
- Demand for luxury TVs surging in the GCC, says Samsung
- Video call with a traditional healer? Once unthinkable, it’s now common in South Africa
- Intelligent Buildings To Smooth GCC’s Path To Net Zero
Latest Reports
- New Zealand Aseptic Manufacturing Market (2026-2032)
- Netherlands Aseptic Manufacturing Market (2026-2032)
- Nauru Aseptic Manufacturing Market (2026-2032)
- Namibia Aseptic Manufacturing Market (2026-2032)
- Mozambique Aseptic Manufacturing Market (2026-2032)
- Montenegro Aseptic Manufacturing Market (2026-2032)
- Mongolia Aseptic Manufacturing Market (2026-2032)
- Monaco Aseptic Manufacturing Market (2026-2032)
- Micronesia Aseptic Manufacturing Market (2026-2032)
- Mauritius Aseptic Manufacturing Market (2026-2032)
Industry Events and Analyst Meet

HIMTEX 2026

India Refining Summit 2026

India EV Show 2026

EV tech India Expo 2026

Auto Tech Asia 2026
Whitepaper
- Middle East & Africa Commercial Security Market Click here to view more.
- Middle East & Africa Fire Safety Systems & Equipment Market Click here to view more.
- GCC Drone Market Click here to view more.
- Middle East Lighting Fixture Market Click here to view more.
- GCC Physical & Perimeter Security Market Click here to view more.