Malaysia Clay Products And Refractories Market (2026-2032) Outlook | Revenue, Analysis, Industry, Companies, Trends, Share, Value, Forecast, Growth, Size
Market Forecast By Type (Pottery, Ceramics, Plumbing Fixtures, Clay Building Material, Refractories), By Process (Grinding , Cutting , Mixing , Shaping, Honing), By Material (Quartz, Chamatte, Sand, Sawdust, Slag, Pulverized , Coal), By End-User Vertical (Construction , Automobiles , Steel Making , Cosmetics, Food Industry, Others) And Competitive Landscape
| Product Code: ETC319106 | Publication Date: Aug 2022 | Updated Date: Jul 2026 | Product Type: Market Research Report | |
| Publisher: 6Wresearch | Author: Ravi Bhandari | No. of Pages: 75 | No. of Figures: 35 | No. of Tables: 20 |
Malaysia Clay Products And Refractories Market Size, Share & Growth Rate
The Malaysia Clay Products And Refractories Market was estimated at USD 423 Million in 2025 and is projected to reach USD 550 Million by 2032, growing at a CAGR of 3.8% from 2026 to 2032. This growth trajectory is primarily fueled by the increasing demand from key industrial sectors such as metallurgical, cement, and glass manufacturing. As these industries expand their operational capacities, they require high-performance clay products and refractories that offer superior thermal resistance and durability.
Malaysia Clay Products And Refractories Market Year-wise Growth Rate and Key Drivers
This graph highlights how the Malaysia Clay Products And Refractories Market has steadily grown over the years, supported by major growth factors.
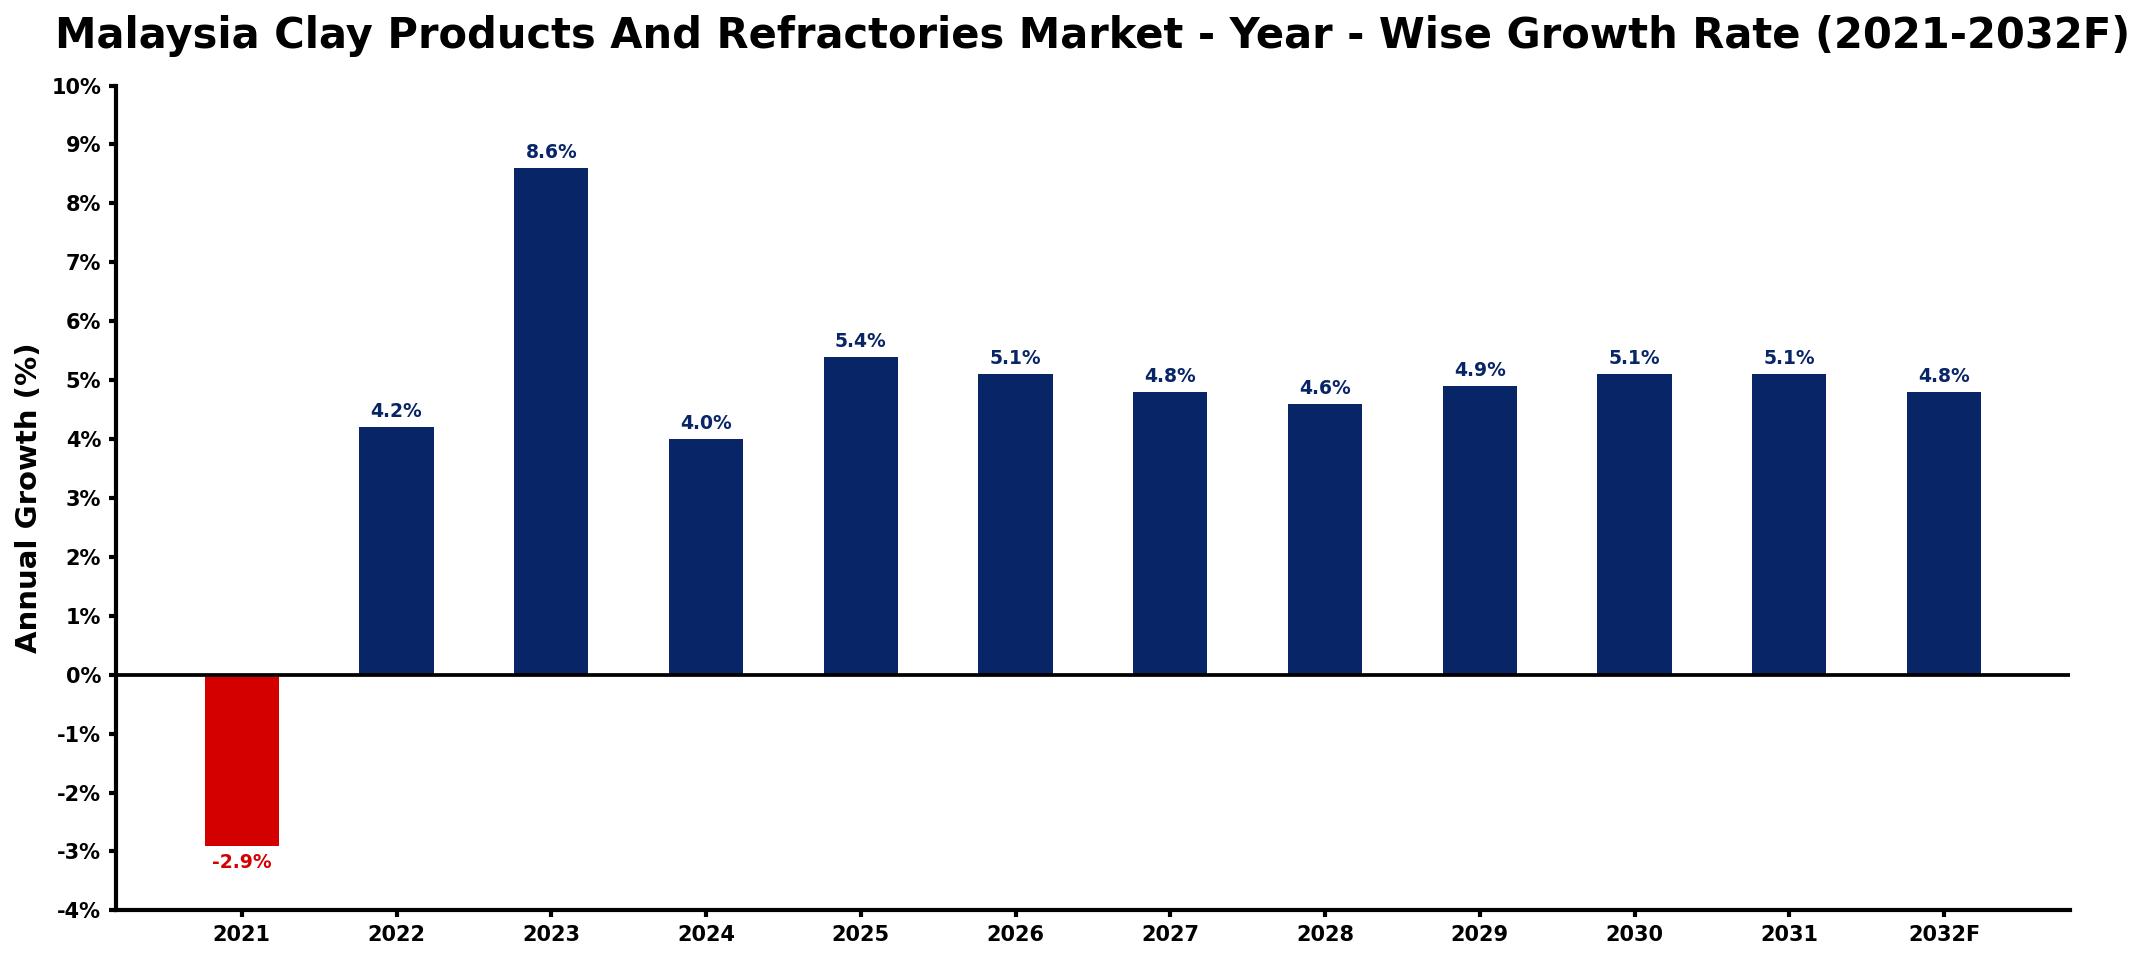
The table below presents the year‑wise growth rates along with the key drivers influencing the market
| Year | Growth Rate | Major Drivers |
| 2021 | -2.9% | decreased construction project investments |
| 2022 | 4.2% | increased infrastructure development projects |
| 2023 | 8.6% | growing industrial manufacturing activities |
| 2024 | 4.0% | expansion in energy sector investments |
| 2025 | 5.4% | rising demand from automotive industry |
| 2026 | 5.1% | increased exports to regional markets |
| 2027 | 4.8% | growing demand from construction sector |
| 2028 | 4.6% | expansion of mining operations globally |
| 2029 | 4.9% | increased investments in technology upgrades |
| 2030 | 5.1% | growing environmental sustainability initiatives |
| 2031 | 5.1% | increased capital investment inflows |
| 2032 | 4.8% | increased focus on renewable energy |
Note: Market size estimations and growth projections presented in this report are based on 6Wresearch's proprietary forecasting methodology, utilizing the latest available industry data, government publications, and primary research inputs.
Malaysia Clay Products And Refractories Market Synopsis
In recent years, Malaysia's industrial landscape has evolved, positioning clay products and refractories as vital components across various sectors. Their role in lining furnaces and kilns, coupled with their ability to withstand extreme temperatures and corrosive environments, makes them indispensable for manufacturers looking to optimize operational efficiency.
The market is closely linked with the construction sector, where refractories find application in a range of construction materials. As infrastructural projects gain momentum in Malaysia, the demand for clay-based refractories is expected to rise, further solidifying the markets growth prospects.
Malaysia Clay Products And Refractories Market Key Takeaways
- Strong growth projected due to the increasing industrial activities in steel, cement, and glass sectors.
- Technological advancements in refractory materials present both opportunities and challenges.
- The construction industry's expansion is anticipated to bolster the demand for clay products.
- Key players are focusing on quality and sustainability to remain competitive.
- COVID-19 impacts are stabilizing as economies recover, driving renewed industrial activity.
Evaluation of Restraints in Malaysia Clay Products And Refractories Market
Despite its growth potential, the Malaysia Clay Products and Refractories Market faces certain restraints that could hinder progress. One significant concern is the rapid pace of technological advancements that favor newer materials, such as silicon carbide and alumina, potentially overshadowing traditional clay products. Additionally, the sourcing of high-quality clay and the energy-intensive nature of production processes can lead to supply chain challenges. As the market evolves, it is essential for stakeholders to invest in innovation and sustainability practices to navigate these hurdles effectively.
Malaysia Clay Products And Refractories Market Trends
The market is witnessing several emerging trends that are shaping its dynamics. A notable trend is the increasing emphasis on sustainability and eco-friendly production methods. Manufacturers are exploring alternative raw materials and processes that minimize environmental impact while maintaining high performance. Additionally, the integration of digital technologies for monitoring and optimizing production processes is gaining traction, enabling companies to enhance efficiency and reduce costs.
Malaysia Clay Products And Refractories Market Opportunities
With the anticipated growth in infrastructure development and industrial expansion, numerous opportunities are emerging within the Malaysia Clay Products and Refractories Market. Investment in research and development can lead to innovative product offerings that meet evolving industry standards. Moreover, tapping into regional markets and establishing strategic partnerships could broaden the reach of existing players, allowing them to capitalize on demand surges across Southeast Asia.
Government Initiatives in the Malaysia Clay Products And Refractories Market
The Malaysian government has recognized the significance of the manufacturing sector, including the clay products and refractories market, in driving economic growth. Initiatives aimed at promoting local industries, providing incentives for research and development, and encouraging foreign investment are some strategies being employed to enhance market competitiveness. Furthermore, public spending on infrastructure development projects is expected to further stimulate demand for clay products.
Future Insights of the Malaysia Clay Products And Refractories Market
Looking ahead to 2026-2032, the Malaysia Clay Products and Refractories Market is set to experience substantial evolution. As industries modernize and seek greater efficiencies, the demand for innovative, high-performance materials will continue to grow. The convergence of sustainability trends with technological advancements will likely reshape product offerings, with a focus on both performance and environmental responsibility. Stakeholders who adapt swiftly to these changes will find themselves well-positioned to capitalize on emerging opportunities.
Malaysia Clay Products And Refractories Market Latest Developments (2025 - 2026)
In recent months, the Malaysia Clay Products and Refractories Market has seen a shift towards enhanced product development, with companies launching innovative refractory materials designed for high-performance applications. Additionally, there has been a marked increase in collaboration between manufacturers and research institutions to drive advancements in material science. These developments are indicative of an industry that is keen to evolve and respond to the changing needs of its core markets.
Malaysia Clay Products And Refractories Market - Key Attractiveness of the Report
- 10 Years of Market Numbers
- Historical Data Starting from 2022 to 2025
- Base Year: 2025
- Forecast Data until 2032
- Key Performance Indicators Impacting the Market
- Major Upcoming Developments and Projects
Key Highlights of the Report:
- Malaysia Clay Products And Refractories Market Outlook
- Market Size of Malaysia Clay Products And Refractories Market, 2025
- Forecast of Malaysia Clay Products And Refractories Market, 2032
- Historical Data and Forecast of Malaysia Clay Products And Refractories Revenues & Volume for the Period 2022-2032F
- Malaysia Clay Products And Refractories Market Trend Evolution
- Malaysia Clay Products And Refractories Market Drivers and Challenges
- Malaysia Clay Products And Refractories Price Trends
- Malaysia Clay Products And Refractories Porter's Five Forces
- Malaysia Clay Products And Refractories Industry Life Cycle
- Historical Data and Forecast of Malaysia Clay Products And Refractories Market Revenues & Volume By Type for the Period 2022-2032F
- Historical Data and Forecast of Malaysia Clay Products And Refractories Market Revenues & Volume By Pottery for the Period 2022-2032F
- Historical Data and Forecast of Malaysia Clay Products And Refractories Market Revenues & Volume By Ceramics for the Period 2022-2032F
- Historical Data and Forecast of Malaysia Clay Products And Refractories Market Revenues & Volume By Plumbing Fixtures for the Period 2022-2032F
- Historical Data and Forecast of Malaysia Clay Products And Refractories Market Revenues & Volume By Clay Building Material for the Period 2022-2032F
- Historical Data and Forecast of Malaysia Clay Products And Refractories Market Revenues & Volume By Refractories for the Period 2022-2032F
- Historical Data and Forecast of Malaysia Clay Products And Refractories Market Revenues & Volume By Process for the Period 2022-2032F
- Historical Data and Forecast of Malaysia Clay Products And Refractories Market Revenues & Volume By Grinding for the Period 2022-2032F
- Historical Data and Forecast of Malaysia Clay Products And Refractories Market Revenues & Volume By Cutting for the Period 2022-2032F
- Historical Data and Forecast of Malaysia Clay Products And Refractories Market Revenues & Volume By Mixing for the Period 2022-2032F
- Historical Data and Forecast of Malaysia Clay Products And Refractories Market Revenues & Volume By Shaping for the Period 2022-2032F
- Historical Data and Forecast of Malaysia Clay Products And Refractories Market Revenues & Volume By Honing for the Period 2022-2032F
- Historical Data and Forecast of Malaysia Clay Products And Refractories Market Revenues & Volume By Material for the Period 2022-2032F
- Historical Data and Forecast of Malaysia Clay Products And Refractories Market Revenues & Volume By Quartz for the Period 2022-2032F
- Historical Data and Forecast of Malaysia Clay Products And Refractories Market Revenues & Volume By Chamatte for the Period 2022-2032F
- Historical Data and Forecast of Malaysia Clay Products And Refractories Market Revenues & Volume By Sand for the Period 2022-2032F
- Historical Data and Forecast of Malaysia Clay Products And Refractories Market Revenues & Volume By Sawdust for the Period 2022-2032F
- Historical Data and Forecast of Malaysia Clay Products And Refractories Market Revenues & Volume By Slag for the Period 2022-2032F
- Historical Data and Forecast of Malaysia Clay Products And Refractories Market Revenues & Volume By Pulverized for the Period 2022-2032F
- Historical Data and Forecast of Malaysia Clay Products And Refractories Market Revenues & Volume By Coal for the Period 2022-2032F
- Historical Data and Forecast of Malaysia Clay Products And Refractories Market Revenues & Volume By End-User Vertical for the Period 2022-2032F
- Historical Data and Forecast of Malaysia Clay Products And Refractories Market Revenues & Volume By Construction for the Period 2022-2032F
- Historical Data and Forecast of Malaysia Clay Products And Refractories Market Revenues & Volume By Automobiles for the Period 2022-2032F
- Historical Data and Forecast of Malaysia Clay Products And Refractories Market Revenues & Volume By Steel Making for the Period 2022-2032F
- Historical Data and Forecast of Malaysia Clay Products And Refractories Market Revenues & Volume By Cosmetics for the Period 2022-2032F
- Historical Data and Forecast of Malaysia Clay Products And Refractories Market Revenues & Volume By Food Industry for the Period 2022-2032F
- Historical Data and Forecast of Malaysia Clay Products And Refractories Market Revenues & Volume By Others for the Period 2022-2032F
- Malaysia Clay Products And Refractories Import Export Trade Statistics
- Market Opportunity Assessment By Type
- Market Opportunity Assessment By Process
- Market Opportunity Assessment By Material
- Market Opportunity Assessment By End-User Vertical
- Malaysia Clay Products And Refractories Top Companies Market Share
- Malaysia Clay Products And Refractories Competitive Benchmarking By Technical and Operational Parameters
- Malaysia Clay Products And Refractories Company Profiles
- Malaysia Clay Products And Refractories Key Strategic Recommendations
Frequently Asked Questions About the Market Study (FAQs):
The primary drivers include the robust expansion of the metallurgical, cement, and glass industries, which rely heavily on high-quality clay products and refractories for their operations.
While there were temporary disruptions in production and demand, certain segments like steel manufacturing saw an increase in demand for refractories, and recovery is expected to stabilize the market.
The market was estimated at USD 423 Million in 2025 and is projected to reach USD 550 Million by 2032, growing at a CAGR of 3.8% from 2026 to 2032.
Current trends include a focus on sustainable production methods and the incorporation of digital technologies to enhance manufacturing efficiency.
The growth of the construction sector is a significant contributor to the demand for clay products and refractories, as they are essential in various construction applications, adding value to the overall market.
6Wresearch actively monitors the Malaysia Clay Products And Refractories Market and publishes its comprehensive annual report, highlighting emerging trends, growth drivers, revenue analysis, and forecast outlook. Our insights help businesses to make data-backed strategic decisions with ongoing market dynamics. Our analysts track relevent industries related to the Malaysia Clay Products And Refractories Market, allowing our clients with actionable intelligence and reliable forecasts tailored to emerging regional needs.
Yes, we provide customisation as per your requirements. To learn more, feel free to contact us on sales@6wresearch.com
1 Executive Summary |
2 Introduction |
2.1 Key Highlights of the Report |
2.2 Report Description |
2.3 Market Scope & Segmentation |
2.4 Research Methodology |
2.5 Assumptions |
3 Malaysia Clay Products And Refractories Market Overview |
3.1 Malaysia Country Macro Economic Indicators |
3.2 Malaysia Clay Products And Refractories Market Revenues & Volume, 2022 & 2032F |
3.3 Malaysia Clay Products And Refractories Market - Industry Life Cycle |
3.4 Malaysia Clay Products And Refractories Market - Porter's Five Forces |
3.5 Malaysia Clay Products And Refractories Market Revenues & Volume Share, By Type, 2022 & 2032F |
3.6 Malaysia Clay Products And Refractories Market Revenues & Volume Share, By Process , 2022 & 2032F |
3.7 Malaysia Clay Products And Refractories Market Revenues & Volume Share, By Material , 2022 & 2032F |
3.8 Malaysia Clay Products And Refractories Market Revenues & Volume Share, By End-User Vertical , 2022 & 2032F |
4 Malaysia Clay Products And Refractories Market Dynamics |
4.1 Impact Analysis |
4.2 Market Drivers |
4.2.1 Increasing construction activities in Malaysia |
4.2.2 Growing demand for refractories in the steel industry |
4.2.3 Government initiatives to promote the use of locally sourced materials in manufacturing processes |
4.3 Market Restraints |
4.3.1 Fluctuating raw material prices |
4.3.2 Environmental regulations impacting production processes |
4.3.3 Competition from alternative materials like plastics and composites |
5 Malaysia Clay Products And Refractories Market Trends |
6 Malaysia Clay Products And Refractories Market, By Types |
6.1 Malaysia Clay Products And Refractories Market, By Type |
6.1.1 Overview and Analysis |
6.1.2 Malaysia Clay Products And Refractories Market Revenues & Volume, By Type, 2022-2032F |
6.1.3 Malaysia Clay Products And Refractories Market Revenues & Volume, By Pottery, 2022-2032F |
6.1.4 Malaysia Clay Products And Refractories Market Revenues & Volume, By Ceramics, 2022-2032F |
6.1.5 Malaysia Clay Products And Refractories Market Revenues & Volume, By Plumbing Fixtures, 2022-2032F |
6.1.6 Malaysia Clay Products And Refractories Market Revenues & Volume, By Clay Building Material, 2022-2032F |
6.1.7 Malaysia Clay Products And Refractories Market Revenues & Volume, By Refractories, 2022-2032F |
6.2 Malaysia Clay Products And Refractories Market, By Process |
6.2.1 Overview and Analysis |
6.2.2 Malaysia Clay Products And Refractories Market Revenues & Volume, By Grinding , 2022-2032F |
6.2.3 Malaysia Clay Products And Refractories Market Revenues & Volume, By Cutting , 2022-2032F |
6.2.4 Malaysia Clay Products And Refractories Market Revenues & Volume, By Mixing , 2022-2032F |
6.2.5 Malaysia Clay Products And Refractories Market Revenues & Volume, By Shaping, 2022-2032F |
6.2.6 Malaysia Clay Products And Refractories Market Revenues & Volume, By Honing, 2022-2032F |
6.3 Malaysia Clay Products And Refractories Market, By Material |
6.3.1 Overview and Analysis |
6.3.2 Malaysia Clay Products And Refractories Market Revenues & Volume, By Quartz, 2022-2032F |
6.3.3 Malaysia Clay Products And Refractories Market Revenues & Volume, By Chamatte, 2022-2032F |
6.3.4 Malaysia Clay Products And Refractories Market Revenues & Volume, By Sand, 2022-2032F |
6.3.5 Malaysia Clay Products And Refractories Market Revenues & Volume, By Sawdust, 2022-2032F |
6.3.6 Malaysia Clay Products And Refractories Market Revenues & Volume, By Slag, 2022-2032F |
6.3.7 Malaysia Clay Products And Refractories Market Revenues & Volume, By Pulverized , 2022-2032F |
6.4 Malaysia Clay Products And Refractories Market, By End-User Vertical |
6.4.1 Overview and Analysis |
6.4.2 Malaysia Clay Products And Refractories Market Revenues & Volume, By Construction , 2022-2032F |
6.4.3 Malaysia Clay Products And Refractories Market Revenues & Volume, By Automobiles , 2022-2032F |
6.4.4 Malaysia Clay Products And Refractories Market Revenues & Volume, By Steel Making , 2022-2032F |
6.4.5 Malaysia Clay Products And Refractories Market Revenues & Volume, By Cosmetics, 2022-2032F |
6.4.6 Malaysia Clay Products And Refractories Market Revenues & Volume, By Food Industry, 2022-2032F |
6.4.7 Malaysia Clay Products And Refractories Market Revenues & Volume, By Others, 2022-2032F |
7 Malaysia Clay Products And Refractories Market Import-Export Trade Statistics |
7.1 Malaysia Clay Products And Refractories Market Export to Major Countries |
7.2 Malaysia Clay Products And Refractories Market Imports from Major Countries |
8 Malaysia Clay Products And Refractories Market Key Performance Indicators |
8.1 Percentage of construction projects utilizing clay products and refractories |
8.2 Adoption rate of advanced refractory materials in the steel industry |
8.3 Investment in research and development for product innovation and efficiency |
9 Malaysia Clay Products And Refractories Market - Opportunity Assessment |
9.1 Malaysia Clay Products And Refractories Market Opportunity Assessment, By Type, 2022 & 2032F |
9.2 Malaysia Clay Products And Refractories Market Opportunity Assessment, By Process , 2022 & 2032F |
9.3 Malaysia Clay Products And Refractories Market Opportunity Assessment, By Material , 2022 & 2032F |
9.4 Malaysia Clay Products And Refractories Market Opportunity Assessment, By End-User Vertical , 2022 & 2032F |
10 Malaysia Clay Products And Refractories Market - Competitive Landscape |
10.1 Malaysia Clay Products And Refractories Market Revenue Share, By Companies, 2025 |
10.2 Malaysia Clay Products And Refractories Market Competitive Benchmarking, By Operating and Technical Parameters |
11 Company Profiles |
12 Recommendations |
13 Disclaimer |
Global Go To Market Strategy - 2030
Export potential enables firms to identify high-growth global markets with greater confidence by combining advanced trade intelligence with a structured quantitative methodology. The framework analyzes emerging demand trends and country-level import patterns while integrating macroeconomic and trade datasets such as GDP and population forecasts, bilateral import–export flows, tariff structures, elasticity differentials between developed and developing economies, geographic distance, and import demand projections. Using weighted trade values from 2020–2024 as the base period to project country-to-country export potential for 2030, these inputs are operationalized through calculated drivers such as gravity model parameters, tariff impact factors, and projected GDP per-capita growth. Through an analysis of hidden potentials, demand hotspots, and market conditions that are most favorable to success, this method enables firms to focus on target countries, maximize returns, and global expansion with data, backed by accuracy.
By factoring in the projected importer demand gap that is currently unmet and could be potential opportunity, it identifies the potential for the Exporter (Country) among 190 countries, against the general trade analysis, which identifies the biggest importer or exporter.
To discover high-growth global markets and optimize your business strategy:
Click Here
Pricing
- Single User License$ 1,995
- Department License$ 2,400
- Site License$ 3,120
- Global License$ 3,795

Leadership Perspectives from Industry Events
Search
Thought Leadership and Analyst Meet


Our Clients
6WResearch In News
- India Air Conditioner Market Set for Strong Rebound in 2026 After Weather-Led Correction and GST-Driven Recovery: 6Wresearch
- ADAS in India: How Automatic Emergency Braking, Blind Spot Detection & Driver Monitoring are Transforming Road Safety
- Doha a strategic location for EV manufacturing hub: IPA Qatar
- Demand for luxury TVs surging in the GCC, says Samsung
- Empowering Growth: The Thriving Journey of Bangladesh’s Cable Industry
- Demand for luxury TVs surging in the GCC, says Samsung
Latest Reports
- Nicaragua RPG Gaming Market (2026-2032)
- New Zealand RPG Gaming Market (2026-2032)
- Netherlands RPG Gaming Market (2026-2032)
- Nauru RPG Gaming Market (2026-2032)
- Namibia RPG Gaming Market (2026-2032)
- Mozambique RPG Gaming Market (2026-2032)
- Montenegro RPG Gaming Market (2026-2032)
- Mongolia RPG Gaming Market (2026-2032)
- Monaco RPG Gaming Market (2026-2032)
- Micronesia RPG Gaming Market (2026-2032)
Industry Events and Analyst Meet

EV India Expo 2026

HIMTEX 2026

India Refining Summit 2026

India EV Show 2026

EV tech India Expo 2026
Whitepaper
- Middle East & Africa Commercial Security Market Click here to view more.
- Middle East & Africa Fire Safety Systems & Equipment Market Click here to view more.
- GCC Drone Market Click here to view more.
- Middle East Lighting Fixture Market Click here to view more.
- GCC Physical & Perimeter Security Market Click here to view more.