Malaysia Nonferrous Metal Products Market (2026-2032) | Growth, Size, Outlook, Trends, Revenue, Companies, Analysis, Forecast, Value, Industry & Share
Market Forecast By Type (Smelting and Refining, Rolling, Drawing, Extruding, Alloying, Other), By Applications (Automotive, Electronic Power, Construction, Others) And Competitive Landscape
| Product Code: ETC033826 | Publication Date: Jun 2023 | Updated Date: Jun 2026 | Product Type: Report | |
| Publisher: 6Wresearch | Author: Ravi Bhandari | No. of Pages: 70 | No. of Figures: 35 | No. of Tables: 5 |
Malaysia Nonferrous Metal Products Market Summary
The malaysia nonferrous metal products market was estimated at USD 411 Million in 2025 and is projected to reach USD 536 Million by 2032, growing at a CAGR of 5.1% from 2026 to 2032.
Malaysia Nonferrous Metal Products Market Year-wise Growth Rate and Key Drivers
This graph highlights how the Malaysia Nonferrous Metal Products Market has steadily grown over the past five years, supported by major growth factors.
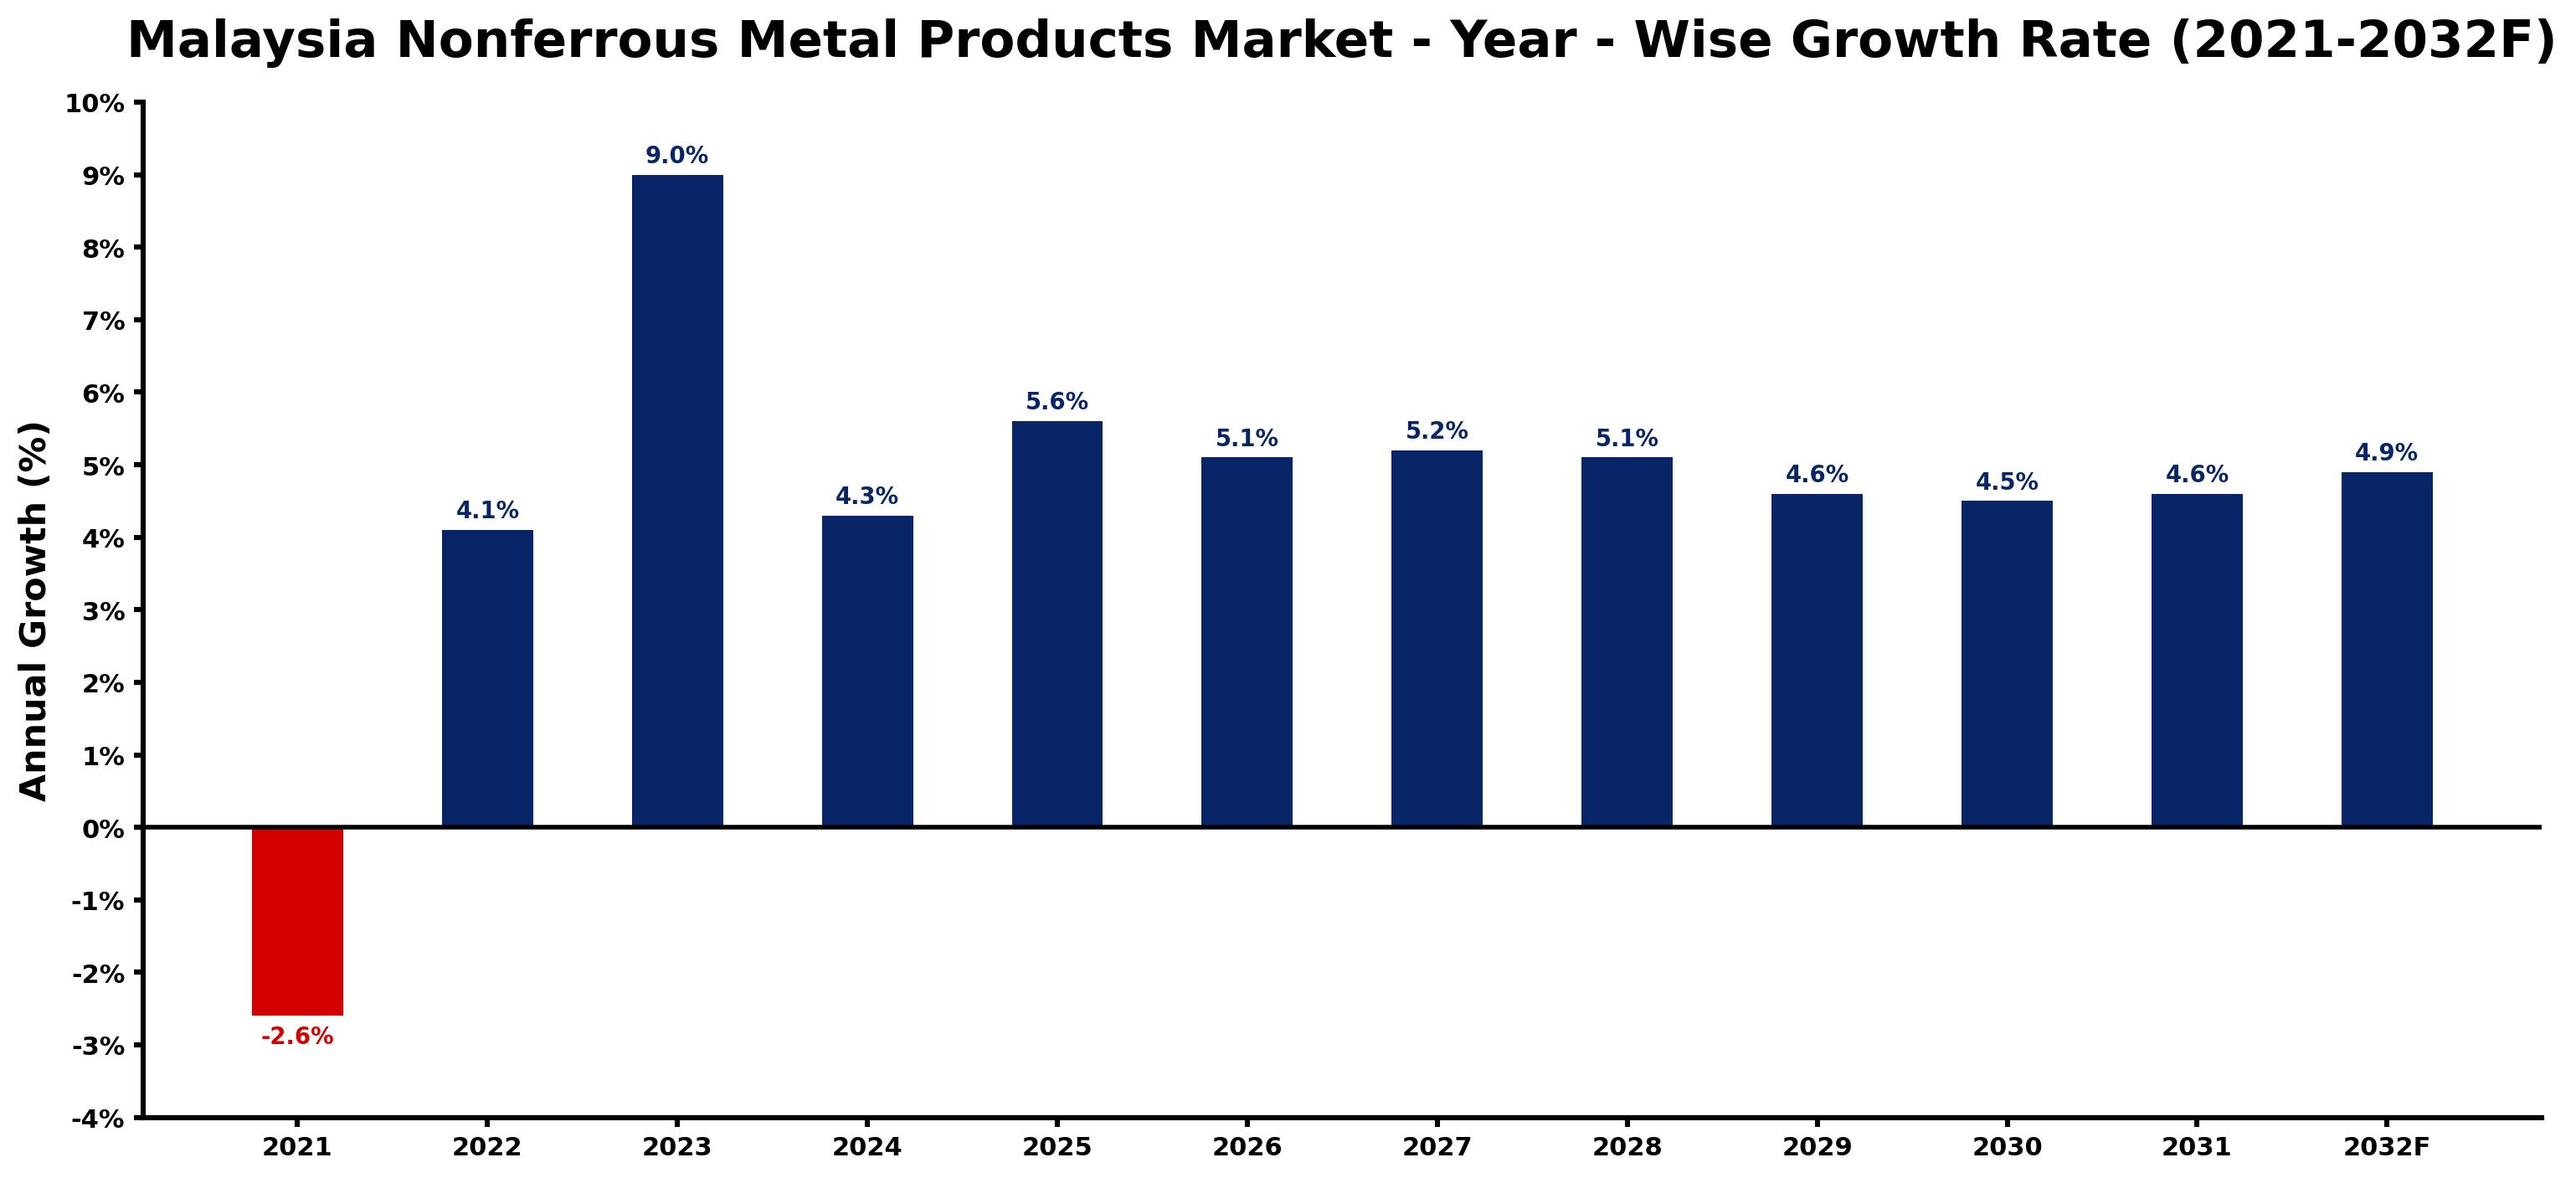
The table below presents the year wise growth rates along with the key drivers influencing the market
| Year | Growth Rate | Major Drivers |
| 2021 | -2.6% | Persistent supply chain disruptions hindered production capacities, leading to delays and reduced market availability. |
| 2022 | 4.1% | Local manufacturers increased output to meet rising consumer preferences for sustainable products. |
| 2023 | 9.0% | A shift towards electrification in transport prompted higher consumption of aluminum components. |
| 2024 | 4.3% | Emerging construction projects across Malaysia expanded the need for copper and zinc products. |
| 2025 | 5.6% | Innovations in recycling technology improved the supply chain dynamics of nonferrous metals. |
| 2026 | 5.1% | A focus on energy efficiency created new opportunities for lightweight metal applications. |
| 2027 | 5.2% | Growing automotive sector sought advanced materials to enhance fuel efficiency in vehicles. |
| 2028 | 5.1% | Expansion in renewable energy systems drove higher demand for specialized metal alloys. |
| 2029 | 4.6% | Upsurge in smart manufacturing encouraged investments in high-performance metal products. |
| 2030 | 4.5% | Collaborations between industries facilitated knowledge sharing on metal product advancements. |
| 2031 | 4.6% | Increased urbanization highlighted the necessity for resilient infrastructure using nonferrous metals. |
| 2032 | 4.9% | Sustainability trends further positioned recycled nonferrous metals as preferred in manufacturing. |
Note - Market size estimations and growth projections presented in this report are based on 6Wresearch's advanced forecasting approach, validated with industry datasets as of June 2026.
Malaysia Nonferrous Metal Products Market Synopsis
The Malaysia Nonferrous Metal Products Market is projected to reach 5.1% and witness significant growth during the forecast period (2026-2032). The market is anticipated to experience a compound annual growth rate (CAGR) of 7.8%, driven by increasing demand from various end-user industries, including automotive, construction, and the electrical and electronics sectors. Additionally, substantial government investment in infrastructure projects is expected to further stimulate the demand for nonferrous metals across Malaysia in the coming years.
Malaysia Nonferrous Metal Products Market Growth Drivers
Several key factors contribute to the robust growth of the Malaysia Nonferrous Metal Products Market. Firstly, the automotive industry, which is one of the largest consumers of nonferrous metals, is witnessing a surge in production due to rising vehicle production and sales. This trend is further bolstered by an increasing focus on lightweight materials to improve fuel efficiency.
- The push for sustainable construction practices has also heightened the demand for nonferrous metals, which offer advantages such as durability and corrosion resistance.
- Technological advancements in manufacturing processes are enabling more efficient production and improving the quality of nonferrous metal products, attracting more industries to utilize these materials.
- Increased investments in research and development are fostering innovation within the market, leading to the introduction of new nonferrous metal applications that cater to evolving industry needs.
- Lastly, the prevailing rise in disposable income among the population has enhanced consumer purchasing power, which is expected to translate into higher demand for various nonferrous products.
Malaysia Nonferrous Metal Products Market Challenges and Restraints
Despite the promising growth outlook, the Malaysia Nonferrous Metal Products Market faces several challenges that could impede its progress. One of the most significant issues is the fluctuation in raw material prices, which can affect profitability and price stability for manufacturers.
- Moreover, the lack of skilled labor resources in the metalworking sector poses a significant barrier, as it limits the industry's capacity to meet the growing demand efficiently.
- Environmental regulations and compliance costs are becoming increasingly stringent, putting additional pressure on manufacturers to adopt more sustainable practices, which can increase operational costs.
- The global supply chain disruptions caused by geopolitical tensions and pandemics can also impact the availability and pricing of nonferrous metals.
- Lastly, the competition from alternative materials, such as plastics and composites, could potentially limit the market's expansion if they are perceived as more cost-effective or versatile options.
Malaysia Nonferrous Metal Products Market Government Investment and Initiatives
The Malaysian government has recognized the importance of the nonferrous metal products sector as a vital component of the country's economic development. Significant public spending is being directed towards infrastructure projects, which often require nonferrous metals, thereby driving demand in the sector.
- Initiatives aimed at enhancing industrial competitiveness, such as tax incentives and grants for research and development, are expected to spur innovation and productivity within the nonferrous metal industry.
- The government's focus on green technology adoption is promoting environmentally friendly practices in production, encouraging metal manufacturers to invest in cleaner technologies.
- Strategic collaborations with private sector players are being fostered to improve supply chain efficiency and strengthen the overall market ecosystem through shared resources and knowledge.
- Furthermore, various trade agreements and partnerships are being explored to enhance export potential and expand market reach for Malaysian nonferrous metal products.
Malaysia Nonferrous Metal Products Market Latest Developments (May 2025 - June 2026)
Recent developments in the Malaysia Nonferrous Metal Products Market indicate a transformation driven by innovation and regulatory changes. Companies within the sector are increasingly focusing on sustainable practices, with many adopting advanced recycling technologies to reduce waste and improve resource efficiency.
- Several industry stakeholders have initiated collaborations with research institutions to drive technological advancements and develop new nonferrous metal applications.
- Government reviews of industry standards and regulations are expected to impact operational practices, emphasizing the need for compliance and operational excellence among manufacturers.
- The market has witnessed increased activity in terms of mergers and partnerships aimed at consolidating operational capabilities and expanding product portfolios.
- Emerging trends, such as the rise of electric vehicles, are prompting greater demand for specific nonferrous metals, leading to shifts in production strategies within the market.
Malaysia Nonferrous Metal Products Market - Key Attractiveness of the Report
- 10 Years of Market Numbers
- Historical Data Starting from 2022 to 2025
- Base Year: 2025
- Forecast Data until 2032
- Key Performance Indicators Impacting the Market
- Major Upcoming Developments and Projects
Key Highlights of the Report:
- Malaysia Nonferrous Metal Products Market Outlook
- Market Size of Malaysia Nonferrous Metal Products Market, 2025
- Forecast of Malaysia Nonferrous Metal Products Market, 2032
- Historical Data and Forecast of Malaysia Nonferrous Metal Products Revenues & Volume for the Period 2022-2032F
- Malaysia Nonferrous Metal Products Market Trend Evolution
- Malaysia Nonferrous Metal Products Market Drivers and Challenges
- Malaysia Nonferrous Metal Products Price Trends
- Malaysia Nonferrous Metal Products Porter's Five Forces
- Malaysia Nonferrous Metal Products Industry Life Cycle
- Historical Data and Forecast of Malaysia Nonferrous Metal Products Market Revenues & Volume By Type for the Period 2022-2032F
- Historical Data and Forecast of Malaysia Nonferrous Metal Products Market Revenues & Volume By Smelting and Refining for the Period 2022-2032F
- Historical Data and Forecast of Malaysia Nonferrous Metal Products Market Revenues & Volume By Rolling for the Period 2022-2032F
- Historical Data and Forecast of Malaysia Nonferrous Metal Products Market Revenues & Volume By Drawing for the Period 2022-2032F
- Historical Data and Forecast of Malaysia Nonferrous Metal Products Market Revenues & Volume By Extruding for the Period 2022-2032F
- Historical Data and Forecast of Malaysia Nonferrous Metal Products Market Revenues & Volume By Alloying for the Period 2022-2032F
- Historical Data and Forecast of Malaysia Nonferrous Metal Products Market Revenues & Volume By Other for the Period 2022-2032F
- Historical Data and Forecast of Malaysia Nonferrous Metal Products Market Revenues & Volume By Applications for the Period 2022-2032F
- Historical Data and Forecast of Malaysia Nonferrous Metal Products Market Revenues & Volume By Automotive for the Period 2022-2032F
- Historical Data and Forecast of Malaysia Nonferrous Metal Products Market Revenues & Volume By Electronic Power for the Period 2022-2032F
- Historical Data and Forecast of Malaysia Nonferrous Metal Products Market Revenues & Volume By Construction for the Period 2022-2032F
- Historical Data and Forecast of Malaysia Nonferrous Metal Products Market Revenues & Volume By Others for the Period 2022-2032F
- Malaysia Nonferrous Metal Products Import Export Trade Statistics
- Market Opportunity Assessment By Type
- Market Opportunity Assessment By Applications
- Malaysia Nonferrous Metal Products Top Companies Market Share
- Malaysia Nonferrous Metal Products Competitive Benchmarking By Technical and Operational Parameters
- Malaysia Nonferrous Metal Products Company Profiles
- Malaysia Nonferrous Metal Products Key Strategic Recommendations
Frequently Asked Questions About the Market Study (FAQs):
The Malaysia Nonferrous Metal Products Market is expected to register a CAGR of 7.8% during the forecast period.
The growth is driven by increasing demand from the automotive, construction, and electrical and electronics sectors, alongside rising government investments in infrastructure projects.
Challenges include fluctuations in raw material prices and a shortage of skilled labor resources.
The government is investing in infrastructure projects, providing tax incentives, and fostering collaborations to enhance industrial competitiveness and encourage sustainable practices.
6Wresearch actively monitors the Malaysia Nonferrous Metal Products Market and publishes its comprehensive annual report, highlighting emerging trends, growth drivers, revenue analysis, and forecast outlook. Our insights help businesses to make data-backed strategic decisions with ongoing market dynamics. Our analysts track relevent industries related to the Malaysia Nonferrous Metal Products Market, allowing our clients with actionable intelligence and reliable forecasts tailored to emerging regional needs.
Yes, we provide customisation as per your requirements. To learn more, feel free to contact us on sales@6wresearch.com
1 Executive Summary |
2 Introduction |
2.1 Key Highlights of the Report |
2.2 Report Description |
2.3 Market Scope & Segmentation |
2.4 Research Methodology |
2.5 Assumptions |
3 Malaysia Nonferrous Metal Products Market Overview |
3.1 Malaysia Country Macro Economic Indicators |
3.2 Malaysia Nonferrous Metal Products Market Revenues & Volume, 2022 & 2032F |
3.3 Malaysia Nonferrous Metal Products Market - Industry Life Cycle |
3.4 Malaysia Nonferrous Metal Products Market - Porter's Five Forces |
3.5 Malaysia Nonferrous Metal Products Market Revenues & Volume Share, By Type, 2022 & 2032F |
3.6 Malaysia Nonferrous Metal Products Market Revenues & Volume Share, By Applications, 2022 & 2032F |
4 Malaysia Nonferrous Metal Products Market Dynamics |
4.1 Impact Analysis |
4.2 Market Drivers |
4.3 Market Restraints |
5 Malaysia Nonferrous Metal Products Market Trends |
6 Malaysia Nonferrous Metal Products Market, By Types |
6.1 Malaysia Nonferrous Metal Products Market, By Type |
6.1.1 Overview and Analysis |
6.1.2 Malaysia Nonferrous Metal Products Market Revenues & Volume, By Type, 2022-2032F |
6.1.3 Malaysia Nonferrous Metal Products Market Revenues & Volume, By Smelting and Refining, 2022-2032F |
6.1.4 Malaysia Nonferrous Metal Products Market Revenues & Volume, By Rolling, 2022-2032F |
6.1.5 Malaysia Nonferrous Metal Products Market Revenues & Volume, By Drawing, 2022-2032F |
6.1.6 Malaysia Nonferrous Metal Products Market Revenues & Volume, By Extruding, 2022-2032F |
6.1.7 Malaysia Nonferrous Metal Products Market Revenues & Volume, By Alloying, 2022-2032F |
6.1.8 Malaysia Nonferrous Metal Products Market Revenues & Volume, By Other, 2022-2032F |
6.2 Malaysia Nonferrous Metal Products Market, By Applications |
6.2.1 Overview and Analysis |
6.2.2 Malaysia Nonferrous Metal Products Market Revenues & Volume, By Automotive, 2022-2032F |
6.2.3 Malaysia Nonferrous Metal Products Market Revenues & Volume, By Electronic Power, 2022-2032F |
6.2.4 Malaysia Nonferrous Metal Products Market Revenues & Volume, By Construction, 2022-2032F |
6.2.5 Malaysia Nonferrous Metal Products Market Revenues & Volume, By Others, 2022-2032F |
7 Malaysia Nonferrous Metal Products Market Import-Export Trade Statistics |
7.1 Malaysia Nonferrous Metal Products Market Export to Major Countries |
7.2 Malaysia Nonferrous Metal Products Market Imports from Major Countries |
8 Malaysia Nonferrous Metal Products Market Key Performance Indicators |
9 Malaysia Nonferrous Metal Products Market - Opportunity Assessment |
9.1 Malaysia Nonferrous Metal Products Market Opportunity Assessment, By Type, 2022 & 2032F |
9.2 Malaysia Nonferrous Metal Products Market Opportunity Assessment, By Applications, 2022 & 2032F |
10 Malaysia Nonferrous Metal Products Market - Competitive Landscape |
10.1 Malaysia Nonferrous Metal Products Market Revenue Share, By Companies, 2025 |
10.2 Malaysia Nonferrous Metal Products Market Competitive Benchmarking, By Operating and Technical Parameters |
11 Company Profiles |
12 Recommendations |
13 Disclaimer |
Global Go To Market Strategy - 2030
Export potential enables firms to identify high-growth global markets with greater confidence by combining advanced trade intelligence with a structured quantitative methodology. The framework analyzes emerging demand trends and country-level import patterns while integrating macroeconomic and trade datasets such as GDP and population forecasts, bilateral import–export flows, tariff structures, elasticity differentials between developed and developing economies, geographic distance, and import demand projections. Using weighted trade values from 2020–2024 as the base period to project country-to-country export potential for 2030, these inputs are operationalized through calculated drivers such as gravity model parameters, tariff impact factors, and projected GDP per-capita growth. Through an analysis of hidden potentials, demand hotspots, and market conditions that are most favorable to success, this method enables firms to focus on target countries, maximize returns, and global expansion with data, backed by accuracy.
By factoring in the projected importer demand gap that is currently unmet and could be potential opportunity, it identifies the potential for the Exporter (Country) among 190 countries, against the general trade analysis, which identifies the biggest importer or exporter.
To discover high-growth global markets and optimize your business strategy:
Click Here
Pricing
- Single User License$ 1,995
- Department License$ 2,400
- Site License$ 3,120
- Global License$ 3,795

Leadership Perspectives from Industry Events
Search
Thought Leadership and Analyst Meet


Our Clients
6WResearch In News
- India Air Conditioner Market Set for Strong Rebound in 2026 After Weather-Led Correction and GST-Driven Recovery: 6Wresearch
- ADAS in India: How Automatic Emergency Braking, Blind Spot Detection & Driver Monitoring are Transforming Road Safety
- Doha a strategic location for EV manufacturing hub: IPA Qatar
- Demand for luxury TVs surging in the GCC, says Samsung
- Empowering Growth: The Thriving Journey of Bangladesh’s Cable Industry
- Demand for luxury TVs surging in the GCC, says Samsung
Latest Reports
- Nicaragua RPG Gaming Market (2026-2032)
- New Zealand RPG Gaming Market (2026-2032)
- Netherlands RPG Gaming Market (2026-2032)
- Nauru RPG Gaming Market (2026-2032)
- Namibia RPG Gaming Market (2026-2032)
- Mozambique RPG Gaming Market (2026-2032)
- Montenegro RPG Gaming Market (2026-2032)
- Mongolia RPG Gaming Market (2026-2032)
- Monaco RPG Gaming Market (2026-2032)
- Micronesia RPG Gaming Market (2026-2032)
Industry Events and Analyst Meet

EV India Expo 2026

HIMTEX 2026

India Refining Summit 2026

India EV Show 2026

EV tech India Expo 2026
Whitepaper
- Middle East & Africa Commercial Security Market Click here to view more.
- Middle East & Africa Fire Safety Systems & Equipment Market Click here to view more.
- GCC Drone Market Click here to view more.
- Middle East Lighting Fixture Market Click here to view more.
- GCC Physical & Perimeter Security Market Click here to view more.