Malaysia pharmaceuticals chemical Market (2026-2032) | Trends, Industry, Analysis, Share, Forecast, Companies, Size, Growth, Revenue, Value & Outlook
Market Forecast By Type (Basic building blocks , Advanced intermediates , Active ingredients), By Application (Cardiovascular , Neurology , Oncology , Infectious diseases, Metabolic system , Diabetes , Respiratory diseases , Other), By Sales Channel (Offline, Online) And Competitive Landscape
| Product Code: ETC018346 | Publication Date: Jun 2023 | Updated Date: Jun 2026 | Product Type: Report | |
| Publisher: 6Wresearch | Author: Ravi Bhandari | No. of Pages: 70 | No. of Figures: 35 | No. of Tables: 5 |
Malaysia pharmaceuticals chemical Market Summary
The malaysia pharmaceuticals chemical market was estimated at USD 391 Million in 2025 and is projected to reach USD 511 Million by 2032, growing at a CAGR of 5.6% from 2026 to 2032.
Malaysia pharmaceuticals chemical Market Year-wise Growth Rate and Key Drivers
This graph highlights how the Malaysia pharmaceuticals chemical Market has steadily grown over the past five years, supported by major growth factors.
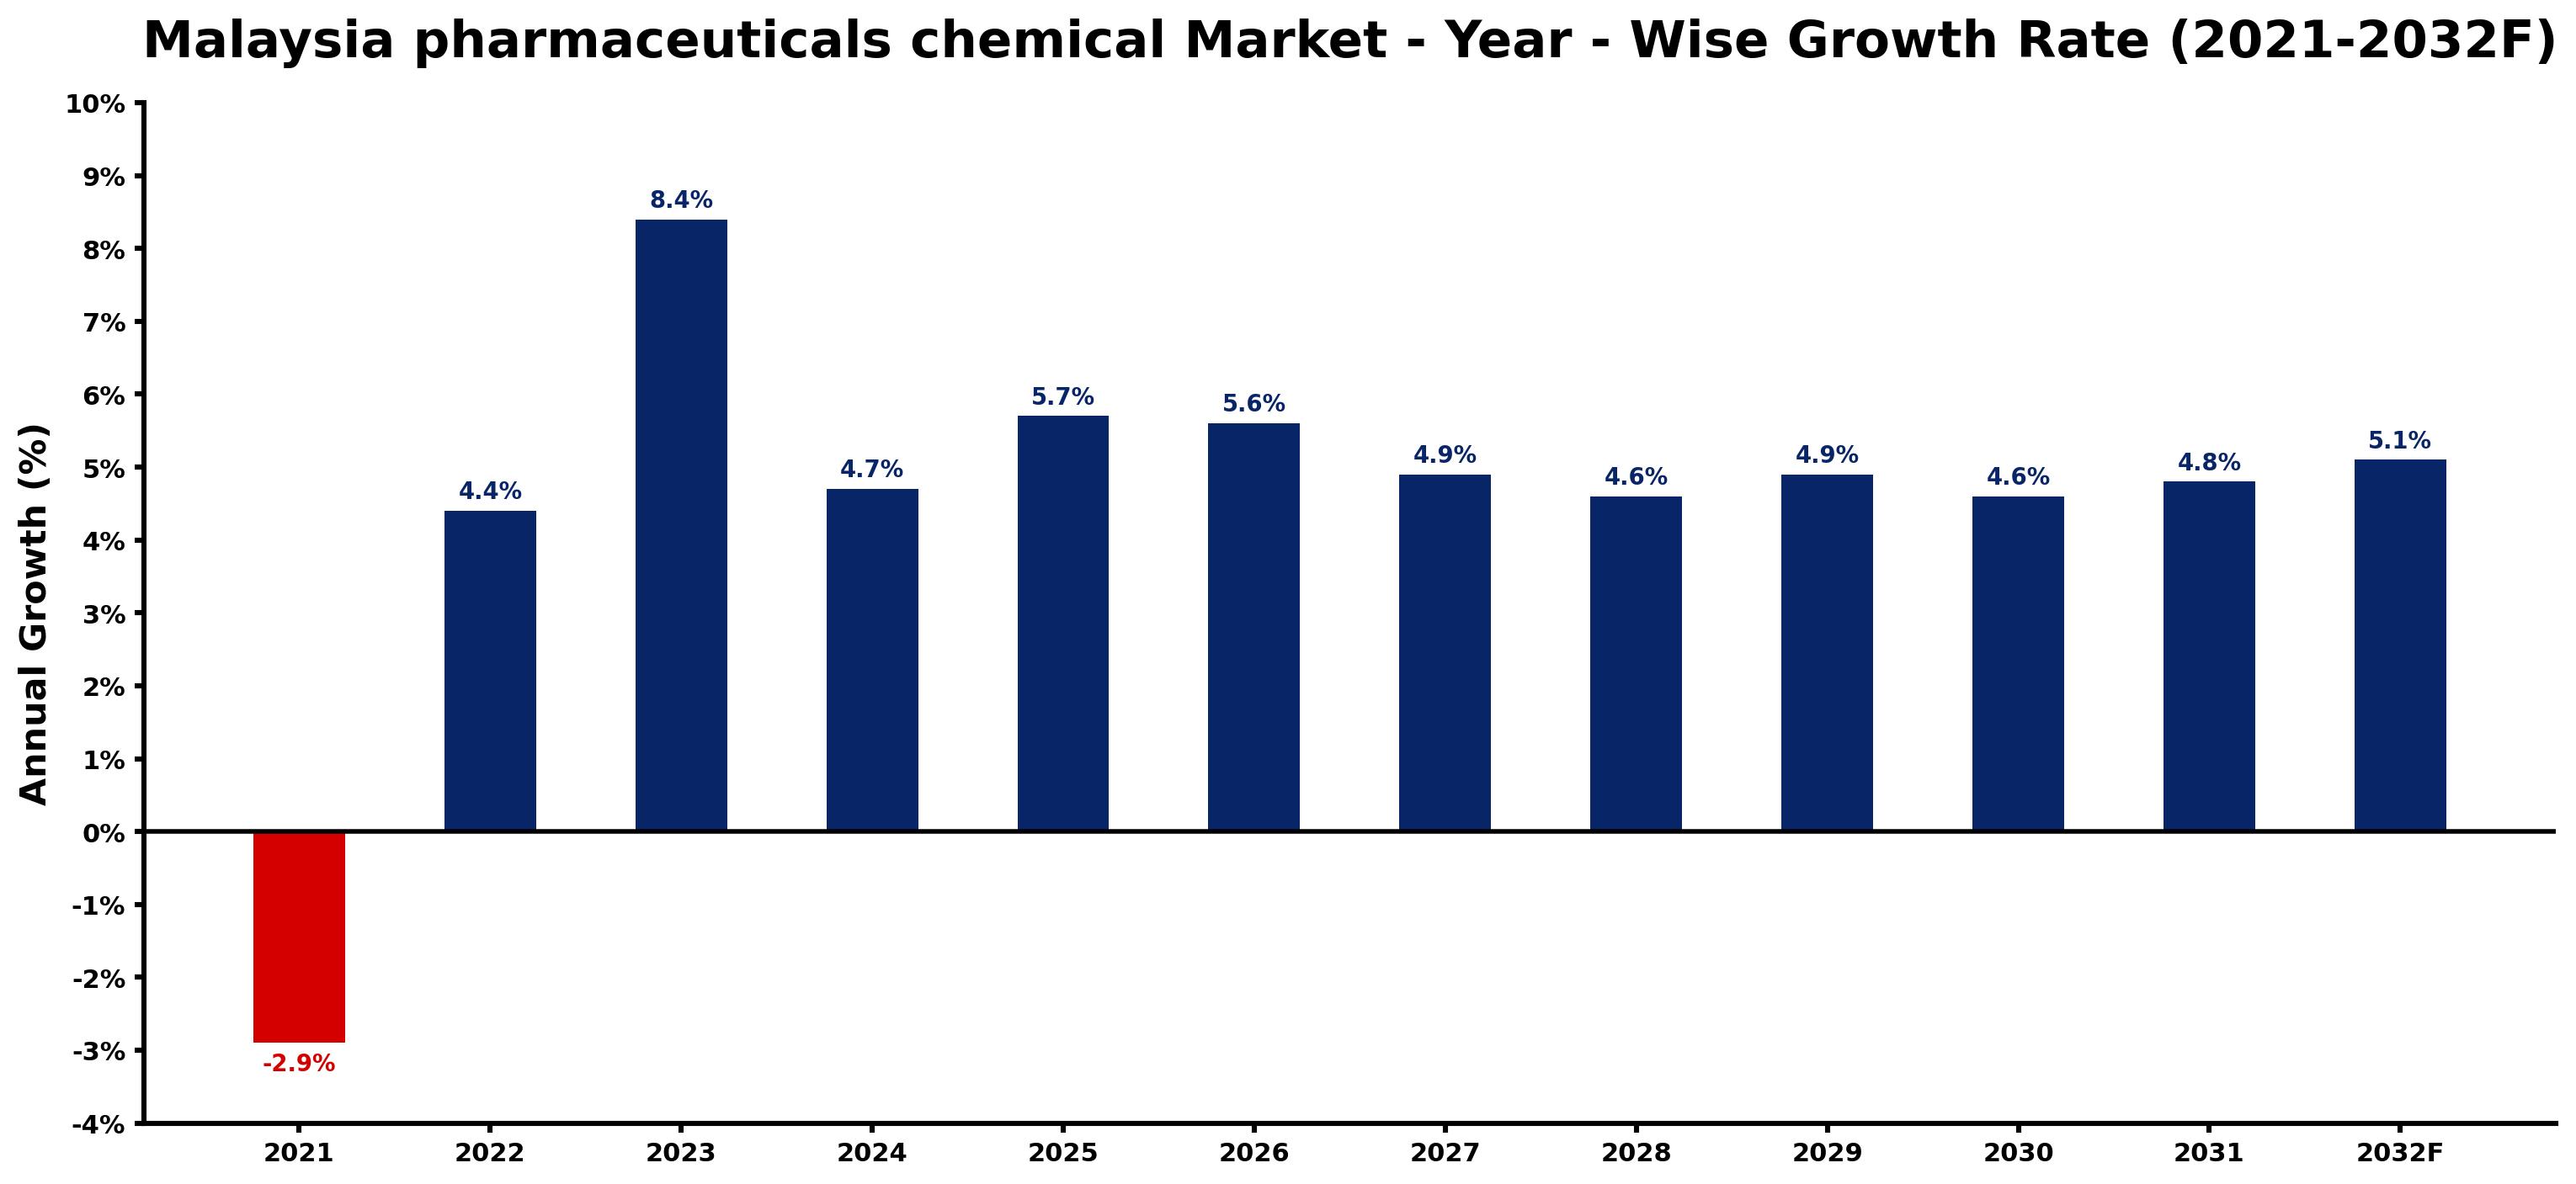
The table below presents the year wise growth rates along with the key drivers influencing the market
| Year | Growth Rate | Major Drivers |
| 2021 | -2.9% | Supply chain disruptions caused by the pandemic hindered production capacities and delayed product availability. |
| 2022 | 4.4% | Market players expanded R&D investments in innovative drug formulations and therapies. |
| 2023 | 8.4% | Emerging health awareness prompted greater consumer engagement with preventive medications. |
| 2024 | 4.7% | Digital health solutions began reshaping access to pharmaceutical products nationwide. |
| 2025 | 5.7% | Demand for generics surged as healthcare costs continued to strain household budgets. |
| 2026 | 5.6% | Collaboration between local startups and multinational firms fostered unique product developments. |
| 2027 | 4.9% | Technological integration streamlined supply chains, enhancing distribution efficacy across regions. |
| 2028 | 4.6% | Aging population created a sustained need for chronic disease management solutions. |
| 2029 | 4.9% | E-commerce platforms emerged as crucial channels for pharmaceutical product accessibility. |
| 2030 | 4.6% | Increased health insurance coverage expanded patient access to essential medications. |
| 2031 | 4.8% | Local manufacturing initiatives gained traction, reducing reliance on imported pharmaceutical products. |
| 2032 | 5.1% | Sustainability practices began influencing pharmaceutical production methods and supply chains. |
Note - Market size estimations and growth projections presented in this report are based on 6Wresearch's advanced forecasting approach, validated with industry datasets as of June 2026.
Malaysia pharmaceuticals chemical Market Synopsis
The Malaysia pharmaceuticals chemical Market is projected to reach 5.6% and witness significant growth during the forecast period (2026-2032). This growth can be attributed to several critical factors, including the rising prevalence of diseases, an increasing aged population, and proactive government initiatives aimed at improving access to medications. As Malaysia's healthcare landscape evolves, the commitment to advancing pharmaceutical science through research and development will further accelerate market dynamics.
Malaysia pharmaceuticals chemical Market Growth Drivers
The expansion of the Malaysia pharmaceuticals chemical Market is primarily driven by a combination of demographic and economic factors. Key drivers include:
- The increasing incidence of chronic diseases such as diabetes, hypertension, and cardiovascular conditions is prompting a greater demand for pharmaceuticals and related chemicals.
- The aging population is leading to a higher consumption of medications, as older individuals typically require more healthcare resources.
- Government reforms aimed at enhancing access to healthcare and medications are positively influencing market growth, allowing a broader segment of the population to obtain necessary treatments.
- Investments in R&D activities focused on new drug formulations and innovative treatment methodologies are expected to propel market sales, as companies seek to meet evolving healthcare needs.
- Favorable regulations, including policies that control drug pricing, are improving the affordability and accessibility of pharmaceuticals for consumers, thereby boosting demand.
Malaysia pharmaceuticals chemical Market Trends and Opportunities
Emerging trends within the Malaysia pharmaceuticals chemical Market highlight significant opportunities for stakeholders. Key trends include:
- Growing emphasis on personalized medicine is encouraging research into targeted therapies that offer higher efficacy and fewer side effects for patients, thus creating new avenues for pharmaceutical development.
- The proliferation of digital health technologies, including telemedicine and health apps, is facilitating better patient engagement and adherence to medication regimens.
- Collaborative efforts between academic institutions and the private sector in R&D are fostering innovation and expediting the drug development process.
- Increasing awareness about preventive healthcare is driving demand for over-the-counter (OTC) medications and health supplements, expanding market opportunities.
- The push for sustainability in the pharmaceutical manufacturing processes is leading to increased investment in green chemistry and eco-friendly production methods.
Malaysia pharmaceuticals chemical Market Challenges and Restraints
Despite its promising outlook, the Malaysia pharmaceuticals chemical Market also faces several challenges that could impede growth. Key constraints include:
- Regulatory hurdles and lengthy approval processes for new drugs can delay market entry, affecting overall growth timelines.
- Intense competition from generic drugs can erode profit margins for innovative pharmaceutical products.
- Fluctuating raw material prices may impact production costs, presenting challenges for manufacturers in maintaining profitability.
- Cultural and regional disparities in healthcare access can limit market penetration and adoption in certain demographics.
- The need for continuous investment in R&D requires substantial financial commitment, which may strain resources, especially for smaller firms.
Malaysia pharmaceuticals chemical Market Government Investment and Initiatives
The Malaysian government is actively investing in the pharmaceuticals chemical sector through various initiatives aimed at enhancing health outcomes across the nation. Recent efforts include:
- Implementation of the National Medicines Policy, which focuses on improving the availability, affordability, and quality of medicines.
- Encouraging public-private partnerships to bolster R&D efforts, thereby driving innovation and the development of new pharmaceuticals.
- Support for local manufacturers through grants and incentives aimed at fostering domestic production capabilities.
- Investment in healthcare infrastructure to ensure that medical facilities are equipped with the necessary resources to support pharmaceutical distribution and accessibility.
- Promotion of policies that favor the production of generic medications to enhance competition and reduce costs for consumers.
Malaysia pharmaceuticals chemical Market Latest Developments (May 2025 - June 2026)
During the period from May 2025 to June 2026, the Malaysia pharmaceuticals chemical Market has observed several noteworthy developments. These include:
- Increased collaboration between the government and healthcare providers aimed at streamlining drug distribution channels to enhance accessibility for patients.
- Emergence of new regulatory frameworks promoting the use of telepharmacy practices, enabling pharmaceutical consultations and medication management remotely.
- Launch of several public health campaigns aimed at raising awareness about chronic diseases and the importance of adherence to prescribed treatment plans.
- Significant investments in biotechnology research initiatives that focus on developing biologics and biosimilars to meet the growing healthcare needs.
- Ongoing discussions about reforming pricing strategies for essential medications, aiming to balance affordability with fair returns for manufacturers.
Malaysia pharmaceuticals chemical Market - Key Attractiveness of the Report
- 10 Years of Market Numbers
- Historical Data Starting from 2022 to 2025
- Base Year: 2025
- Forecast Data until 2032
- Key Performance Indicators Impacting the Market
- Major Upcoming Developments and Projects
Key Highlights of the Report:
- Malaysia pharmaceuticals chemical Market Outlook
- Market Size of Malaysia pharmaceuticals chemical Market, 2025
- Forecast of Malaysia pharmaceuticals chemical Market, 2032F
- Historical Data and Forecast of Malaysia pharmaceuticals chemical Revenues & Volume for the Period 2022-2032F
- Malaysia pharmaceuticals chemical Market Trend Evolution
- Malaysia pharmaceuticals chemical Market Drivers and Challenges
- Malaysia pharmaceuticals chemical Price Trends
- Malaysia pharmaceuticals chemical Porter's Five Forces
- Malaysia pharmaceuticals chemical Industry Life Cycle
- Historical Data and Forecast of Malaysia pharmaceuticals chemical Market Revenues & Volume By Type for the Period 2022-2032F
- Historical Data and Forecast of Malaysia pharmaceuticals chemical Market Revenues & Volume By Basic building blocks for the Period 2022-2032F
- Historical Data and Forecast of Malaysia pharmaceuticals chemical Market Revenues & Volume By Advanced intermediates for the Period 2022-2032F
- Historical Data and Forecast of Malaysia pharmaceuticals chemical Market Revenues & Volume By Active ingredients for the Period 2022-2032F
- Historical Data and Forecast of Malaysia pharmaceuticals chemical Market Revenues & Volume By Application for the Period 2022-2032F
- Historical Data and Forecast of Malaysia pharmaceuticals chemical Market Revenues & Volume By Cardiovascular for the Period 2022-2032F
- Historical Data and Forecast of Malaysia pharmaceuticals chemical Market Revenues & Volume By Neurology for the Period 2022-2032F
- Historical Data and Forecast of Malaysia pharmaceuticals chemical Market Revenues & Volume By Oncology for the Period 2022-2032F
- Historical Data and Forecast of Malaysia pharmaceuticals chemical Market Revenues & Volume By Infectious diseases for the Period 2022-2032F
- Historical Data and Forecast of Malaysia pharmaceuticals chemical Market Revenues & Volume By Metabolic system for the Period 2022-2032F
- Historical Data and Forecast of Malaysia pharmaceuticals chemical Market Revenues & Volume By Diabetes for the Period 2022-2032F
- Historical Data and Forecast of Malaysia pharmaceuticals chemical Market Revenues & Volume By Respiratory diseases for the Period 2022-2032F
- Historical Data and Forecast of Malaysia pharmaceuticals chemical Market Revenues & Volume By Other for the Period 2022-2032F
- Historical Data and Forecast of Malaysia pharmaceuticals chemical Market Revenues & Volume By Sales Channel for the Period 2022-2032F
- Historical Data and Forecast of Malaysia pharmaceuticals chemical Market Revenues & Volume By Offline for the Period 2022-2032F
- Historical Data and Forecast of Malaysia pharmaceuticals chemical Market Revenues & Volume By Online for the Period 2022-2032F
- Malaysia pharmaceuticals chemical Import Export Trade Statistics
- Market Opportunity Assessment By Type
- Market Opportunity Assessment By Application
- Market Opportunity Assessment By Sales Channel
- Malaysia pharmaceuticals chemical Top Companies Market Share
- Malaysia pharmaceuticals chemical Competitive Benchmarking By Technical and Operational Parameters
- Malaysia pharmaceuticals chemical Company Profiles
- Malaysia pharmaceuticals chemical Key Strategic Recommendations
Frequently Asked Questions About the Market Study (FAQs):
A1: The Malaysia pharmaceuticals chemical Market is expected to witness a CAGR of 4.8% from 2026 to 2032.
A2: Key growth drivers include rising disease prevalence, an aging population, increased government initiatives for medication access, and significant investments in R&D.
A3: Favorable government policies, including drug price controls, are improving accessibility and affordability for consumers, sustaining demand for pharmaceuticals and chemicals.
A4: Challenges include regulatory hurdles, competition from generics, fluctuating raw material prices, and the financial demands of continuous R&D investment.
6Wresearch actively monitors the Malaysia pharmaceuticals chemical Market and publishes its comprehensive annual report, highlighting emerging trends, growth drivers, revenue analysis, and forecast outlook. Our insights help businesses to make data-backed strategic decisions with ongoing market dynamics. Our analysts track relevent industries related to the Malaysia pharmaceuticals chemical Market, allowing our clients with actionable intelligence and reliable forecasts tailored to emerging regional needs.
Yes, we provide customisation as per your requirements. To learn more, feel free to contact us on sales@6wresearch.com
1 Executive Summary |
2 Introduction |
2.1 Key Highlights of the Report |
2.2 Report Description |
2.3 Market Scope & Segmentation |
2.4 Research Methodology |
2.5 Assumptions |
3 Malaysia pharmaceuticals chemical Market Overview |
3.1 Malaysia Country Macro Economic Indicators |
3.2 Malaysia pharmaceuticals chemical Market Revenues & Volume, 2022 & 2032F |
3.3 Malaysia pharmaceuticals chemical Market - Industry Life Cycle |
3.4 Malaysia pharmaceuticals chemical Market - Porter's Five Forces |
3.5 Malaysia pharmaceuticals chemical Market Revenues & Volume Share, By Type, 2022 & 2032F |
3.6 Malaysia pharmaceuticals chemical Market Revenues & Volume Share, By Application, 2022 & 2032F |
3.7 Malaysia pharmaceuticals chemical Market Revenues & Volume Share, By Sales Channel, 2022 & 2032F |
4 Malaysia pharmaceuticals chemical Market Dynamics |
4.1 Impact Analysis |
4.2 Market Drivers |
4.3 Market Restraints |
5 Malaysia pharmaceuticals chemical Market Trends |
6 Malaysia pharmaceuticals chemical Market, By Types |
6.1 Malaysia pharmaceuticals chemical Market, By Type |
6.1.1 Overview and Analysis |
6.1.2 Malaysia pharmaceuticals chemical Market Revenues & Volume, By Type, 2022-2032F |
6.1.3 Malaysia pharmaceuticals chemical Market Revenues & Volume, By Basic building blocks , 2022-2032F |
6.1.4 Malaysia pharmaceuticals chemical Market Revenues & Volume, By Advanced intermediates , 2022-2032F |
6.1.5 Malaysia pharmaceuticals chemical Market Revenues & Volume, By Active ingredients, 2022-2032F |
6.2 Malaysia pharmaceuticals chemical Market, By Application |
6.2.1 Overview and Analysis |
6.2.2 Malaysia pharmaceuticals chemical Market Revenues & Volume, By Cardiovascular , 2022-2032F |
6.2.3 Malaysia pharmaceuticals chemical Market Revenues & Volume, By Neurology , 2022-2032F |
6.2.4 Malaysia pharmaceuticals chemical Market Revenues & Volume, By Oncology , 2022-2032F |
6.2.5 Malaysia pharmaceuticals chemical Market Revenues & Volume, By Infectious diseases, 2022-2032F |
6.2.6 Malaysia pharmaceuticals chemical Market Revenues & Volume, By Metabolic system , 2022-2032F |
6.2.7 Malaysia pharmaceuticals chemical Market Revenues & Volume, By Diabetes , 2022-2032F |
6.2.8 Malaysia pharmaceuticals chemical Market Revenues & Volume, By Other, 2022-2032F |
6.2.9 Malaysia pharmaceuticals chemical Market Revenues & Volume, By Other, 2022-2032F |
6.3 Malaysia pharmaceuticals chemical Market, By Sales Channel |
6.3.1 Overview and Analysis |
6.3.2 Malaysia pharmaceuticals chemical Market Revenues & Volume, By Offline, 2022-2032F |
6.3.3 Malaysia pharmaceuticals chemical Market Revenues & Volume, By Online, 2022-2032F |
7 Malaysia pharmaceuticals chemical Market Import-Export Trade Statistics |
7.1 Malaysia pharmaceuticals chemical Market Export to Major Countries |
7.2 Malaysia pharmaceuticals chemical Market Imports from Major Countries |
8 Malaysia pharmaceuticals chemical Market Key Performance Indicators |
9 Malaysia pharmaceuticals chemical Market - Opportunity Assessment |
9.1 Malaysia pharmaceuticals chemical Market Opportunity Assessment, By Type, 2022 & 2032F |
9.2 Malaysia pharmaceuticals chemical Market Opportunity Assessment, By Application, 2022 & 2032F |
9.3 Malaysia pharmaceuticals chemical Market Opportunity Assessment, By Sales Channel, 2022 & 2032F |
10 Malaysia pharmaceuticals chemical Market - Competitive Landscape |
10.1 Malaysia pharmaceuticals chemical Market Revenue Share, By Companies, 2025 |
10.2 Malaysia pharmaceuticals chemical Market Competitive Benchmarking, By Operating and Technical Parameters |
11 Company Profiles |
12 Recommendations |
13 Disclaimer |
Global Go To Market Strategy - 2030
Export potential enables firms to identify high-growth global markets with greater confidence by combining advanced trade intelligence with a structured quantitative methodology. The framework analyzes emerging demand trends and country-level import patterns while integrating macroeconomic and trade datasets such as GDP and population forecasts, bilateral import–export flows, tariff structures, elasticity differentials between developed and developing economies, geographic distance, and import demand projections. Using weighted trade values from 2020–2024 as the base period to project country-to-country export potential for 2030, these inputs are operationalized through calculated drivers such as gravity model parameters, tariff impact factors, and projected GDP per-capita growth. Through an analysis of hidden potentials, demand hotspots, and market conditions that are most favorable to success, this method enables firms to focus on target countries, maximize returns, and global expansion with data, backed by accuracy.
By factoring in the projected importer demand gap that is currently unmet and could be potential opportunity, it identifies the potential for the Exporter (Country) among 190 countries, against the general trade analysis, which identifies the biggest importer or exporter.
To discover high-growth global markets and optimize your business strategy:
Click Here
Pricing
- Single User License$ 1,995
- Department License$ 2,400
- Site License$ 3,120
- Global License$ 3,795

Leadership Perspectives from Industry Events
Search
Thought Leadership and Analyst Meet


Our Clients
6WResearch In News
- India Air Conditioner Market Set for Strong Rebound in 2026 After Weather-Led Correction and GST-Driven Recovery: 6Wresearch
- ADAS in India: How Automatic Emergency Braking, Blind Spot Detection & Driver Monitoring are Transforming Road Safety
- Doha a strategic location for EV manufacturing hub: IPA Qatar
- Demand for luxury TVs surging in the GCC, says Samsung
- Empowering Growth: The Thriving Journey of Bangladesh’s Cable Industry
- Demand for luxury TVs surging in the GCC, says Samsung
Latest Reports
- Nicaragua RPG Gaming Market (2026-2032)
- New Zealand RPG Gaming Market (2026-2032)
- Netherlands RPG Gaming Market (2026-2032)
- Nauru RPG Gaming Market (2026-2032)
- Namibia RPG Gaming Market (2026-2032)
- Mozambique RPG Gaming Market (2026-2032)
- Montenegro RPG Gaming Market (2026-2032)
- Mongolia RPG Gaming Market (2026-2032)
- Monaco RPG Gaming Market (2026-2032)
- Micronesia RPG Gaming Market (2026-2032)
Industry Events and Analyst Meet

EV India Expo 2026

HIMTEX 2026

India Refining Summit 2026

India EV Show 2026

EV tech India Expo 2026
Whitepaper
- Middle East & Africa Commercial Security Market Click here to view more.
- Middle East & Africa Fire Safety Systems & Equipment Market Click here to view more.
- GCC Drone Market Click here to view more.
- Middle East Lighting Fixture Market Click here to view more.
- GCC Physical & Perimeter Security Market Click here to view more.