Malaysia Sand & Gravel Market (2026-2032) Outlook | Growth, Forecast, Size, Share, Companies, Value, Trends, Industry, Analysis & Revenue
Market Forecast By Product Type (Coarse Crushed Limestone Gravel, Pit Or Coarse Sand, Crushed Clean Stone, Fine Limestone Gravel, River Sand), By End Users (Glass, Road Construction, Mining, Foundry, Others) And Competitive Landscape
| Product Code: ETC304526 | Publication Date: Aug 2022 | Updated Date: Jul 2026 | Product Type: Market Research Report | |
| Publisher: 6Wresearch | Author: Ravi Bhandari | No. of Pages: 75 | No. of Figures: 35 | No. of Tables: 20 |
Malaysia Sand & Gravel Market Size, Share & Growth Rate
The Malaysia Sand & Gravel Market was estimated at USD 267 Million in 2025 and is projected to reach USD 348 Million by 2032, growing at a CAGR of 3.9% from 2026 to 2032. This growth trajectory is primarily driven by the steady demand stemming from extensive infrastructure development projects across the nation. As urbanization accelerates and construction activities proliferate, the need for high-quality sand and gravel remains robust, underscoring the market's resilience in the face of evolving challenges.
Malaysia Sand & Gravel Market Year-wise Growth Rate and Key Drivers
This graph highlights how the Malaysia Sand & Gravel Market has steadily grown over the years, supported by major growth factors.
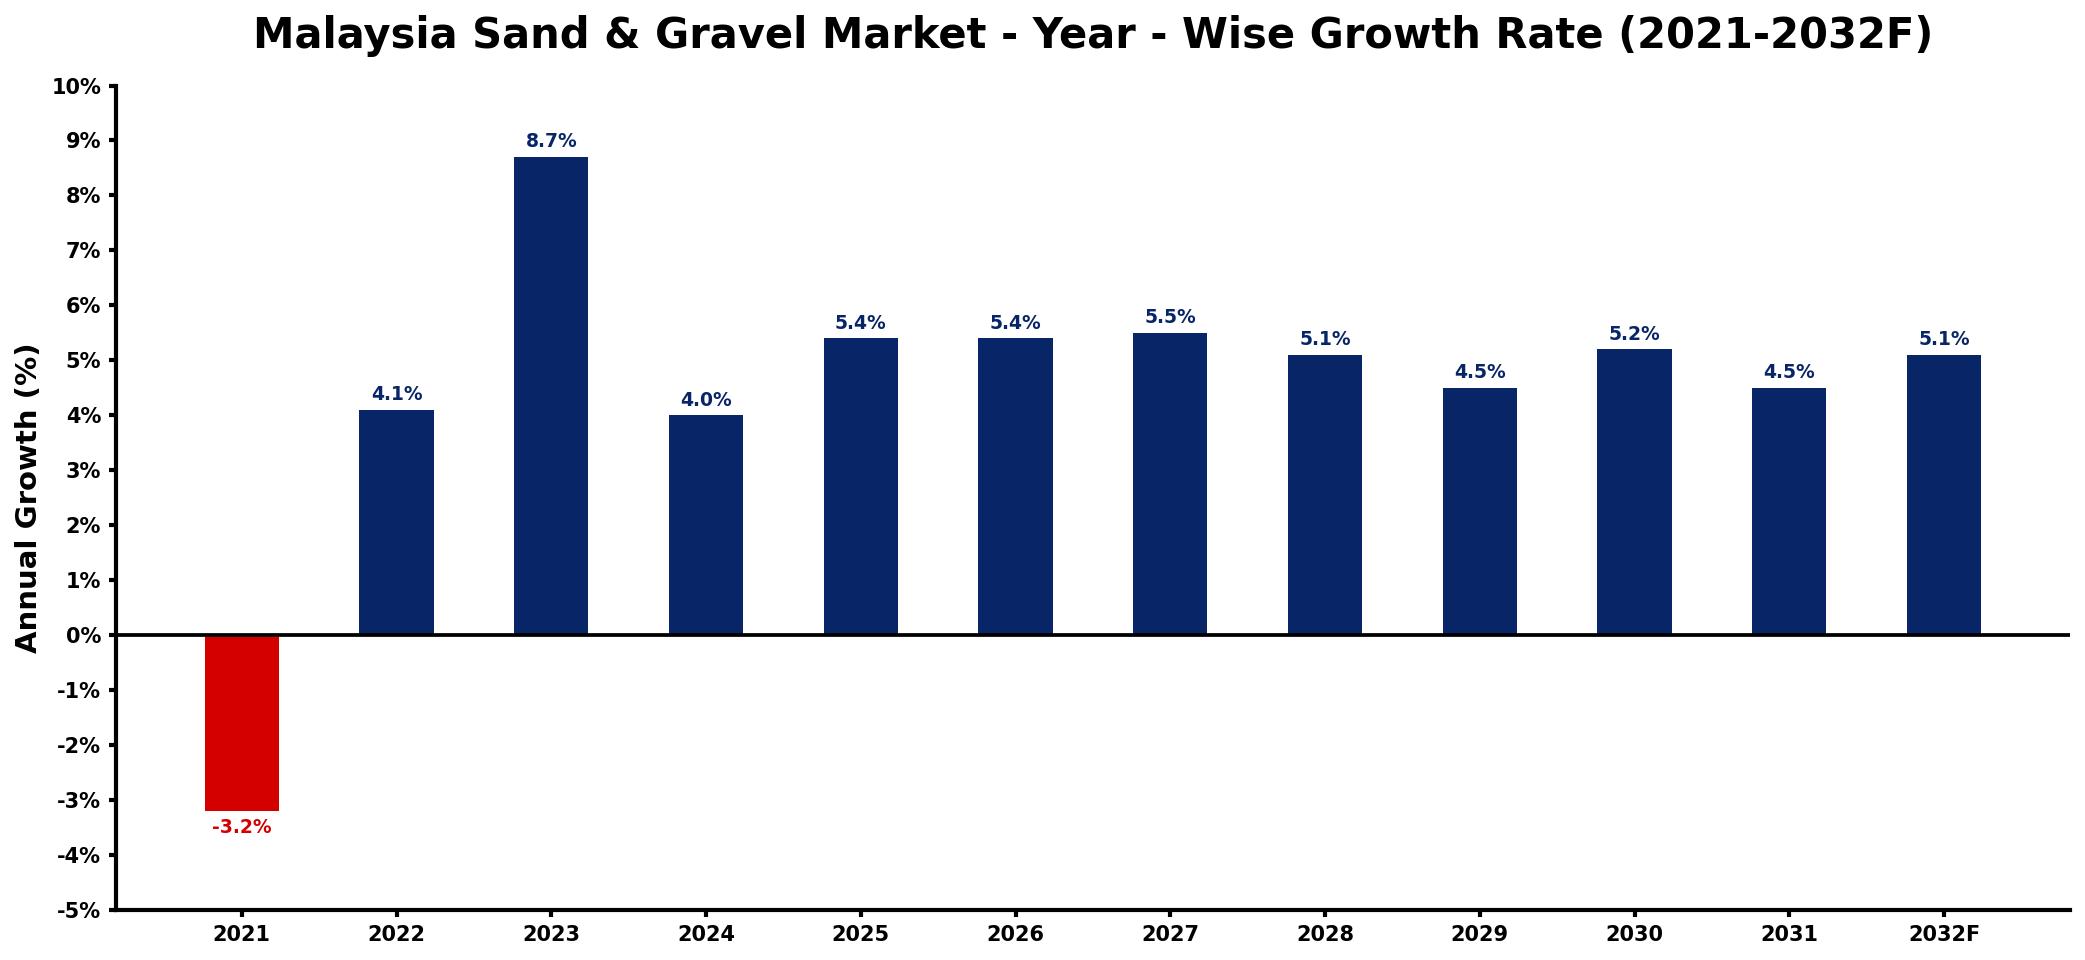
The table below presents the year‑wise growth rates along with the key drivers influencing the market
| Year | Growth Rate | Major Drivers |
| 2021 | -3.2% | Construction projects experiencing slowdown |
| 2022 | 4.1% | Infrastructure investments gaining momentum |
| 2023 | 8.7% | Residential development projects expanding |
| 2024 | 4.0% | Government initiatives boosting construction |
| 2025 | 5.4% | Urbanization driving demand surge |
| 2026 | 5.4% | Renewable energy projects increasing |
| 2027 | 5.5% | Public transportation projects advancing |
| 2028 | 5.1% | Economic recovery stimulating investments |
| 2029 | 4.5% | Real estate market thriving steadily |
| 2030 | 5.2% | Industrial growth enhancing demand levels |
| 2031 | 4.5% | Sustainable construction practices rising |
| 2032 | 5.1% | Technological advancements improving efficiency |
Note: Market size estimations and growth projections presented in this report are based on 6Wresearch's proprietary forecasting methodology, utilizing the latest available industry data, government publications, and primary research inputs.
Malaysia Sand & Gravel Market Synopsis
The most significant force shaping the Malaysia Sand & Gravel Market is the continuous investment in infrastructure development. Projects such as highways, bridges, and urban developments drive demand, ensuring a stable flow of construction activities that require these essential materials.
Additionally, the market is witnessing a shift toward sustainable sourcing practices, propelled by growing environmental concerns. Companies are increasingly focusing on responsible extraction methods and alternative materials to mitigate the negative impacts of sand mining, reshaping the competitive landscape.
- The market is projected to grow steadily due to ongoing infrastructure investments.
- Environmental sustainability is becoming a key focus for industry stakeholders.
- Post-COVID recovery has spurred a resurgence in construction activities.
- The need for eco-friendly practices is driving innovation in the sourcing of raw materials.
- Regulatory frameworks are tightening, influencing operational strategies in the market.
Despite its growth potential, the Malaysia Sand & Gravel Market faces significant restraints, chiefly concerning environmental sustainability and resource management. The increasing awareness of the adverse ecological effects associated with sand mining has prompted governments to implement stricter regulations and permitting processes. Companies must now invest in sustainable practices and land reclamation initiatives to comply with these regulations, which can raise operational costs and affect profitability. Furthermore, fluctuations in construction activity can lead to unpredictable demand, complicating planning for resource extraction.
Emerging trends in the Malaysia Sand & Gravel Market indicate a growing inclination towards technology-driven solutions in extraction and processing methods. Companies are increasingly adopting advanced equipment and software for efficient resource management. Additionally, the push for eco-friendly materials is leading to innovation in alternative aggregates, as firms explore options like recycled concrete and industrial by-products. Consumer preferences are shifting towards green construction practices, further influencing suppliers to align their operations with sustainability goals.
Opportunities for growth in the Malaysia Sand & Gravel Market are abundant, particularly in the context of urbanization and government infrastructure initiatives. Investments in smart cities, public transport systems, and renewable energy projects present lucrative avenues for market participants. Additionally, the increasing emphasis on sustainability creates openings for firms to differentiate themselves through innovative, environmentally friendly products. Companies that adapt swiftly to these changes can capture new market segments and enhance their competitive advantage.
The Malaysian government is actively promoting infrastructure development through various initiatives, enhancing public spending on construction projects. Programs aimed at improving transportation networks and urban facilities are at the forefront of national development strategies. These efforts not only stimulate demand for sand and gravel but also align with sustainability targets, encouraging responsible sourcing and environmental stewardship within the industry.
Looking ahead to 2026-2032, the Malaysia Sand & Gravel Market is poised for growth, driven by ongoing urbanization and the continued commitment to infrastructure enhancement. The integration of sustainable practices will play a pivotal role in shaping industry dynamics, with companies that prioritize eco-friendliness likely to thrive. As new technologies emerge, the market will also witness shifts in material sourcing and processing techniques, further influencing supply chain strategies and competitive positioning.
Recent developments in the Malaysia Sand & Gravel Market reflect a dynamic industry responding to regulatory changes and sustainability pressures. Companies are increasingly investing in technologies aimed at enhancing the efficiency of extraction processes while minimizing environmental impact. Additionally, collaborations between government and private sectors are emerging to develop green construction initiatives, marking a significant step toward a more sustainable approach in resource utilization.
- 10 Years of Market Numbers
- Historical Data Starting from 2022 to 2025
- Base Year: 2025
- Forecast Data until 2032
- Key Performance Indicators Impacting the Market
- Major Upcoming Developments and Projects
Key Highlights of the Report:
- Malaysia Sand & Gravel Market Outlook
- Market Size of Malaysia Sand & Gravel Market, 2025
- Forecast of Malaysia Sand & Gravel Market, 2032
- Historical Data and Forecast of Malaysia Sand & Gravel Revenues & Volume for the Period 2022-2032F
- Malaysia Sand & Gravel Market Trend Evolution
- Malaysia Sand & Gravel Market Drivers and Challenges
- Malaysia Sand & Gravel Price Trends
- Malaysia Sand & Gravel Porter's Five Forces
- Malaysia Sand & Gravel Industry Life Cycle
- Historical Data and Forecast of Malaysia Sand & Gravel Market Revenues & Volume By Product Type for the Period 2022-2032F
- Historical Data and Forecast of Malaysia Sand & Gravel Market Revenues & Volume By Coarse Crushed Limestone Gravel for the Period 2022-2032F
- Historical Data and Forecast of Malaysia Sand & Gravel Market Revenues & Volume By Pit Or Coarse Sand for the Period 2022-2032F
- Historical Data and Forecast of Malaysia Sand & Gravel Market Revenues & Volume By Crushed Clean Stone for the Period 2022-2032F
- Historical Data and Forecast of Malaysia Sand & Gravel Market Revenues & Volume By Fine Limestone Gravel for the Period 2022-2032F
- Historical Data and Forecast of Malaysia Sand & Gravel Market Revenues & Volume By River Sand for the Period 2022-2032F
- Historical Data and Forecast of Malaysia Sand & Gravel Market Revenues & Volume By End Users for the Period 2022-2032F
- Historical Data and Forecast of Malaysia Sand & Gravel Market Revenues & Volume By Glass for the Period 2022-2032F
- Historical Data and Forecast of Malaysia Sand & Gravel Market Revenues & Volume By Road Construction for the Period 2022-2032F
- Historical Data and Forecast of Malaysia Sand & Gravel Market Revenues & Volume By Mining for the Period 2022-2032F
- Historical Data and Forecast of Malaysia Sand & Gravel Market Revenues & Volume By Foundry for the Period 2022-2032F
- Historical Data and Forecast of Malaysia Sand & Gravel Market Revenues & Volume By Others for the Period 2022-2032F
- Malaysia Sand & Gravel Import Export Trade Statistics
- Market Opportunity Assessment By Product Type
- Market Opportunity Assessment By End Users
- Malaysia Sand & Gravel Top Companies Market Share
- Malaysia Sand & Gravel Competitive Benchmarking By Technical and Operational Parameters
- Malaysia Sand & Gravel Company Profiles
- Malaysia Sand & Gravel Key Strategic Recommendations
Frequently Asked Questions About the Market Study (FAQs):
Demand in Malaysia is primarily driven by ongoing infrastructure projects, including roads, bridges, and urban development, which require significant quantities of sand and gravel. These projects ensure consistent consumption of these materials, fostering steady market growth.
The pandemic temporarily slowed construction activities, causing disruptions in supply chains. However, with the resumption of projects, there is a strong rebound in demand as urbanization and infrastructure investment gain momentum in the post-pandemic landscape.
The Malaysia Sand & Gravel Market was estimated at USD 267 Million in 2025 and is projected to reach USD 348 Million by 2032, growing at a CAGR of 3.9% from 2026 to 2032.
Companies are increasingly focusing on sustainable extraction methods, responsible sourcing, and exploring alternative materials to mitigate the environmental impact of sand mining. This shift is becoming critical for compliance with stricter regulations and consumer preferences for eco-friendly practices.
Government policies focused on infrastructure development and sustainability are vital in shaping the market. Investments in public infrastructure and initiatives promoting green practices drive demand for sand and gravel while ensuring responsible resource management.
6Wresearch actively monitors the Malaysia Sand & Gravel Market and publishes its comprehensive annual report, highlighting emerging trends, growth drivers, revenue analysis, and forecast outlook. Our insights help businesses to make data-backed strategic decisions with ongoing market dynamics. Our analysts track relevent industries related to the Malaysia Sand & Gravel Market, allowing our clients with actionable intelligence and reliable forecasts tailored to emerging regional needs.
Yes, we provide customisation as per your requirements. To learn more, feel free to contact us on sales@6wresearch.com
1 Executive Summary |
2 Introduction |
2.1 Key Highlights of the Report |
2.2 Report Description |
2.3 Market Scope & Segmentation |
2.4 Research Methodology |
2.5 Assumptions |
3 Malaysia Sand & Gravel Market Overview |
3.1 Malaysia Country Macro Economic Indicators |
3.2 Malaysia Sand & Gravel Market Revenues & Volume, 2022 & 2032F |
3.3 Malaysia Sand & Gravel Market - Industry Life Cycle |
3.4 Malaysia Sand & Gravel Market - Porter's Five Forces |
3.5 Malaysia Sand & Gravel Market Revenues & Volume Share, By Product Type, 2022 & 2032F |
3.6 Malaysia Sand & Gravel Market Revenues & Volume Share, By End Users, 2022 & 2032F |
4 Malaysia Sand & Gravel Market Dynamics |
4.1 Impact Analysis |
4.2 Market Drivers |
4.2.1 Rapid urbanization and infrastructure development in Malaysia |
4.2.2 Growing construction activities in residential, commercial, and industrial sectors |
4.2.3 Increase in government investments in infrastructure projects |
4.3 Market Restraints |
4.3.1 Environmental concerns and regulations related to sand mining |
4.3.2 Fluctuating prices of raw materials and transportation costs |
5 Malaysia Sand & Gravel Market Trends |
6 Malaysia Sand & Gravel Market, By Types |
6.1 Malaysia Sand & Gravel Market, By Product Type |
6.1.1 Overview and Analysis |
6.1.2 Malaysia Sand & Gravel Market Revenues & Volume, By Product Type, 2022-2032F |
6.1.3 Malaysia Sand & Gravel Market Revenues & Volume, By Coarse Crushed Limestone Gravel, 2022-2032F |
6.1.4 Malaysia Sand & Gravel Market Revenues & Volume, By Pit Or Coarse Sand, 2022-2032F |
6.1.5 Malaysia Sand & Gravel Market Revenues & Volume, By Crushed Clean Stone, 2022-2032F |
6.1.6 Malaysia Sand & Gravel Market Revenues & Volume, By Fine Limestone Gravel, 2022-2032F |
6.1.7 Malaysia Sand & Gravel Market Revenues & Volume, By River Sand, 2022-2032F |
6.2 Malaysia Sand & Gravel Market, By End Users |
6.2.1 Overview and Analysis |
6.2.2 Malaysia Sand & Gravel Market Revenues & Volume, By Glass, 2022-2032F |
6.2.3 Malaysia Sand & Gravel Market Revenues & Volume, By Road Construction, 2022-2032F |
6.2.4 Malaysia Sand & Gravel Market Revenues & Volume, By Mining, 2022-2032F |
6.2.5 Malaysia Sand & Gravel Market Revenues & Volume, By Foundry, 2022-2032F |
6.2.6 Malaysia Sand & Gravel Market Revenues & Volume, By Others, 2022-2032F |
7 Malaysia Sand & Gravel Market Import-Export Trade Statistics |
7.1 Malaysia Sand & Gravel Market Export to Major Countries |
7.2 Malaysia Sand & Gravel Market Imports from Major Countries |
8 Malaysia Sand & Gravel Market Key Performance Indicators |
8.1 Demand for sand and gravel from construction projects |
8.2 Number of infrastructure projects in the pipeline |
8.3 Adoption of sustainable practices in sand and gravel mining operations |
9 Malaysia Sand & Gravel Market - Opportunity Assessment |
9.1 Malaysia Sand & Gravel Market Opportunity Assessment, By Product Type, 2022 & 2032F |
9.2 Malaysia Sand & Gravel Market Opportunity Assessment, By End Users, 2022 & 2032F |
10 Malaysia Sand & Gravel Market - Competitive Landscape |
10.1 Malaysia Sand & Gravel Market Revenue Share, By Companies, 2025 |
10.2 Malaysia Sand & Gravel Market Competitive Benchmarking, By Operating and Technical Parameters |
11 Company Profiles |
12 Recommendations |
13 Disclaimer |
Global Go To Market Strategy - 2030
Export potential enables firms to identify high-growth global markets with greater confidence by combining advanced trade intelligence with a structured quantitative methodology. The framework analyzes emerging demand trends and country-level import patterns while integrating macroeconomic and trade datasets such as GDP and population forecasts, bilateral import–export flows, tariff structures, elasticity differentials between developed and developing economies, geographic distance, and import demand projections. Using weighted trade values from 2020–2024 as the base period to project country-to-country export potential for 2030, these inputs are operationalized through calculated drivers such as gravity model parameters, tariff impact factors, and projected GDP per-capita growth. Through an analysis of hidden potentials, demand hotspots, and market conditions that are most favorable to success, this method enables firms to focus on target countries, maximize returns, and global expansion with data, backed by accuracy.
By factoring in the projected importer demand gap that is currently unmet and could be potential opportunity, it identifies the potential for the Exporter (Country) among 190 countries, against the general trade analysis, which identifies the biggest importer or exporter.
To discover high-growth global markets and optimize your business strategy:
Click Here
Pricing
- Single User License$ 1,995
- Department License$ 2,400
- Site License$ 3,120
- Global License$ 3,795

Leadership Perspectives from Industry Events
Search
Thought Leadership and Analyst Meet


Our Clients
6WResearch In News
- India Air Conditioner Market Set for Strong Rebound in 2026 After Weather-Led Correction and GST-Driven Recovery: 6Wresearch
- ADAS in India: How Automatic Emergency Braking, Blind Spot Detection & Driver Monitoring are Transforming Road Safety
- Doha a strategic location for EV manufacturing hub: IPA Qatar
- Demand for luxury TVs surging in the GCC, says Samsung
- Empowering Growth: The Thriving Journey of Bangladesh’s Cable Industry
- Demand for luxury TVs surging in the GCC, says Samsung
Latest Reports
- Nicaragua RPG Gaming Market (2026-2032)
- New Zealand RPG Gaming Market (2026-2032)
- Netherlands RPG Gaming Market (2026-2032)
- Nauru RPG Gaming Market (2026-2032)
- Namibia RPG Gaming Market (2026-2032)
- Mozambique RPG Gaming Market (2026-2032)
- Montenegro RPG Gaming Market (2026-2032)
- Mongolia RPG Gaming Market (2026-2032)
- Monaco RPG Gaming Market (2026-2032)
- Micronesia RPG Gaming Market (2026-2032)
Industry Events and Analyst Meet

EV India Expo 2026

HIMTEX 2026

India Refining Summit 2026

India EV Show 2026

EV tech India Expo 2026
Whitepaper
- Middle East & Africa Commercial Security Market Click here to view more.
- Middle East & Africa Fire Safety Systems & Equipment Market Click here to view more.
- GCC Drone Market Click here to view more.
- Middle East Lighting Fixture Market Click here to view more.
- GCC Physical & Perimeter Security Market Click here to view more.