Malaysia Silica Sand For Glass Making Market (2026-2032) Outlook | Growth, Industry, Size, Trends, Value, Analysis, Revenue, Forecast, Share & Companies
Market Forecast By Application (Flat Glass, Fiber Glass, Glass Containers, Special & Technical, Tableware Glass, Others), By Purity (High Purity, Ultra High Purity) And Competitive Landscape
| Product Code: ETC346586 | Publication Date: Aug 2022 | Updated Date: Jul 2026 | Product Type: Market Research Report | |
| Publisher: 6Wresearch | Author: Ravi Bhandari | No. of Pages: 75 | No. of Figures: 35 | No. of Tables: 20 |
Malaysia Silica Sand For Glass Making Market Size, Share & Growth Rate
The Malaysia Silica Sand For Glass Making Market was estimated at USD 369 Million in 2025 and is projected to reach USD 480 Million by 2032, growing at a CAGR of 3.8% from 2026 to 2032. This growth trajectory is primarily fueled by the increasing demand from the construction and automotive sectors, where high-quality glass products are essential. As the glass industry in Malaysia continues to expand, manufacturers are more focused than ever on sourcing high-purity silica sand to meet rigorous industry standards, alongside an urgent shift towards sustainable production practices.
Malaysia Silica Sand For Glass Making Market Year-wise Growth Rate and Key Drivers
This graph highlights how the Malaysia Silica Sand For Glass Making Market has steadily grown over the years, supported by major growth factors.
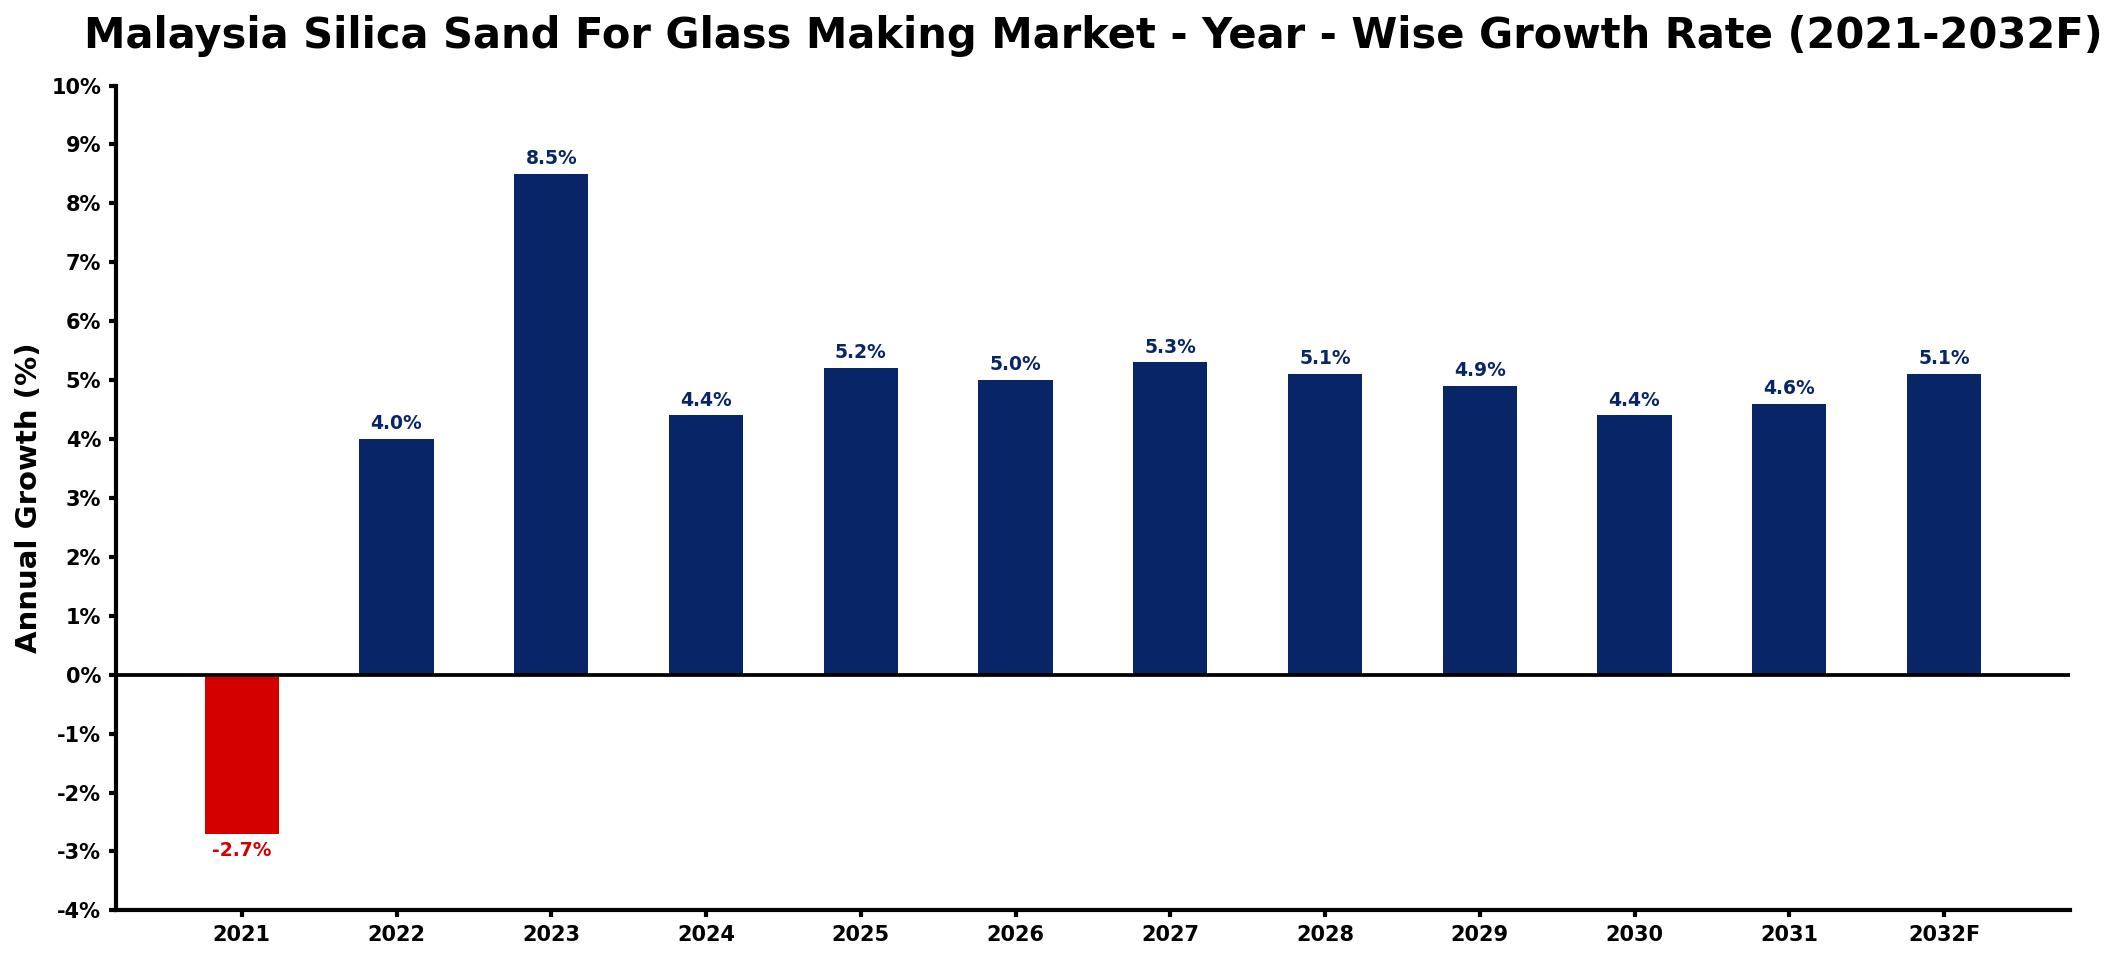
The table below presents the year‑wise growth rates along with the key drivers influencing the market
| Year | Growth Rate | Major Drivers |
| 2021 | -2.7% | Construction sector demand declines significantly |
| 2022 | 4.0% | Renewable energy projects increase investments |
| 2023 | 8.5% | Infrastructure development projects expand rapidly |
| 2024 | 4.4% | Manufacturing sector shows robust growth |
| 2025 | 5.2% | Export opportunities increase for products |
| 2026 | 5.0% | Technological advancements drive production efficiency |
| 2027 | 5.3% | Urbanization trends boost construction activities |
| 2028 | 5.1% | Rising consumer spending enhances demand |
| 2029 | 4.9% | Automotive industry experiences significant growth |
| 2030 | 4.4% | Government initiatives support industrial expansion |
| 2031 | 4.6% | Research and development investments rise |
| 2032 | 5.1% | Sustainability practices drive new markets |
Note: Market size estimations and growth projections presented in this report are based on 6Wresearch's proprietary forecasting methodology, utilizing the latest available industry data, government publications, and primary research inputs.
Malaysia Silica Sand For Glass Making Market Synopsis
The demand for silica sand in glass production is critical, particularly as the construction boom in Malaysia creates a higher need for quality glass products. With the government pushing for infrastructure development and urbanization, the glassmaking industry is set to flourish, consequently escalating the demand for high-purity silica sand.
Moreover, as consumer awareness regarding sustainability grows, manufacturers are prioritizing ethically sourced silica sand. This trend not only enhances the market's appeal but also aligns with international sustainability objectives, ensuring that Malaysian silica sand meets the necessary environmental standards.
Malaysia Silica Sand For Glass Making Market Key Takeaways
- Growing demand driven by construction and automotive sectors fuels market expansion.
- Increasing emphasis on sustainable practices influences sourcing and production methods.
- Resilience of the glass industry post-COVID-19 indicates robust recovery and growth potential.
- Market players are focusing on maintaining high-quality and consistent silica sand supply.
- Investment in recycling technologies is becoming essential for long-term competitiveness.
Evaluation of Restraints in Malaysia Silica Sand For Glass Making Market
Despite the optimistic outlook, several restraints could potentially hinder the Malaysia silica sand for glass making market. One significant limitation is the reliance on consistent, high-purity silica sand sources; any disruption in supply can affect the overall production capacity of manufacturers. Furthermore, escalating cost pressures due to global market fluctuations can challenge profitability, necessitating that manufacturers explore innovative solutions such as recycling to alleviate these pressures.
Malaysia Silica Sand For Glass Making Market Trends
The market is witnessing several key trends that are shaping demand and technology. Notably, the shift towards automation in glass production processes is gaining traction, enhancing efficiency and consistency in quality. Additionally, there is a significant push towards utilizing advanced materials in glass manufacturing, promoting the need for specialized silica sand that meets new performance criteria. Furthermore, collaborations between manufacturers and research institutions are paving the way for innovative product developments.
Malaysia Silica Sand For Glass Making Market Opportunities
Opportunities within the Malaysia silica sand for glass making market lie in the untapped reserves of silica sand and the growing export potential. As regional demand for high-quality glass escalates, Malaysian producers are uniquely positioned to cater to international markets. Additionally, investments in research and development focusing on sustainable practices can unlock new avenues for growth, allowing companies to differentiate themselves through superior product offerings.
Government Initiatives in the Malaysia Silica Sand For Glass Making Market
The Malaysian government has been proactive in promoting policies aimed at bolstering the manufacturing sector, including the glass industry. Initiatives such as infrastructure development programs and incentives for sustainable practices create a favorable environment for market participants. Furthermore, public funding directed towards innovation and technology in manufacturing processes encourages local businesses to enhance their operational efficiencies, aligning with broader economic goals.
Future Insights of the Malaysia Silica Sand For Glass Making Market
Looking ahead to the period from 2026 to 2032, the Malaysia silica sand for glass making market is likely to experience sustained growth, supported by continuous advancements in technology and rising demand from various industries. The emphasis on high-purity silica sand will remain central, as manufacturers seek to meet stringent industry standards. Additionally, the integration of recycling technologies will likely reshape sourcing strategies, making it a pivotal period for innovation and sustainability in the sector.
Malaysia Silica Sand For Glass Making Market Latest Developments (2025 - 2026)
Recent developments in the market indicate a strategic pivot towards enhancing production capabilities. Key industry players are increasingly investing in technologies that improve the purity and quality of silica sand. Furthermore, collaborations focused on sustainable practices are emerging, reflecting a collective industry commitment to minimizing environmental impact while meeting growing demand. This evolving landscape highlights the dynamic nature of the market and its readiness to adapt to future challenges and opportunities.
Malaysia Silica Sand For Glass Making Market - Key Attractiveness of the Report
- 10 Years of Market Numbers
- Historical Data Starting from 2022 to 2025
- Base Year: 2025
- Forecast Data until 2032
- Key Performance Indicators Impacting the Market
- Major Upcoming Developments and Projects
Key Highlights of the Report:
- Malaysia Silica Sand For Glass Making Market Outlook
- Market Size of Malaysia Silica Sand For Glass Making Market, 2025
- Forecast of Malaysia Silica Sand For Glass Making Market, 2032
- Historical Data and Forecast of Malaysia Silica Sand For Glass Making Revenues & Volume for the Period 2022-2032F
- Malaysia Silica Sand For Glass Making Market Trend Evolution
- Malaysia Silica Sand For Glass Making Market Drivers and Challenges
- Malaysia Silica Sand For Glass Making Price Trends
- Malaysia Silica Sand For Glass Making Porter's Five Forces
- Malaysia Silica Sand For Glass Making Industry Life Cycle
- Historical Data and Forecast of Malaysia Silica Sand For Glass Making Market Revenues & Volume By Application for the Period 2022-2032F
- Historical Data and Forecast of Malaysia Silica Sand For Glass Making Market Revenues & Volume By Flat Glass for the Period 2022-2032F
- Historical Data and Forecast of Malaysia Silica Sand For Glass Making Market Revenues & Volume By Fiber Glass for the Period 2022-2032F
- Historical Data and Forecast of Malaysia Silica Sand For Glass Making Market Revenues & Volume By Glass Containers for the Period 2022-2032F
- Historical Data and Forecast of Malaysia Silica Sand For Glass Making Market Revenues & Volume By Special & Technical for the Period 2022-2032F
- Historical Data and Forecast of Malaysia Silica Sand For Glass Making Market Revenues & Volume By Tableware Glass for the Period 2022-2032F
- Historical Data and Forecast of Malaysia Silica Sand For Glass Making Market Revenues & Volume By Others for the Period 2022-2032F
- Historical Data and Forecast of Malaysia Silica Sand For Glass Making Market Revenues & Volume By Purity for the Period 2022-2032F
- Historical Data and Forecast of Malaysia Silica Sand For Glass Making Market Revenues & Volume By High Purity for the Period 2022-2032F
- Historical Data and Forecast of Malaysia Silica Sand For Glass Making Market Revenues & Volume By Ultra High Purity for the Period 2022-2032F
- Malaysia Silica Sand For Glass Making Import Export Trade Statistics
- Market Opportunity Assessment By Application
- Market Opportunity Assessment By Purity
- Malaysia Silica Sand For Glass Making Top Companies Market Share
- Malaysia Silica Sand For Glass Making Competitive Benchmarking By Technical and Operational Parameters
- Malaysia Silica Sand For Glass Making Company Profiles
- Malaysia Silica Sand For Glass Making Key Strategic Recommendations
Frequently Asked Questions About the Market Study (FAQs):
The primary drivers include the booming construction and automotive sectors, where high-quality glass is crucial. Additionally, an increasing focus on sustainable sourcing practices is fostering market expansion.
The market has shown resilience following the pandemic, with a notable recovery as construction activities and glass production have ramped up significantly.
The market is projected to reach USD 480 Million by 2032, growing from an estimated USD 369 Million in 2025, with a CAGR of 3.8% from 2026 to 2032.
Manufacturers face challenges related to maintaining a consistent supply of high-purity silica sand, with cost pressures potentially impacting their operations and profit margins.
The integration of automation and advanced materials in the glass manufacturing process is influencing the demand for specialized silica sand, pushing manufacturers to innovate.
Yes, there are substantial opportunities for exporting high-quality silica sand, especially as regional demand increases and Malaysian producers look to leverage untapped markets.
6Wresearch actively monitors the Malaysia Silica Sand For Glass Making Market and publishes its comprehensive annual report, highlighting emerging trends, growth drivers, revenue analysis, and forecast outlook. Our insights help businesses to make data-backed strategic decisions with ongoing market dynamics. Our analysts track relevent industries related to the Malaysia Silica Sand For Glass Making Market, allowing our clients with actionable intelligence and reliable forecasts tailored to emerging regional needs.
Yes, we provide customisation as per your requirements. To learn more, feel free to contact us on sales@6wresearch.com
1 Executive Summary |
2 Introduction |
2.1 Key Highlights of the Report |
2.2 Report Description |
2.3 Market Scope & Segmentation |
2.4 Research Methodology |
2.5 Assumptions |
3 Malaysia Silica Sand For Glass Making Market Overview |
3.1 Malaysia Country Macro Economic Indicators |
3.2 Malaysia Silica Sand For Glass Making Market Revenues & Volume, 2022 & 2032F |
3.3 Malaysia Silica Sand For Glass Making Market - Industry Life Cycle |
3.4 Malaysia Silica Sand For Glass Making Market - Porter's Five Forces |
3.5 Malaysia Silica Sand For Glass Making Market Revenues & Volume Share, By Application, 2022 & 2032F |
3.6 Malaysia Silica Sand For Glass Making Market Revenues & Volume Share, By Purity, 2022 & 2032F |
4 Malaysia Silica Sand For Glass Making Market Dynamics |
4.1 Impact Analysis |
4.2 Market Drivers |
4.2.1 Growing demand for glass products in construction and automotive industries |
4.2.2 Favorable government regulations supporting the mining and processing of silica sand |
4.2.3 Increasing investments in infrastructure development projects |
4.3 Market Restraints |
4.3.1 Environmental concerns related to silica sand mining and processing |
4.3.2 Fluctuating prices of raw materials and energy costs impacting production |
4.3.3 Competition from other countries offering lower-cost silica sand options |
5 Malaysia Silica Sand For Glass Making Market Trends |
6 Malaysia Silica Sand For Glass Making Market, By Types |
6.1 Malaysia Silica Sand For Glass Making Market, By Application |
6.1.1 Overview and Analysis |
6.1.2 Malaysia Silica Sand For Glass Making Market Revenues & Volume, By Application, 2022-2032F |
6.1.3 Malaysia Silica Sand For Glass Making Market Revenues & Volume, By Flat Glass, 2022-2032F |
6.1.4 Malaysia Silica Sand For Glass Making Market Revenues & Volume, By Fiber Glass, 2022-2032F |
6.1.5 Malaysia Silica Sand For Glass Making Market Revenues & Volume, By Glass Containers, 2022-2032F |
6.1.6 Malaysia Silica Sand For Glass Making Market Revenues & Volume, By Special & Technical, 2022-2032F |
6.1.7 Malaysia Silica Sand For Glass Making Market Revenues & Volume, By Tableware Glass, 2022-2032F |
6.1.8 Malaysia Silica Sand For Glass Making Market Revenues & Volume, By Others, 2022-2032F |
6.2 Malaysia Silica Sand For Glass Making Market, By Purity |
6.2.1 Overview and Analysis |
6.2.2 Malaysia Silica Sand For Glass Making Market Revenues & Volume, By High Purity, 2022-2032F |
6.2.3 Malaysia Silica Sand For Glass Making Market Revenues & Volume, By Ultra High Purity, 2022-2032F |
7 Malaysia Silica Sand For Glass Making Market Import-Export Trade Statistics |
7.1 Malaysia Silica Sand For Glass Making Market Export to Major Countries |
7.2 Malaysia Silica Sand For Glass Making Market Imports from Major Countries |
8 Malaysia Silica Sand For Glass Making Market Key Performance Indicators |
8.1 Average selling price of malaysia silica sand for glass making |
8.2 Percentage of silica sand mining companies in compliance with environmental regulations |
8.3 Number of new infrastructure projects utilizing malaysia silica sand |
9 Malaysia Silica Sand For Glass Making Market - Opportunity Assessment |
9.1 Malaysia Silica Sand For Glass Making Market Opportunity Assessment, By Application, 2022 & 2032F |
9.2 Malaysia Silica Sand For Glass Making Market Opportunity Assessment, By Purity, 2022 & 2032F |
10 Malaysia Silica Sand For Glass Making Market - Competitive Landscape |
10.1 Malaysia Silica Sand For Glass Making Market Revenue Share, By Companies, 2025 |
10.2 Malaysia Silica Sand For Glass Making Market Competitive Benchmarking, By Operating and Technical Parameters |
11 Company Profiles |
12 Recommendations |
13 Disclaimer |
Global Go To Market Strategy - 2030
Export potential enables firms to identify high-growth global markets with greater confidence by combining advanced trade intelligence with a structured quantitative methodology. The framework analyzes emerging demand trends and country-level import patterns while integrating macroeconomic and trade datasets such as GDP and population forecasts, bilateral import–export flows, tariff structures, elasticity differentials between developed and developing economies, geographic distance, and import demand projections. Using weighted trade values from 2020–2024 as the base period to project country-to-country export potential for 2030, these inputs are operationalized through calculated drivers such as gravity model parameters, tariff impact factors, and projected GDP per-capita growth. Through an analysis of hidden potentials, demand hotspots, and market conditions that are most favorable to success, this method enables firms to focus on target countries, maximize returns, and global expansion with data, backed by accuracy.
By factoring in the projected importer demand gap that is currently unmet and could be potential opportunity, it identifies the potential for the Exporter (Country) among 190 countries, against the general trade analysis, which identifies the biggest importer or exporter.
To discover high-growth global markets and optimize your business strategy:
Click Here
Pricing
- Single User License$ 1,995
- Department License$ 2,400
- Site License$ 3,120
- Global License$ 3,795

Leadership Perspectives from Industry Events
Search
Thought Leadership and Analyst Meet


Our Clients
6WResearch In News
- India Air Conditioner Market Set for Strong Rebound in 2026 After Weather-Led Correction and GST-Driven Recovery: 6Wresearch
- ADAS in India: How Automatic Emergency Braking, Blind Spot Detection & Driver Monitoring are Transforming Road Safety
- Doha a strategic location for EV manufacturing hub: IPA Qatar
- Demand for luxury TVs surging in the GCC, says Samsung
- Empowering Growth: The Thriving Journey of Bangladesh’s Cable Industry
- Demand for luxury TVs surging in the GCC, says Samsung
Latest Reports
- Nicaragua RPG Gaming Market (2026-2032)
- New Zealand RPG Gaming Market (2026-2032)
- Netherlands RPG Gaming Market (2026-2032)
- Nauru RPG Gaming Market (2026-2032)
- Namibia RPG Gaming Market (2026-2032)
- Mozambique RPG Gaming Market (2026-2032)
- Montenegro RPG Gaming Market (2026-2032)
- Mongolia RPG Gaming Market (2026-2032)
- Monaco RPG Gaming Market (2026-2032)
- Micronesia RPG Gaming Market (2026-2032)
Industry Events and Analyst Meet

EV India Expo 2026

HIMTEX 2026

India Refining Summit 2026

India EV Show 2026

EV tech India Expo 2026
Whitepaper
- Middle East & Africa Commercial Security Market Click here to view more.
- Middle East & Africa Fire Safety Systems & Equipment Market Click here to view more.
- GCC Drone Market Click here to view more.
- Middle East Lighting Fixture Market Click here to view more.
- GCC Physical & Perimeter Security Market Click here to view more.