Malta Baby Carriage Market (2026-2032) | Companies, Trends, Pricing Analysis, Investment Trends, Revenue, Supply, Demand, Opportunities, Outlook, Forecast, Value, Share, Consumer Insights, Competition, Segmentation, Challenges, Strategy, Restraints, Industry, Growth, Size, Segments, Drivers, Strategic Insights, Competitive, Analysis
Market Forecast By Product Type (Strollers, Prams, Double Strollers, Jogging Strollers, Travel Systems), By Application (Mobility & Travel, Infant Transport, Twin or Multiple Children, Outdoor and Active Mobility, Convenient Travel), By End User (Parenting, Baby Products, Parents, Parents & Retail), By Distribution Channel (Online Platforms, Baby Care Store) And Competitive Landscape
| Product Code: ETC11173248 | Publication Date: Apr 2025 | Updated Date: Apr 2026 | Product Type: Market Research Report | |
| Publisher: 6Wresearch | Author: Bhawna Singh | No. of Pages: 65 | No. of Figures: 34 | No. of Tables: 19 |
Malta Baby Carriage Market Size (2020-2030)
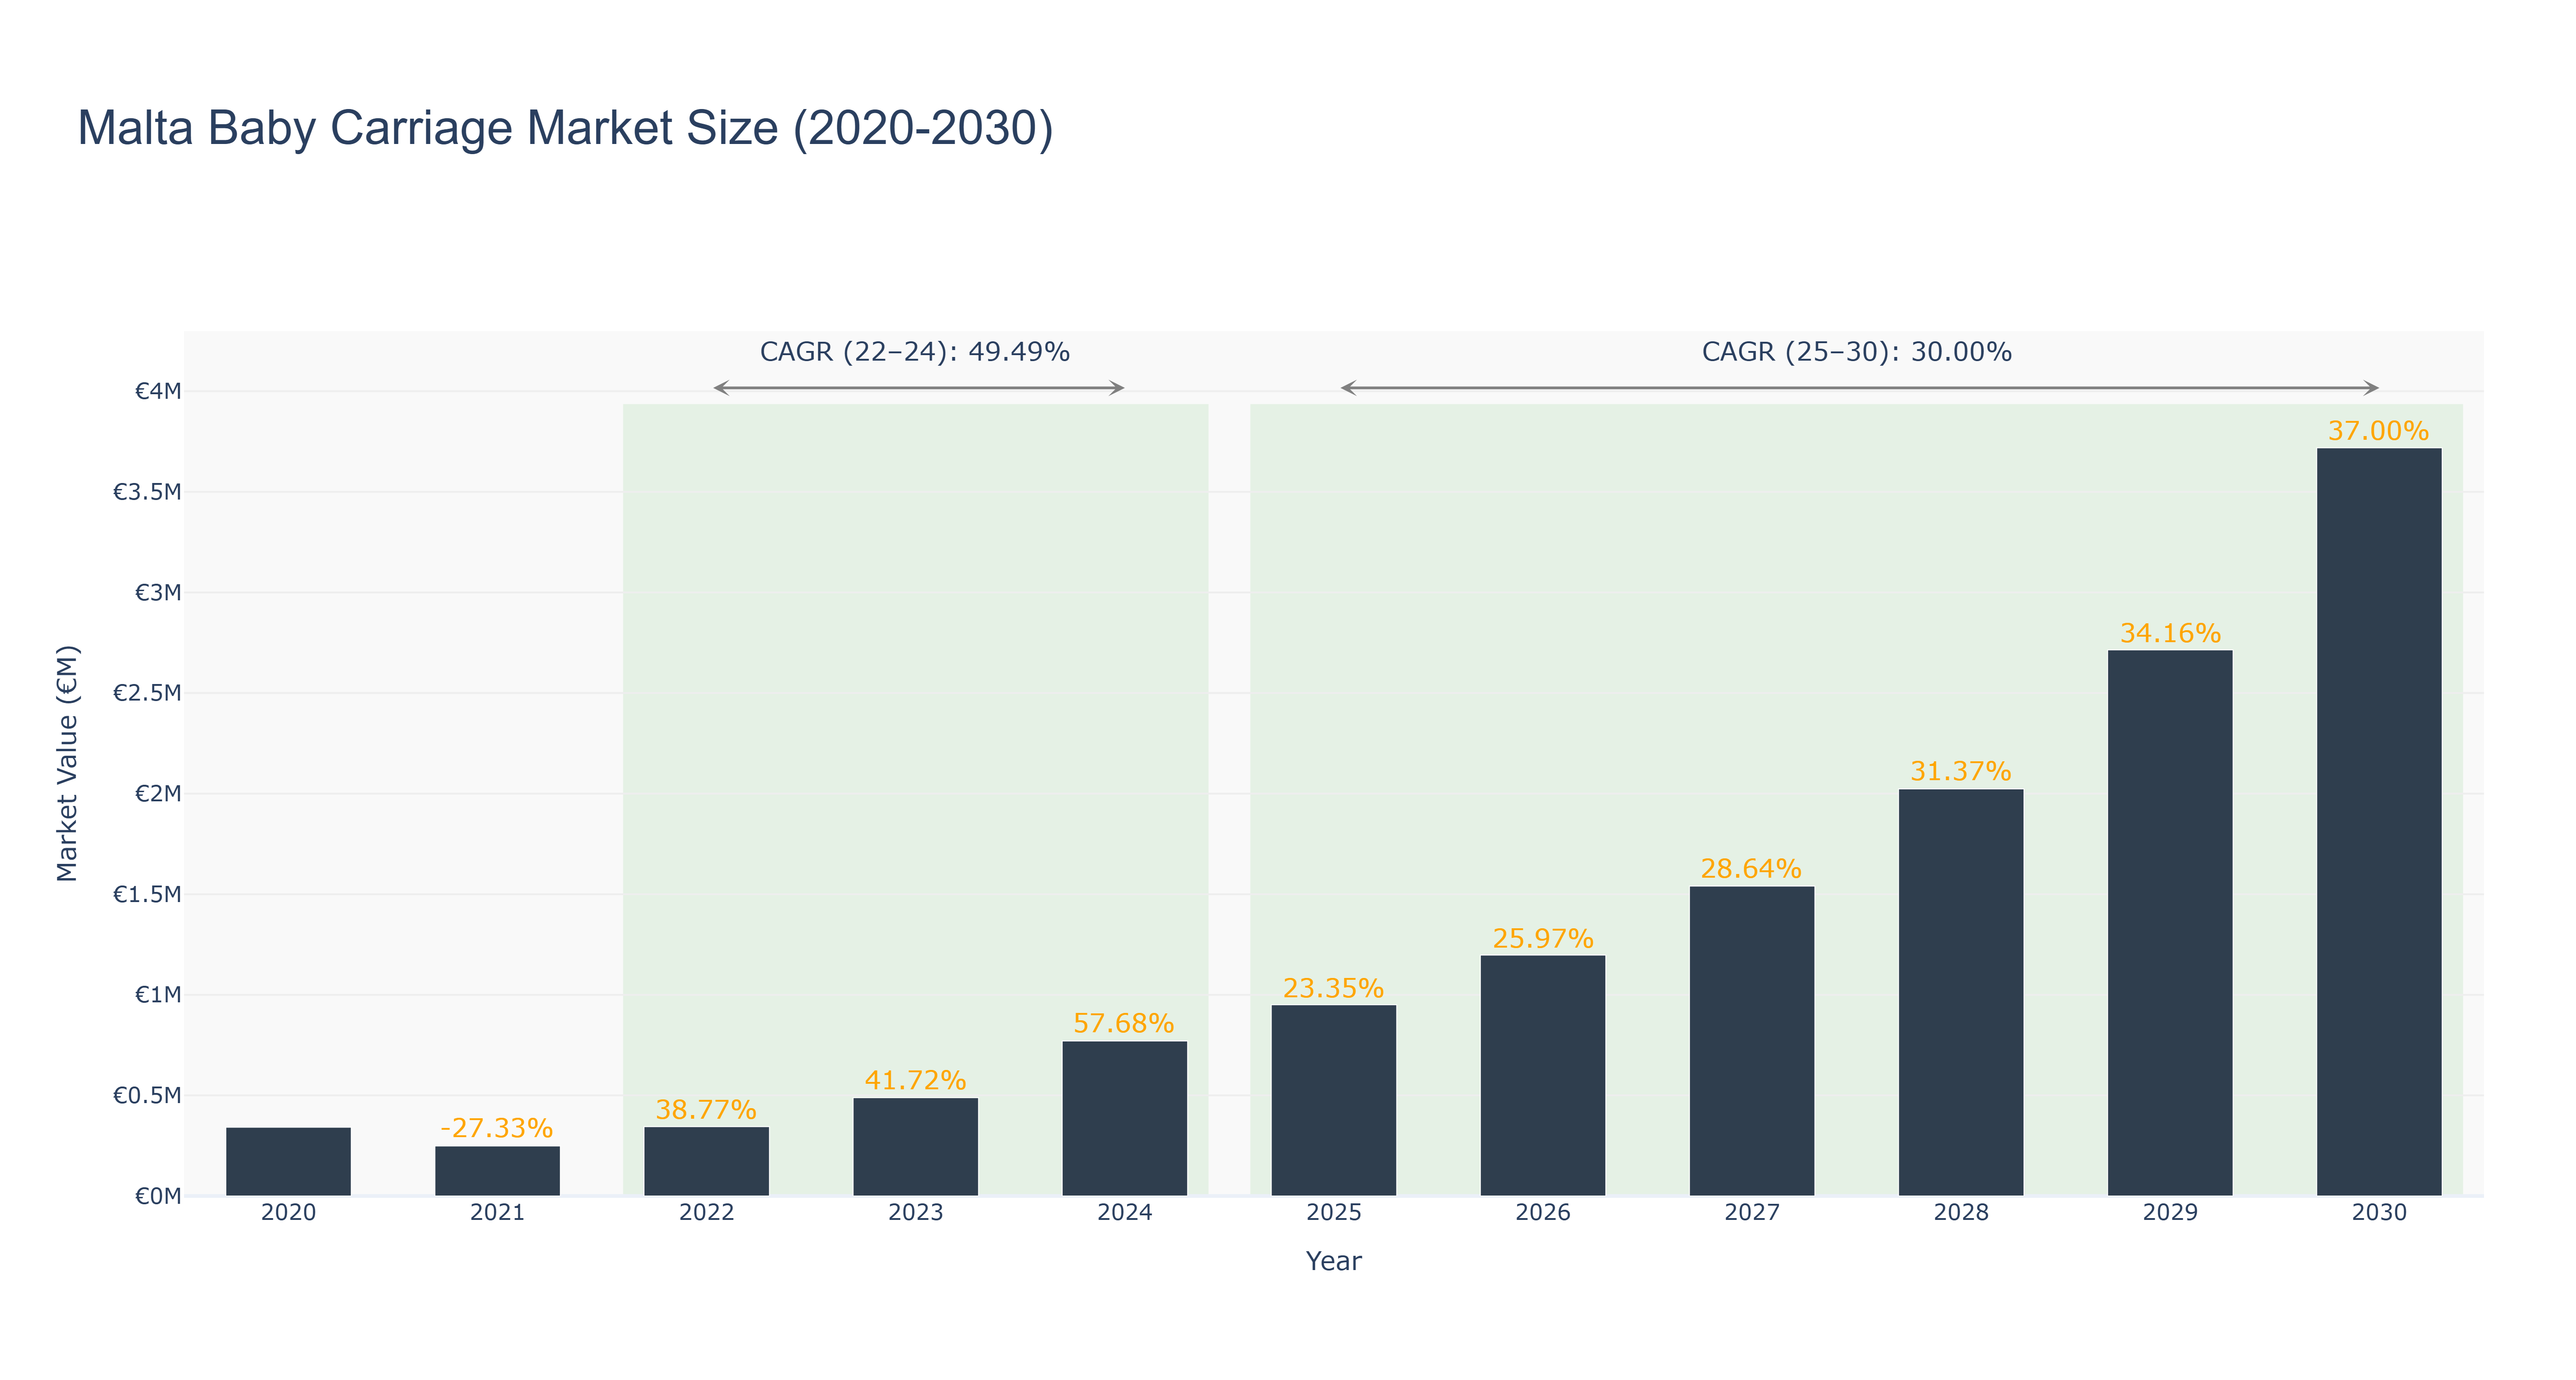
Malta Baby Carriage Market has shown a fluctuating trend over the years. The peak market size was €3.72 million in 2030, with a notable growth rate of 37.00%. From 2020 to 2024, the market size ranged from €0.34 million to €0.77 million, experiencing significant growth. The forecasted market size from 2025 to 2030 is expected to increase steadily, with a compound annual growth rate (CAGR) of 30.0%. The market saw a remarkable CAGR of 49.49% during 2022-2024, indicating a period of rapid expansion. The recent growth can be attributed to increasing disposable income and changing consumer lifestyles, driving demand for high-quality baby carriages. Looking ahead, Malta is set to launch a national campaign promoting sustainable and eco-friendly baby carriage options, aligning with the global sustainability trend in the baby products market.
Malta Baby Carriage Market: Production & Trade Performance (2019-2025)

The Malta Baby Carriage Market witnessed fluctuations in both Exports and Imports during the period under review. In 2019, Exports stood at €590 thousand, with a subsequent increase in 2020 to €5.87 thousand before declining to €1.89 thousand in 2021. The trend reversed in 2022, with Exports rebounding to €3.34 thousand but dropped significantly in 2023 to €1.77 thousand and further to €565 thousand in 2024. However, there was a slight recovery in 2025 to €424 thousand. On the other hand, Imports experienced consistent growth, rising from €383.34 thousand in 2019 to €817.74 thousand in 2024 and reaching €1.01 million in 2025. The significant increase in Imports could be attributed to a growing demand for baby carriages in Malta, possibly due to population growth, changing consumer preferences towards higher quality products, and increased disposable income levels. The contrasting performance of Exports and Imports suggests a shifting landscape in the market dynamics, potentially influenced by global trade patterns and domestic economic conditions.
Key Highlights of the Report:
- Malta Baby Carriage Market Outlook
- Market Size of Malta Baby Carriage Market, 2025
- Forecast of Malta Baby Carriage Market, 2032
- Historical Data and Forecast of Malta Baby Carriage Revenues & Volume for the Period 2022 - 2032F
- Malta Baby Carriage Market Trend Evolution
- Malta Baby Carriage Market Drivers and Challenges
- Malta Baby Carriage Price Trends
- Malta Baby Carriage Porter's Five Forces
- Malta Baby Carriage Industry Life Cycle
- Historical Data and Forecast of Malta Baby Carriage Market Revenues & Volume By Product Type for the Period 2022 - 2032F
- Historical Data and Forecast of Malta Baby Carriage Market Revenues & Volume By Strollers for the Period 2022 - 2032F
- Historical Data and Forecast of Malta Baby Carriage Market Revenues & Volume By Prams for the Period 2022 - 2032F
- Historical Data and Forecast of Malta Baby Carriage Market Revenues & Volume By Double Strollers for the Period 2022 - 2032F
- Historical Data and Forecast of Malta Baby Carriage Market Revenues & Volume By Jogging Strollers for the Period 2022 - 2032F
- Historical Data and Forecast of Malta Baby Carriage Market Revenues & Volume By Travel Systems for the Period 2022 - 2032F
- Historical Data and Forecast of Malta Baby Carriage Market Revenues & Volume By Application for the Period 2022 - 2032F
- Historical Data and Forecast of Malta Baby Carriage Market Revenues & Volume By Mobility & Travel for the Period 2022 - 2032F
- Historical Data and Forecast of Malta Baby Carriage Market Revenues & Volume By Infant Transport for the Period 2022 - 2032F
- Historical Data and Forecast of Malta Baby Carriage Market Revenues & Volume By Twin or Multiple Children for the Period 2022 - 2032F
- Historical Data and Forecast of Malta Baby Carriage Market Revenues & Volume By Outdoor and Active Mobility for the Period 2022 - 2032F
- Historical Data and Forecast of Malta Baby Carriage Market Revenues & Volume By Convenient Travel for the Period 2022 - 2032F
- Historical Data and Forecast of Malta Baby Carriage Market Revenues & Volume By End User for the Period 2022 - 2032F
- Historical Data and Forecast of Malta Baby Carriage Market Revenues & Volume By Parenting for the Period 2022 - 2032F
- Historical Data and Forecast of Malta Baby Carriage Market Revenues & Volume By Baby Products for the Period 2022 - 2032F
- Historical Data and Forecast of Malta Baby Carriage Market Revenues & Volume By Parents for the Period 2022 - 2032F
- Historical Data and Forecast of Malta Baby Carriage Market Revenues & Volume By Parents & Retail for the Period 2022 - 2032F
- Historical Data and Forecast of Malta Baby Carriage Market Revenues & Volume By Distribution Channel for the Period 2022 - 2032F
- Historical Data and Forecast of Malta Baby Carriage Market Revenues & Volume By Online Platforms for the Period 2022 - 2032F
- Historical Data and Forecast of Malta Baby Carriage Market Revenues & Volume By Baby Care Store for the Period 2022 - 2032F
- Malta Baby Carriage Import Export Trade Statistics
- Market Opportunity Assessment By Product Type
- Market Opportunity Assessment By Application
- Market Opportunity Assessment By End User
- Market Opportunity Assessment By Distribution Channel
- Malta Baby Carriage Top Companies Market Share
- Malta Baby Carriage Competitive Benchmarking By Technical and Operational Parameters
- Malta Baby Carriage Company Profiles
- Malta Baby Carriage Key Strategic Recommendations
Frequently Asked Questions About the Market Study (FAQs):
6Wresearch actively monitors the Malta Baby Carriage Market and publishes its comprehensive annual report, highlighting emerging trends, growth drivers, revenue analysis, and forecast outlook. Our insights help businesses to make data-backed strategic decisions with ongoing market dynamics. Our analysts track relevent industries related to the Malta Baby Carriage Market, allowing our clients with actionable intelligence and reliable forecasts tailored to emerging regional needs.
Yes, we provide customisation as per your requirements. To learn more, feel free to contact us on sales@6wresearch.com
1 Executive Summary |
2 Introduction |
2.1 Key Highlights of the Report |
2.2 Report Description |
2.3 Market Scope & Segmentation |
2.4 Research Methodology |
2.5 Assumptions |
3 Malta Baby Carriage Market Overview |
3.1 Malta Country Macro Economic Indicators |
3.2 Malta Baby Carriage Market Revenues & Volume, 2022 & 2032F |
3.3 Malta Baby Carriage Market - Industry Life Cycle |
3.4 Malta Baby Carriage Market - Porter's Five Forces |
3.5 Malta Baby Carriage Market Revenues & Volume Share, By Product Type, 2022 & 2032F |
3.6 Malta Baby Carriage Market Revenues & Volume Share, By Application, 2022 & 2032F |
3.7 Malta Baby Carriage Market Revenues & Volume Share, By End User, 2022 & 2032F |
3.8 Malta Baby Carriage Market Revenues & Volume Share, By Distribution Channel, 2022 & 2032F |
4 Malta Baby Carriage Market Dynamics |
4.1 Impact Analysis |
4.2 Market Drivers |
4.3 Market Restraints |
5 Malta Baby Carriage Market Trends |
6 Malta Baby Carriage Market, By Types |
6.1 Malta Baby Carriage Market, By Product Type |
6.1.1 Overview and Analysis |
6.1.2 Malta Baby Carriage Market Revenues & Volume, By Product Type, 2022 - 2032F |
6.1.3 Malta Baby Carriage Market Revenues & Volume, By Strollers, 2022 - 2032F |
6.1.4 Malta Baby Carriage Market Revenues & Volume, By Prams, 2022 - 2032F |
6.1.5 Malta Baby Carriage Market Revenues & Volume, By Double Strollers, 2022 - 2032F |
6.1.6 Malta Baby Carriage Market Revenues & Volume, By Jogging Strollers, 2022 - 2032F |
6.1.7 Malta Baby Carriage Market Revenues & Volume, By Travel Systems, 2022 - 2032F |
6.2 Malta Baby Carriage Market, By Application |
6.2.1 Overview and Analysis |
6.2.2 Malta Baby Carriage Market Revenues & Volume, By Mobility & Travel, 2022 - 2032F |
6.2.3 Malta Baby Carriage Market Revenues & Volume, By Infant Transport, 2022 - 2032F |
6.2.4 Malta Baby Carriage Market Revenues & Volume, By Twin or Multiple Children, 2022 - 2032F |
6.2.5 Malta Baby Carriage Market Revenues & Volume, By Outdoor and Active Mobility, 2022 - 2032F |
6.2.6 Malta Baby Carriage Market Revenues & Volume, By Convenient Travel, 2022 - 2032F |
6.3 Malta Baby Carriage Market, By End User |
6.3.1 Overview and Analysis |
6.3.2 Malta Baby Carriage Market Revenues & Volume, By Parenting, 2022 - 2032F |
6.3.3 Malta Baby Carriage Market Revenues & Volume, By Baby Products, 2022 - 2032F |
6.3.4 Malta Baby Carriage Market Revenues & Volume, By Parents, 2022 - 2032F |
6.3.5 Malta Baby Carriage Market Revenues & Volume, By Parents & Retail, 2022 - 2032F |
6.4 Malta Baby Carriage Market, By Distribution Channel |
6.4.1 Overview and Analysis |
6.4.2 Malta Baby Carriage Market Revenues & Volume, By Online Platforms, 2022 - 2032F |
6.4.3 Malta Baby Carriage Market Revenues & Volume, By Baby Care Store, 2022 - 2032F |
7 Malta Baby Carriage Market Import-Export Trade Statistics |
7.1 Malta Baby Carriage Market Export to Major Countries |
7.2 Malta Baby Carriage Market Imports from Major Countries |
8 Malta Baby Carriage Market Key Performance Indicators |
9 Malta Baby Carriage Market - Opportunity Assessment |
9.1 Malta Baby Carriage Market Opportunity Assessment, By Product Type, 2022 & 2032F |
9.2 Malta Baby Carriage Market Opportunity Assessment, By Application, 2022 & 2032F |
9.3 Malta Baby Carriage Market Opportunity Assessment, By End User, 2022 & 2032F |
9.4 Malta Baby Carriage Market Opportunity Assessment, By Distribution Channel, 2022 & 2032F |
10 Malta Baby Carriage Market - Competitive Landscape |
10.1 Malta Baby Carriage Market Revenue Share, By Companies, 2025 |
10.2 Malta Baby Carriage Market Competitive Benchmarking, By Operating and Technical Parameters |
11 Company Profiles |
12 Recommendations |
13 Disclaimer |
Export potential assessment - trade Analytics for 2030
Export potential enables firms to identify high-growth global markets with greater confidence by combining advanced trade intelligence with a structured quantitative methodology. The framework analyzes emerging demand trends and country-level import patterns while integrating macroeconomic and trade datasets such as GDP and population forecasts, bilateral import–export flows, tariff structures, elasticity differentials between developed and developing economies, geographic distance, and import demand projections. Using weighted trade values from 2020–2024 as the base period to project country-to-country export potential for 2030, these inputs are operationalized through calculated drivers such as gravity model parameters, tariff impact factors, and projected GDP per-capita growth. Through an analysis of hidden potentials, demand hotspots, and market conditions that are most favorable to success, this method enables firms to focus on target countries, maximize returns, and global expansion with data, backed by accuracy.
By factoring in the projected importer demand gap that is currently unmet and could be potential opportunity, it identifies the potential for the Exporter (Country) among 190 countries, against the general trade analysis, which identifies the biggest importer or exporter.
To discover high-growth global markets and optimize your business strategy:
Click Here
Pricing
- Single User License$ 1,995
- Department License$ 2,400
- Site License$ 3,120
- Global License$ 3,795

Search
Thought Leadership and Analyst Meet


Our Clients
Latest Reports
- Canada Cloud CFD Market (2026-2032) | Size & Revenue, Industry, Growth, Competitive Landscape, Forecast, Segmentation, Value, Outlook, Trends, Share, Analysis, Companies
- Taiwan Food Delivery Platform Market (2026-2032) | Companies, Outlook, Analysis, Trends, Value, Revenue, Segmentation, Share, Forecast, Competitive Landscape, Growth, Size & Forecast
- United Kingdom (UK) Long-term Care Insurance Market (2026-2032) | Growth, Share, Consumer Insights, Drivers, Opportunities, Competition, Pricing Analysis, Segments, Restraints, Companies, Competitive, Value, Outlook, Size, Demand, Analysis, Challenges, Strategic Insights, Investment Trends, Revenue, Trends, Supply, Forecast
- United Kingdom (UK) Long Term Care Market (2026-2032) | Companies, Outlook, Analysis, Trends, Value, Revenue, Segmentation, Share, Forecast, Competitive Landscape, Growth, Size & Forecast
- Iraq Insulation and Waterproofing Market (2026-2032) | Outlook, Drivers, Growth, Size, Share, Industry, Revenue, Trends, Demand, Competitive, Strategic Insights, Opportunities, Segments, Companies, Challenges, Strategy, Consumer Insights, Analysis, Investment Trends, Value, Segmentation, Forecast, Restraints
- India Switchgear Market Outlook (2026-2032) | Size, Share, Trends, Growth, Revenue, Forecast, Analysis, Value, Outlook
- Pakistan Contraceptive Implants Market (2025-2031) | Demand, Growth, Size, Share, Industry, Pricing Analysis, Competitive, Strategic Insights, Strategy, Consumer Insights, Analysis, Investment Trends, Opportunities, Revenue, Segments, Value, Segmentation, Supply, Forecast, Restraints, Outlook, Competition, Drivers, Trends, Companies, Challenges
- Sri Lanka Packaging Market (2026-2032) | Outlook, Competition, Drivers, Trends, Demand, Pricing Analysis, Competitive, Strategic Insights, Companies, Challenges, Strategy, Consumer Insights, Analysis, Investment Trends, Opportunities, Growth, Size, Share, Industry, Revenue, Segments, Value, Segmentation, Supply, Forecast, Restraints
- India Kids Watches Market (2026-2032) | Strategy, Consumer Insights, Analysis, Investment Trends, Opportunities, Growth, Size, Share, Industry, Revenue, Segments, Value, Segmentation, Supply, Forecast, Restraints, Outlook, Competition, Drivers, Trends, Demand, Pricing Analysis, Competitive, Strategic Insights, Companies, Challenges
- Saudi Arabia Core Assurance Service Market (2025-2031) | Strategy, Consumer Insights, Analysis, Investment Trends, Opportunities, Growth, Size, Share, Industry, Revenue, Segments, Value, Segmentation, Supply, Forecast, Restraints, Outlook, Competition, Drivers, Trends, Demand, Pricing Analysis, Competitive, Strategic Insights, Companies, Challenges
Industry Events and Analyst Meet

India EV Show 2026

EV tech India Expo 2026

Auto Tech Asia 2026

Battery Tech India 2026

Smart Production Solutions Guangzhou 2026
Whitepaper
- Middle East & Africa Commercial Security Market Click here to view more.
- Middle East & Africa Fire Safety Systems & Equipment Market Click here to view more.
- GCC Drone Market Click here to view more.
- Middle East Lighting Fixture Market Click here to view more.
- GCC Physical & Perimeter Security Market Click here to view more.
6WResearch In News
- Doha a strategic location for EV manufacturing hub: IPA Qatar
- Demand for luxury TVs surging in the GCC, says Samsung
- Empowering Growth: The Thriving Journey of Bangladesh’s Cable Industry
- Demand for luxury TVs surging in the GCC, says Samsung
- Video call with a traditional healer? Once unthinkable, it’s now common in South Africa
- Intelligent Buildings To Smooth GCC’s Path To Net Zero