Malta Direct Drive Wind Turbine Market (2025-2031) | Value, Share, Forecast, Competitive Landscape, Industry, Size & Revenue, Trends, Segmentation, Growth, Companies, Outlook, Analysis
Market Forecast By Capacity (Less than 1MW, 1MW to 3MW, More than 3MW), By Technology (Electrically Excited Synchronous Generator, Permanent Magnet Synchronous Generator) And Competitive Landscape
| Product Code: ETC8190665 | Publication Date: Sep 2024 | Updated Date: Apr 2026 | Product Type: Market Research Report | |
| Publisher: 6Wresearch | Author: Sumit Sagar | No. of Pages: 75 | No. of Figures: 35 | No. of Tables: 20 |
Malta Direct Drive Wind Turbine Market Size (2020-2030)
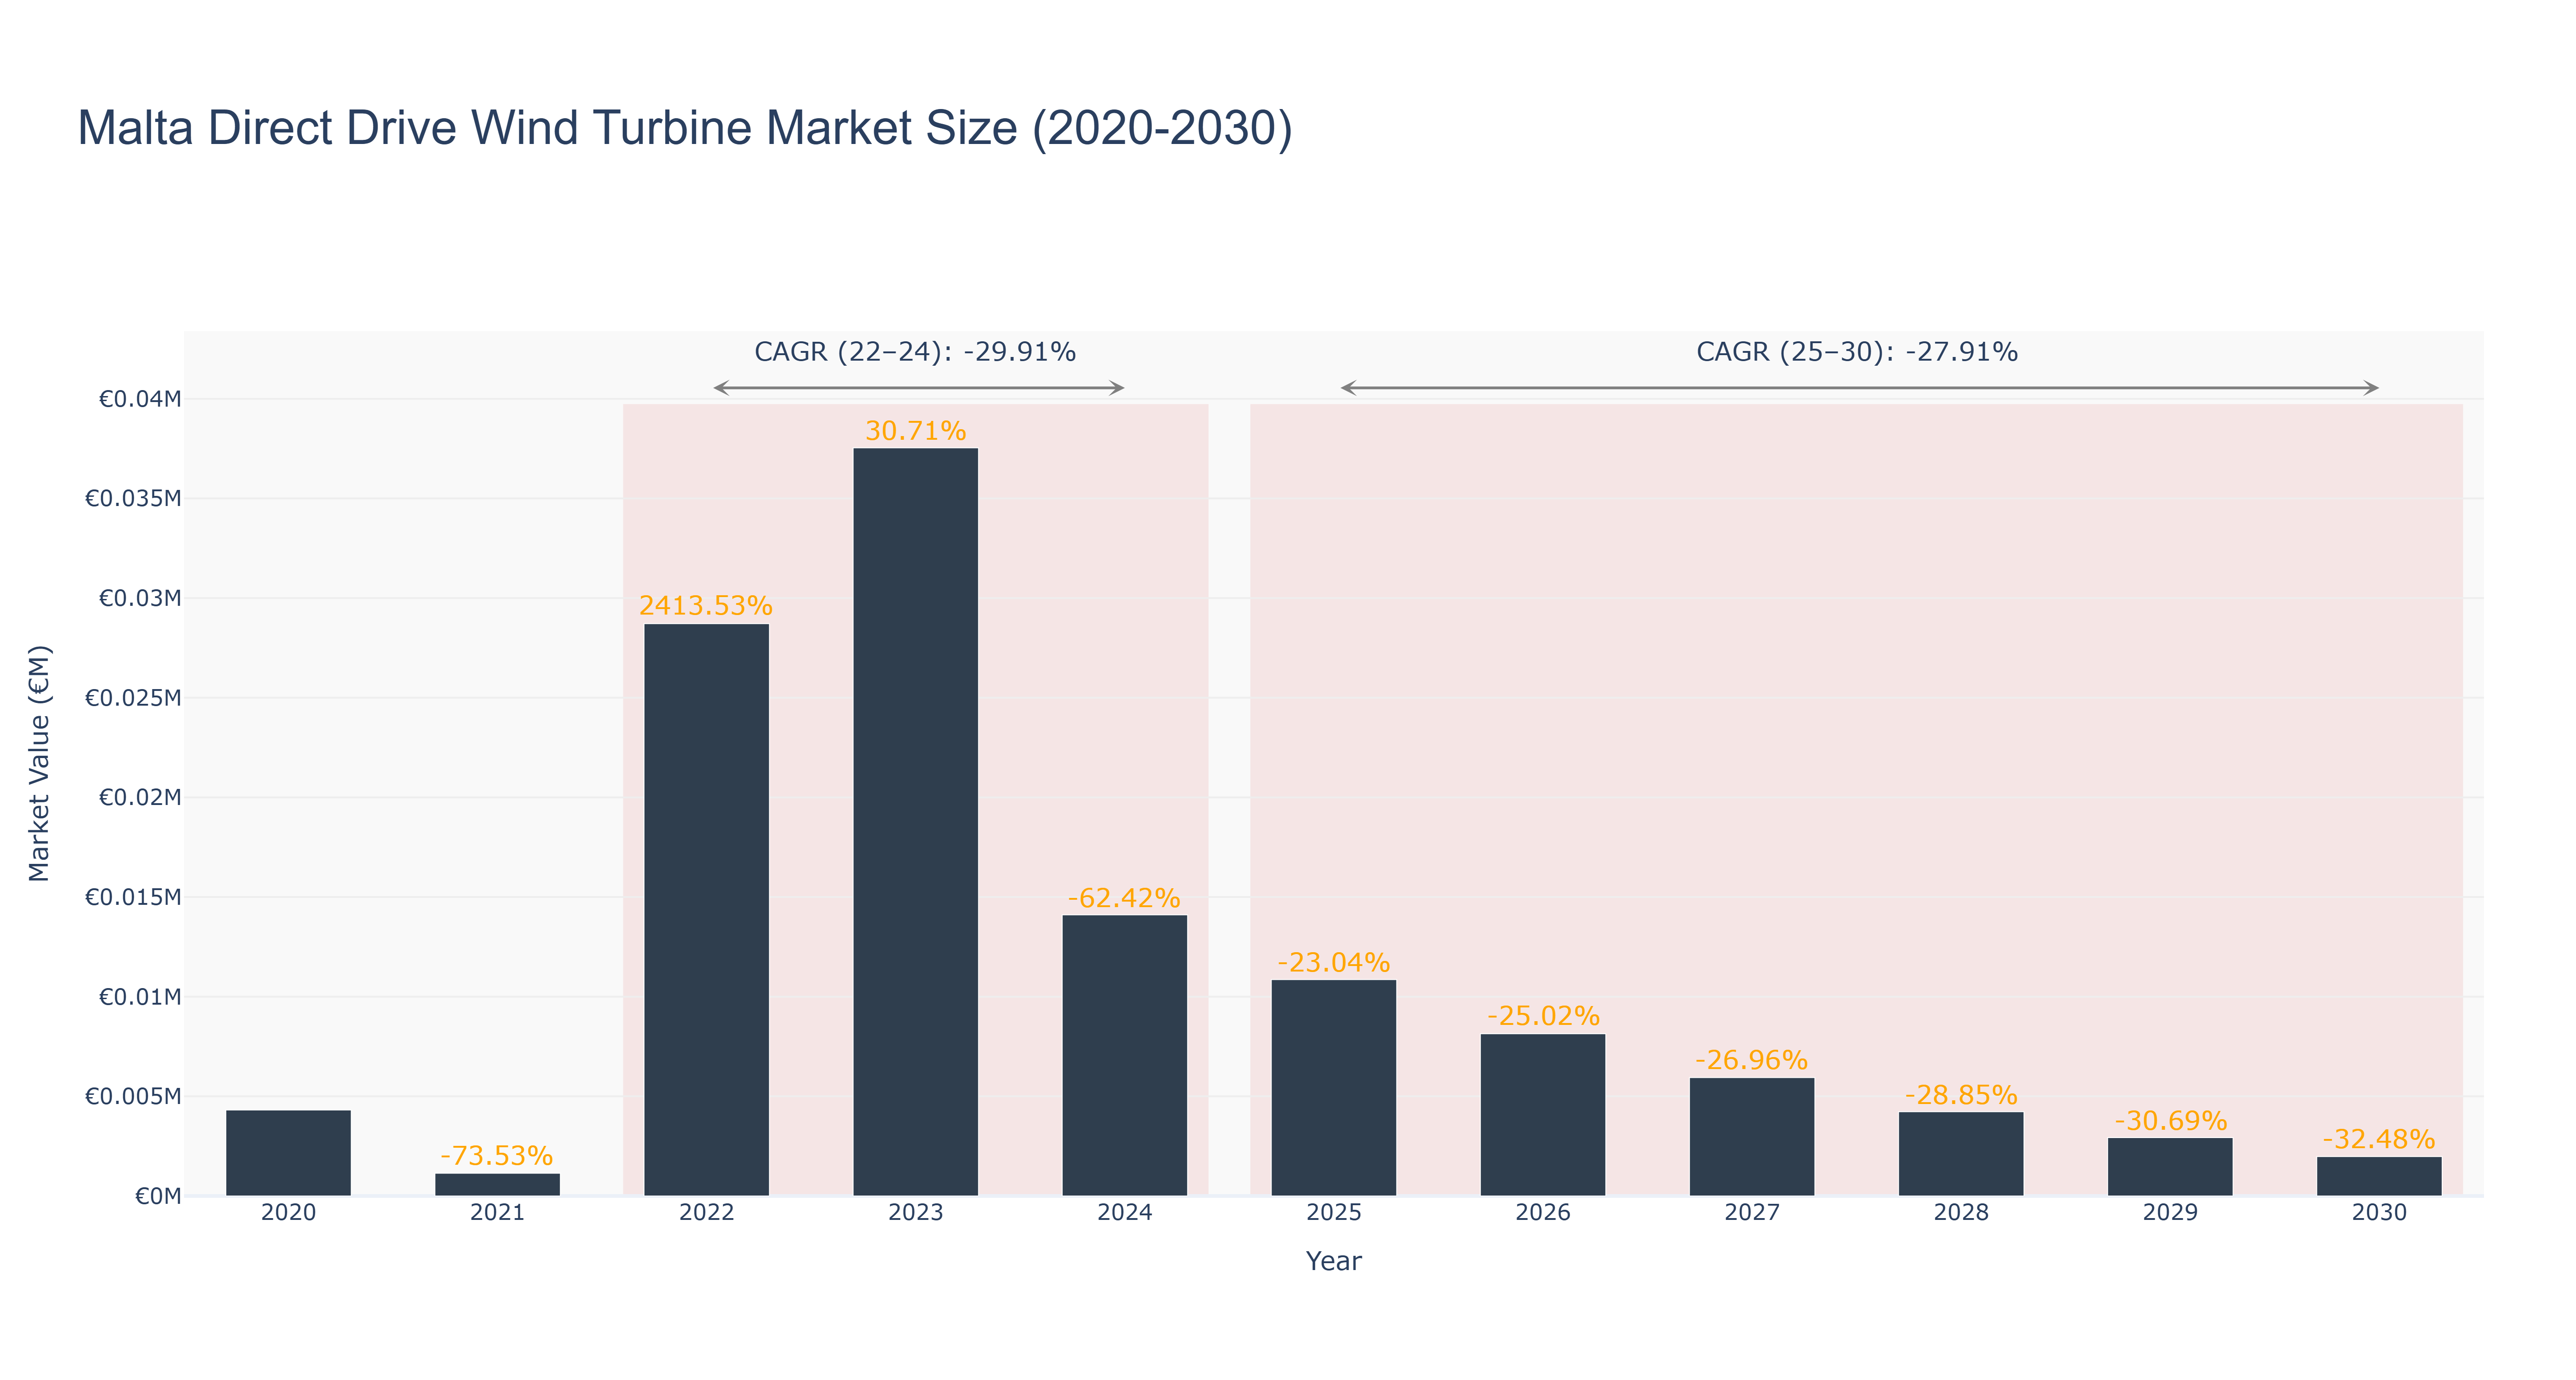
Malta Direct Drive Wind Turbine Market has experienced fluctuations in market size over the years. The peak market size was reached in 2023 at €0.04 million, followed by a significant drop to €0.01 million in 2024. The market is forecasted to remain stable around €0.01 million from 2025 to 2030, with a CAGR of -27.91% for the period 2025-30. The decline in market size can be attributed to factors such as regulatory challenges, saturation in the market, and technological advancements leading to cost reductions. Despite the challenges, recent developments in Malta's renewable energy sector, including upcoming wind farm projects, are expected to drive growth in the Direct Drive Wind Turbine Market. Moving forward, continued investment in renewable energy infrastructure and supportive government policies will play a key role in shaping the market's future trajectory.
Malta Direct Drive Wind Turbine Market: Production & Trade Performance (2019-2025)
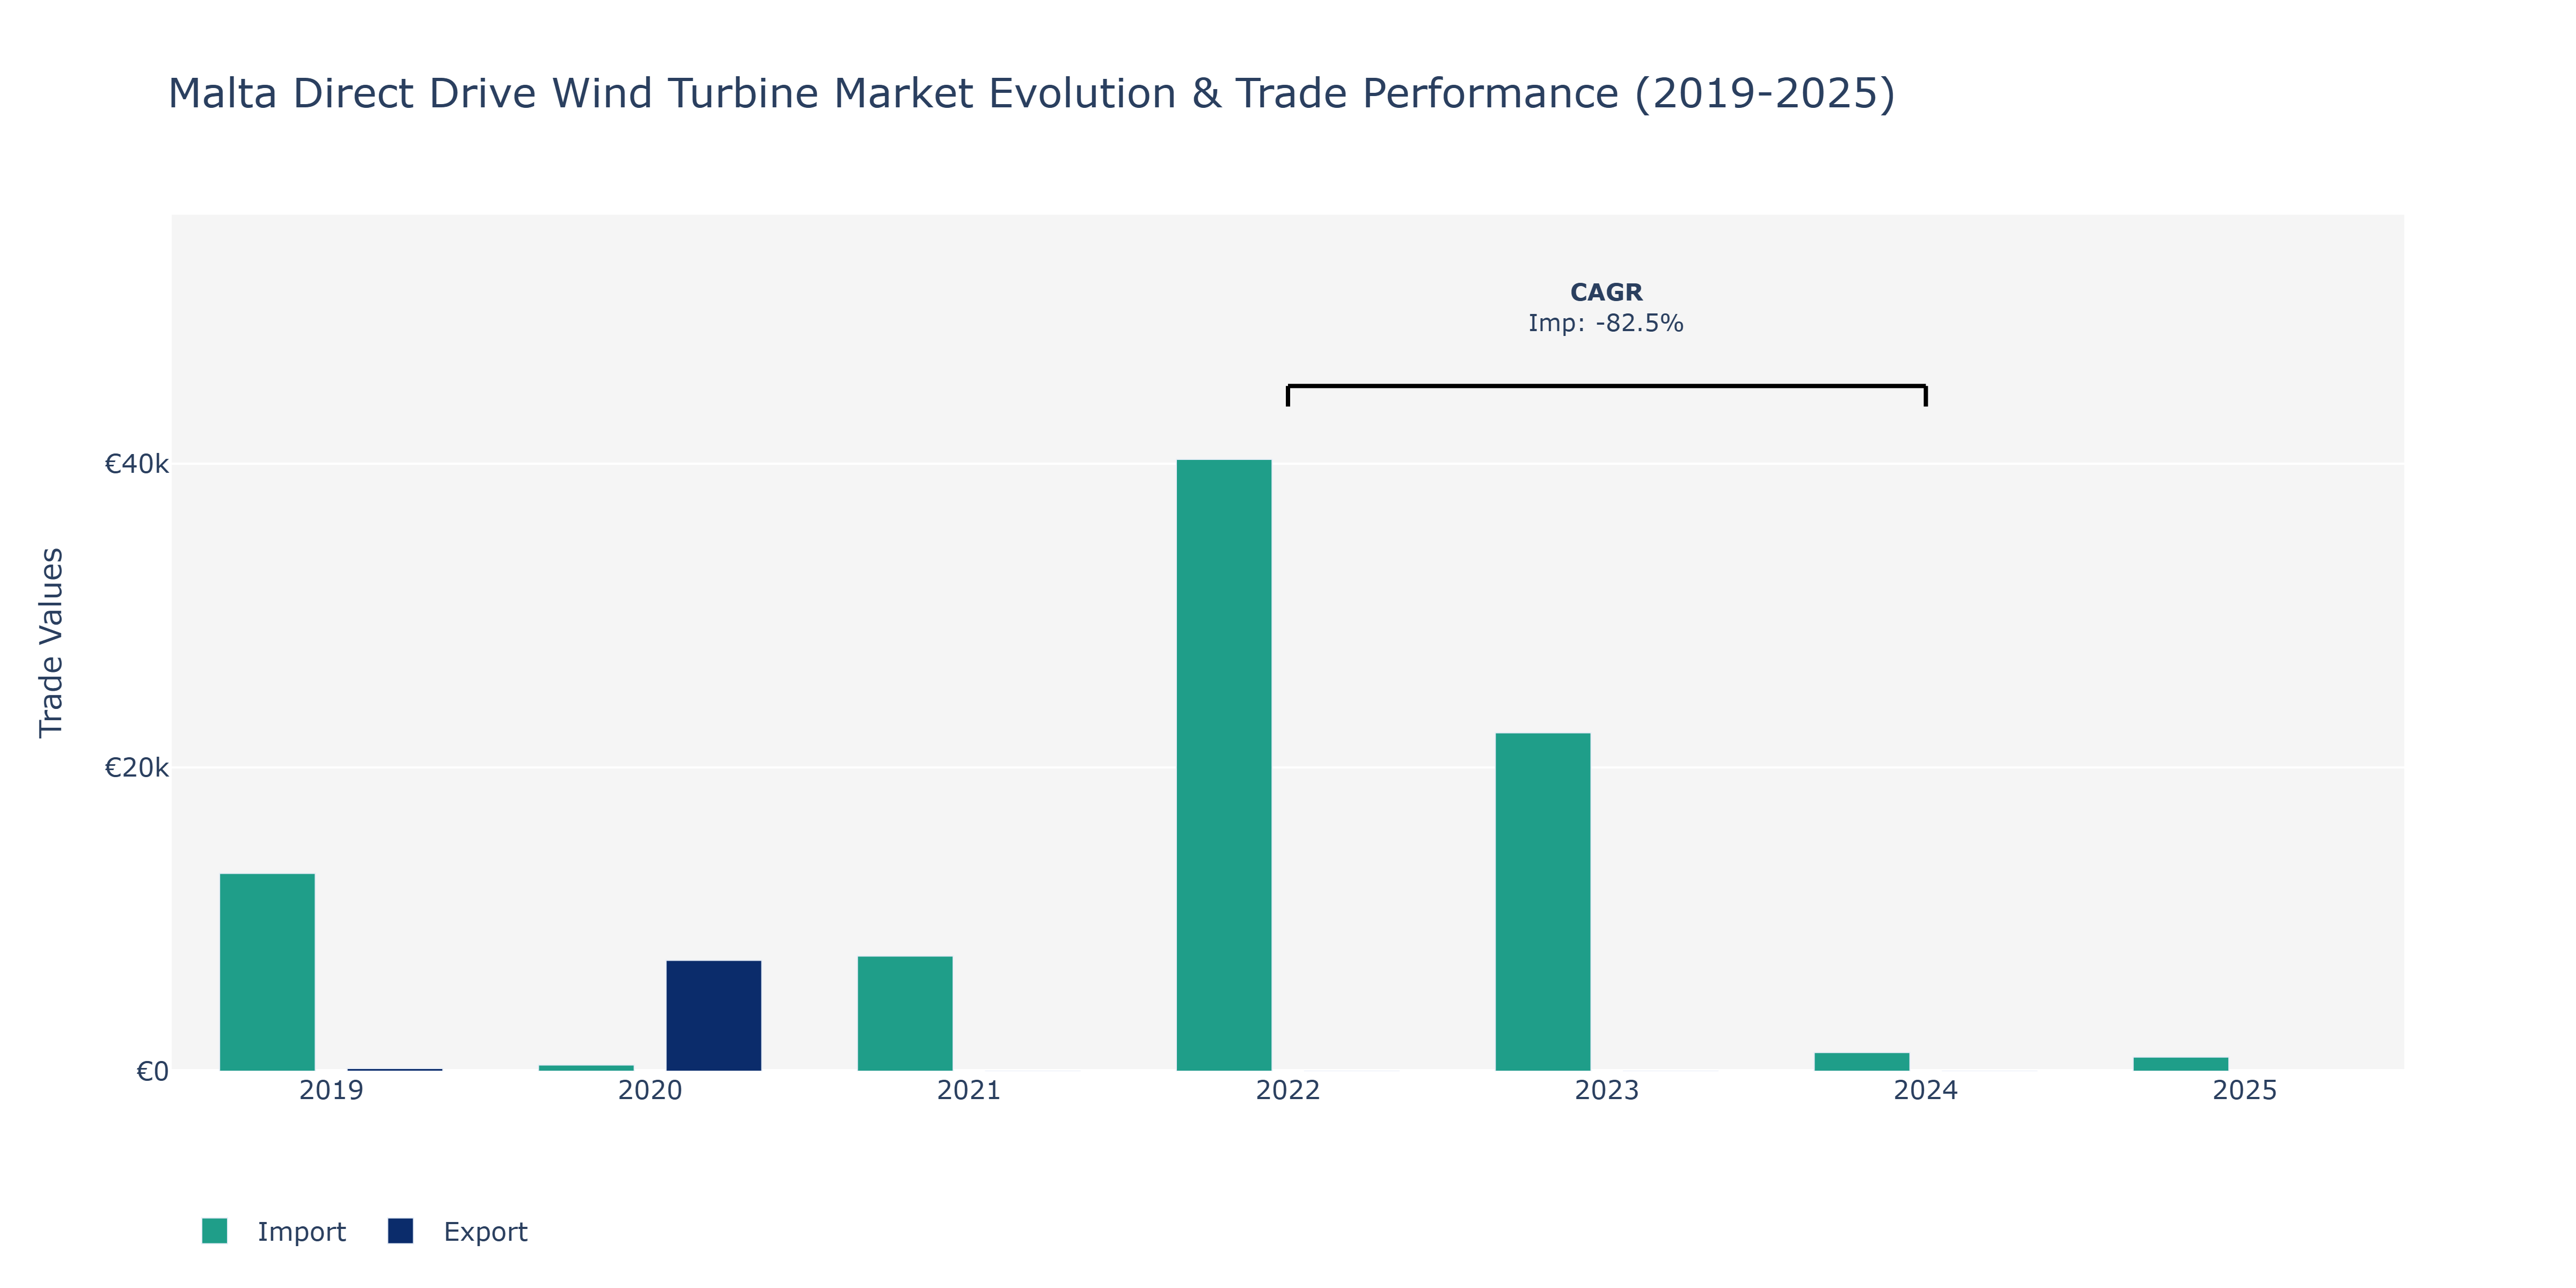
In the Malta Direct Drive Wind Turbine Market, the trend in exports experienced substantial growth from €180.0 million in 2019 to €7.3 billion in 2020, showcasing a significant surge driven by increased demand or expanded production capacity. Conversely, imports fluctuated notably, starting at €13.02 thousand in 2019 and dropping to €0.406 billion in 2020, possibly indicating supply chain disruptions or shifts in sourcing strategies. The subsequent years saw varying import volumes with a peak of €40.29 thousand in 2022, followed by a sharp decline to €1.23 thousand in 2024, signaling potential market adjustments or regulatory changes impacting procurement decisions. The market's reliance on imported components or technologies may have influenced these fluctuations, emphasizing the need for localized production capabilities or diversified supply chains to mitigate risks associated with external dependencies. This scenario aligns with global trends towards supply chain resilience and sustainability, encouraging regional production to enhance market stability and competitiveness.
Key Highlights of the Report:
- Malta Direct Drive Wind Turbine Market Outlook
- Market Size of Malta Direct Drive Wind Turbine Market, 2024
- Forecast of Malta Direct Drive Wind Turbine Market, 2031
- Historical Data and Forecast of Malta Direct Drive Wind Turbine Revenues & Volume for the Period 2021- 2031
- Malta Direct Drive Wind Turbine Market Trend Evolution
- Malta Direct Drive Wind Turbine Market Drivers and Challenges
- Malta Direct Drive Wind Turbine Price Trends
- Malta Direct Drive Wind Turbine Porter's Five Forces
- Malta Direct Drive Wind Turbine Industry Life Cycle
- Historical Data and Forecast of Malta Direct Drive Wind Turbine Market Revenues & Volume By Capacity for the Period 2021- 2031
- Historical Data and Forecast of Malta Direct Drive Wind Turbine Market Revenues & Volume By Less than 1MW for the Period 2021- 2031
- Historical Data and Forecast of Malta Direct Drive Wind Turbine Market Revenues & Volume By 1MW to 3MW for the Period 2021- 2031
- Historical Data and Forecast of Malta Direct Drive Wind Turbine Market Revenues & Volume By More than 3MW for the Period 2021- 2031
- Historical Data and Forecast of Malta Direct Drive Wind Turbine Market Revenues & Volume By Technology for the Period 2021- 2031
- Historical Data and Forecast of Malta Direct Drive Wind Turbine Market Revenues & Volume By Electrically Excited Synchronous Generator for the Period 2021- 2031
- Historical Data and Forecast of Malta Direct Drive Wind Turbine Market Revenues & Volume By Permanent Magnet Synchronous Generator for the Period 2021- 2031
- Malta Direct Drive Wind Turbine Import Export Trade Statistics
- Market Opportunity Assessment By Capacity
- Market Opportunity Assessment By Technology
- Malta Direct Drive Wind Turbine Top Companies Market Share
- Malta Direct Drive Wind Turbine Competitive Benchmarking By Technical and Operational Parameters
- Malta Direct Drive Wind Turbine Company Profiles
- Malta Direct Drive Wind Turbine Key Strategic Recommendations
Frequently Asked Questions About the Market Study (FAQs):
6Wresearch actively monitors the Malta Direct Drive Wind Turbine Market and publishes its comprehensive annual report, highlighting emerging trends, growth drivers, revenue analysis, and forecast outlook. Our insights help businesses to make data-backed strategic decisions with ongoing market dynamics. Our analysts track relevent industries related to the Malta Direct Drive Wind Turbine Market, allowing our clients with actionable intelligence and reliable forecasts tailored to emerging regional needs.
Yes, we provide customisation as per your requirements. To learn more, feel free to contact us on sales@6wresearch.com
1 Executive Summary |
2 Introduction |
2.1 Key Highlights of the Report |
2.2 Report Description |
2.3 Market Scope & Segmentation |
2.4 Research Methodology |
2.5 Assumptions |
3 Malta Direct Drive Wind Turbine Market Overview |
3.1 Malta Country Macro Economic Indicators |
3.2 Malta Direct Drive Wind Turbine Market Revenues & Volume, 2021 & 2031F |
3.3 Malta Direct Drive Wind Turbine Market - Industry Life Cycle |
3.4 Malta Direct Drive Wind Turbine Market - Porter's Five Forces |
3.5 Malta Direct Drive Wind Turbine Market Revenues & Volume Share, By Capacity, 2021 & 2031F |
3.6 Malta Direct Drive Wind Turbine Market Revenues & Volume Share, By Technology, 2021 & 2031F |
4 Malta Direct Drive Wind Turbine Market Dynamics |
4.1 Impact Analysis |
4.2 Market Drivers |
4.2.1 Increasing focus on renewable energy sources and sustainability goals |
4.2.2 Technological advancements in direct drive wind turbines leading to higher efficiency and reliability |
4.2.3 Government incentives and policies supporting the adoption of wind energy in Malta |
4.3 Market Restraints |
4.3.1 High initial investment costs associated with direct drive wind turbines |
4.3.2 Limited land availability for wind farm installations in Malta |
4.3.3 Regulatory challenges and permitting processes impacting project timelines |
5 Malta Direct Drive Wind Turbine Market Trends |
6 Malta Direct Drive Wind Turbine Market, By Types |
6.1 Malta Direct Drive Wind Turbine Market, By Capacity |
6.1.1 Overview and Analysis |
6.1.2 Malta Direct Drive Wind Turbine Market Revenues & Volume, By Capacity, 2021- 2031F |
6.1.3 Malta Direct Drive Wind Turbine Market Revenues & Volume, By Less than 1MW, 2021- 2031F |
6.1.4 Malta Direct Drive Wind Turbine Market Revenues & Volume, By 1MW to 3MW, 2021- 2031F |
6.1.5 Malta Direct Drive Wind Turbine Market Revenues & Volume, By More than 3MW, 2021- 2031F |
6.2 Malta Direct Drive Wind Turbine Market, By Technology |
6.2.1 Overview and Analysis |
6.2.2 Malta Direct Drive Wind Turbine Market Revenues & Volume, By Electrically Excited Synchronous Generator, 2021- 2031F |
6.2.3 Malta Direct Drive Wind Turbine Market Revenues & Volume, By Permanent Magnet Synchronous Generator, 2021- 2031F |
7 Malta Direct Drive Wind Turbine Market Import-Export Trade Statistics |
7.1 Malta Direct Drive Wind Turbine Market Export to Major Countries |
7.2 Malta Direct Drive Wind Turbine Market Imports from Major Countries |
8 Malta Direct Drive Wind Turbine Market Key Performance Indicators |
8.1 Average capacity factor of direct drive wind turbines in Malta |
8.2 Levelized Cost of Energy (LCOE) for direct drive wind energy projects in Malta |
8.3 Number of new direct drive wind turbine installations in Malta |
8.4 Average downtime of direct drive wind turbines in Malta |
8.5 Percentage of electricity generated from wind energy in Malta |
9 Malta Direct Drive Wind Turbine Market - Opportunity Assessment |
9.1 Malta Direct Drive Wind Turbine Market Opportunity Assessment, By Capacity, 2021 & 2031F |
9.2 Malta Direct Drive Wind Turbine Market Opportunity Assessment, By Technology, 2021 & 2031F |
10 Malta Direct Drive Wind Turbine Market - Competitive Landscape |
10.1 Malta Direct Drive Wind Turbine Market Revenue Share, By Companies, 2024 |
10.2 Malta Direct Drive Wind Turbine Market Competitive Benchmarking, By Operating and Technical Parameters |
11 Company Profiles |
12 Recommendations |
13 Disclaimer |
Export potential assessment - trade Analytics for 2030
Export potential enables firms to identify high-growth global markets with greater confidence by combining advanced trade intelligence with a structured quantitative methodology. The framework analyzes emerging demand trends and country-level import patterns while integrating macroeconomic and trade datasets such as GDP and population forecasts, bilateral import–export flows, tariff structures, elasticity differentials between developed and developing economies, geographic distance, and import demand projections. Using weighted trade values from 2020–2024 as the base period to project country-to-country export potential for 2030, these inputs are operationalized through calculated drivers such as gravity model parameters, tariff impact factors, and projected GDP per-capita growth. Through an analysis of hidden potentials, demand hotspots, and market conditions that are most favorable to success, this method enables firms to focus on target countries, maximize returns, and global expansion with data, backed by accuracy.
By factoring in the projected importer demand gap that is currently unmet and could be potential opportunity, it identifies the potential for the Exporter (Country) among 190 countries, against the general trade analysis, which identifies the biggest importer or exporter.
To discover high-growth global markets and optimize your business strategy:
Click Here
Pricing
- Single User License$ 1,995
- Department License$ 2,400
- Site License$ 3,120
- Global License$ 3,795

Search
Thought Leadership and Analyst Meet


Our Clients
Latest Reports
- India Ultrasonic Smart Water Meter Market (2026-2032) | Outlook, Competition, Drivers, Trends, Demand, Competitive, Strategic Insights, Companies, Challenges, Strategy, Consumer Insights, Analysis, Opportunities, Growth, Size, Share, Industry, Revenue, Segments, Value, Segmentation, Supply, Forecast, Restraints,
- India Electromagnetic Bulk Flow Meter Market (2026-2032) | Analysis, Challenges, Strategic Insights, Supply, Forecast, Growth, Share, Consumer Insights, Competitive, Value, Outlook, Size & Demand,
- India Battery Powered Bulk Flow Meter Market (2026-2032) | Outlook, Analysis, Competitive Landscape, Growth, Size, Trends, Value, Revenue, Companies, Segmentation, Share & Forecast
- Bosnia and Herzegovina Fuel-Efficient Winglets Market (2026-2032) | Growth, Competition, Strategy, Restraints, Trends, Challenges, segmentation, Value, Outlook, Investment Opportunities, Analysis, Revenue, Companies, Insights, Pricing, Size, Drivers, Demand, Share, Forecast
- Canada Cloud CFD Market (2026-2032) | Size & Revenue, Industry, Growth, Competitive Landscape, Forecast, Segmentation, Value, Outlook, Trends, Share, Analysis, Companies
- Taiwan Food Delivery Platform Market (2026-2032) | Companies, Outlook, Analysis, Trends, Value, Revenue, Segmentation, Share, Forecast, Competitive Landscape, Growth, Size & Forecast
- United Kingdom (UK) Long-term Care Insurance Market (2026-2032) | Growth, Share, Consumer Insights, Drivers, Opportunities, Competition, Pricing Analysis, Segments, Restraints, Companies, Competitive, Value, Outlook, Size, Demand, Analysis, Challenges, Strategic Insights, Investment Trends, Revenue, Trends, Supply, Forecast
- United Kingdom (UK) Long Term Care Market (2026-2032) | Companies, Outlook, Analysis, Trends, Value, Revenue, Segmentation, Share, Forecast, Competitive Landscape, Growth, Size & Forecast
- Iraq Insulation and Waterproofing Market (2026-2032) | Outlook, Drivers, Growth, Size, Share, Industry, Revenue, Trends, Demand, Competitive, Strategic Insights, Opportunities, Segments, Companies, Challenges, Strategy, Consumer Insights, Analysis, Investment Trends, Value, Segmentation, Forecast, Restraints
- India Switchgear Market Outlook (2026-2032) | Size, Share, Trends, Growth, Revenue, Forecast, Analysis, Value, Outlook
Industry Events and Analyst Meet

India EV Show 2026

EV tech India Expo 2026

Auto Tech Asia 2026

Battery Tech India 2026

Smart Production Solutions Guangzhou 2026
Whitepaper
- Middle East & Africa Commercial Security Market Click here to view more.
- Middle East & Africa Fire Safety Systems & Equipment Market Click here to view more.
- GCC Drone Market Click here to view more.
- Middle East Lighting Fixture Market Click here to view more.
- GCC Physical & Perimeter Security Market Click here to view more.
6WResearch In News
- Doha a strategic location for EV manufacturing hub: IPA Qatar
- Demand for luxury TVs surging in the GCC, says Samsung
- Empowering Growth: The Thriving Journey of Bangladesh’s Cable Industry
- Demand for luxury TVs surging in the GCC, says Samsung
- Video call with a traditional healer? Once unthinkable, it’s now common in South Africa
- Intelligent Buildings To Smooth GCC’s Path To Net Zero