Malta Gate Valve Market (2026-2032) | Growth, Value, Companies, Trends, Share, Industry, Analysis, Competitive Landscape, Size & Revenue, Outlook, Forecast, Segmentation
Market Forecast By End-user Industry (Power, Water and Wastewater Management, Chemicals, Oil and Gas, Food Processing, Mining, Marine) And Competitive Landscape
| Product Code: ETC8193140 | Publication Date: Sep 2024 | Updated Date: Apr 2026 | Product Type: Market Research Report | |
| Publisher: 6Wresearch | Author: Vasudha | No. of Pages: 75 | No. of Figures: 35 | No. of Tables: 20 |
Malta Gate Valve Market Size (2020-2030)
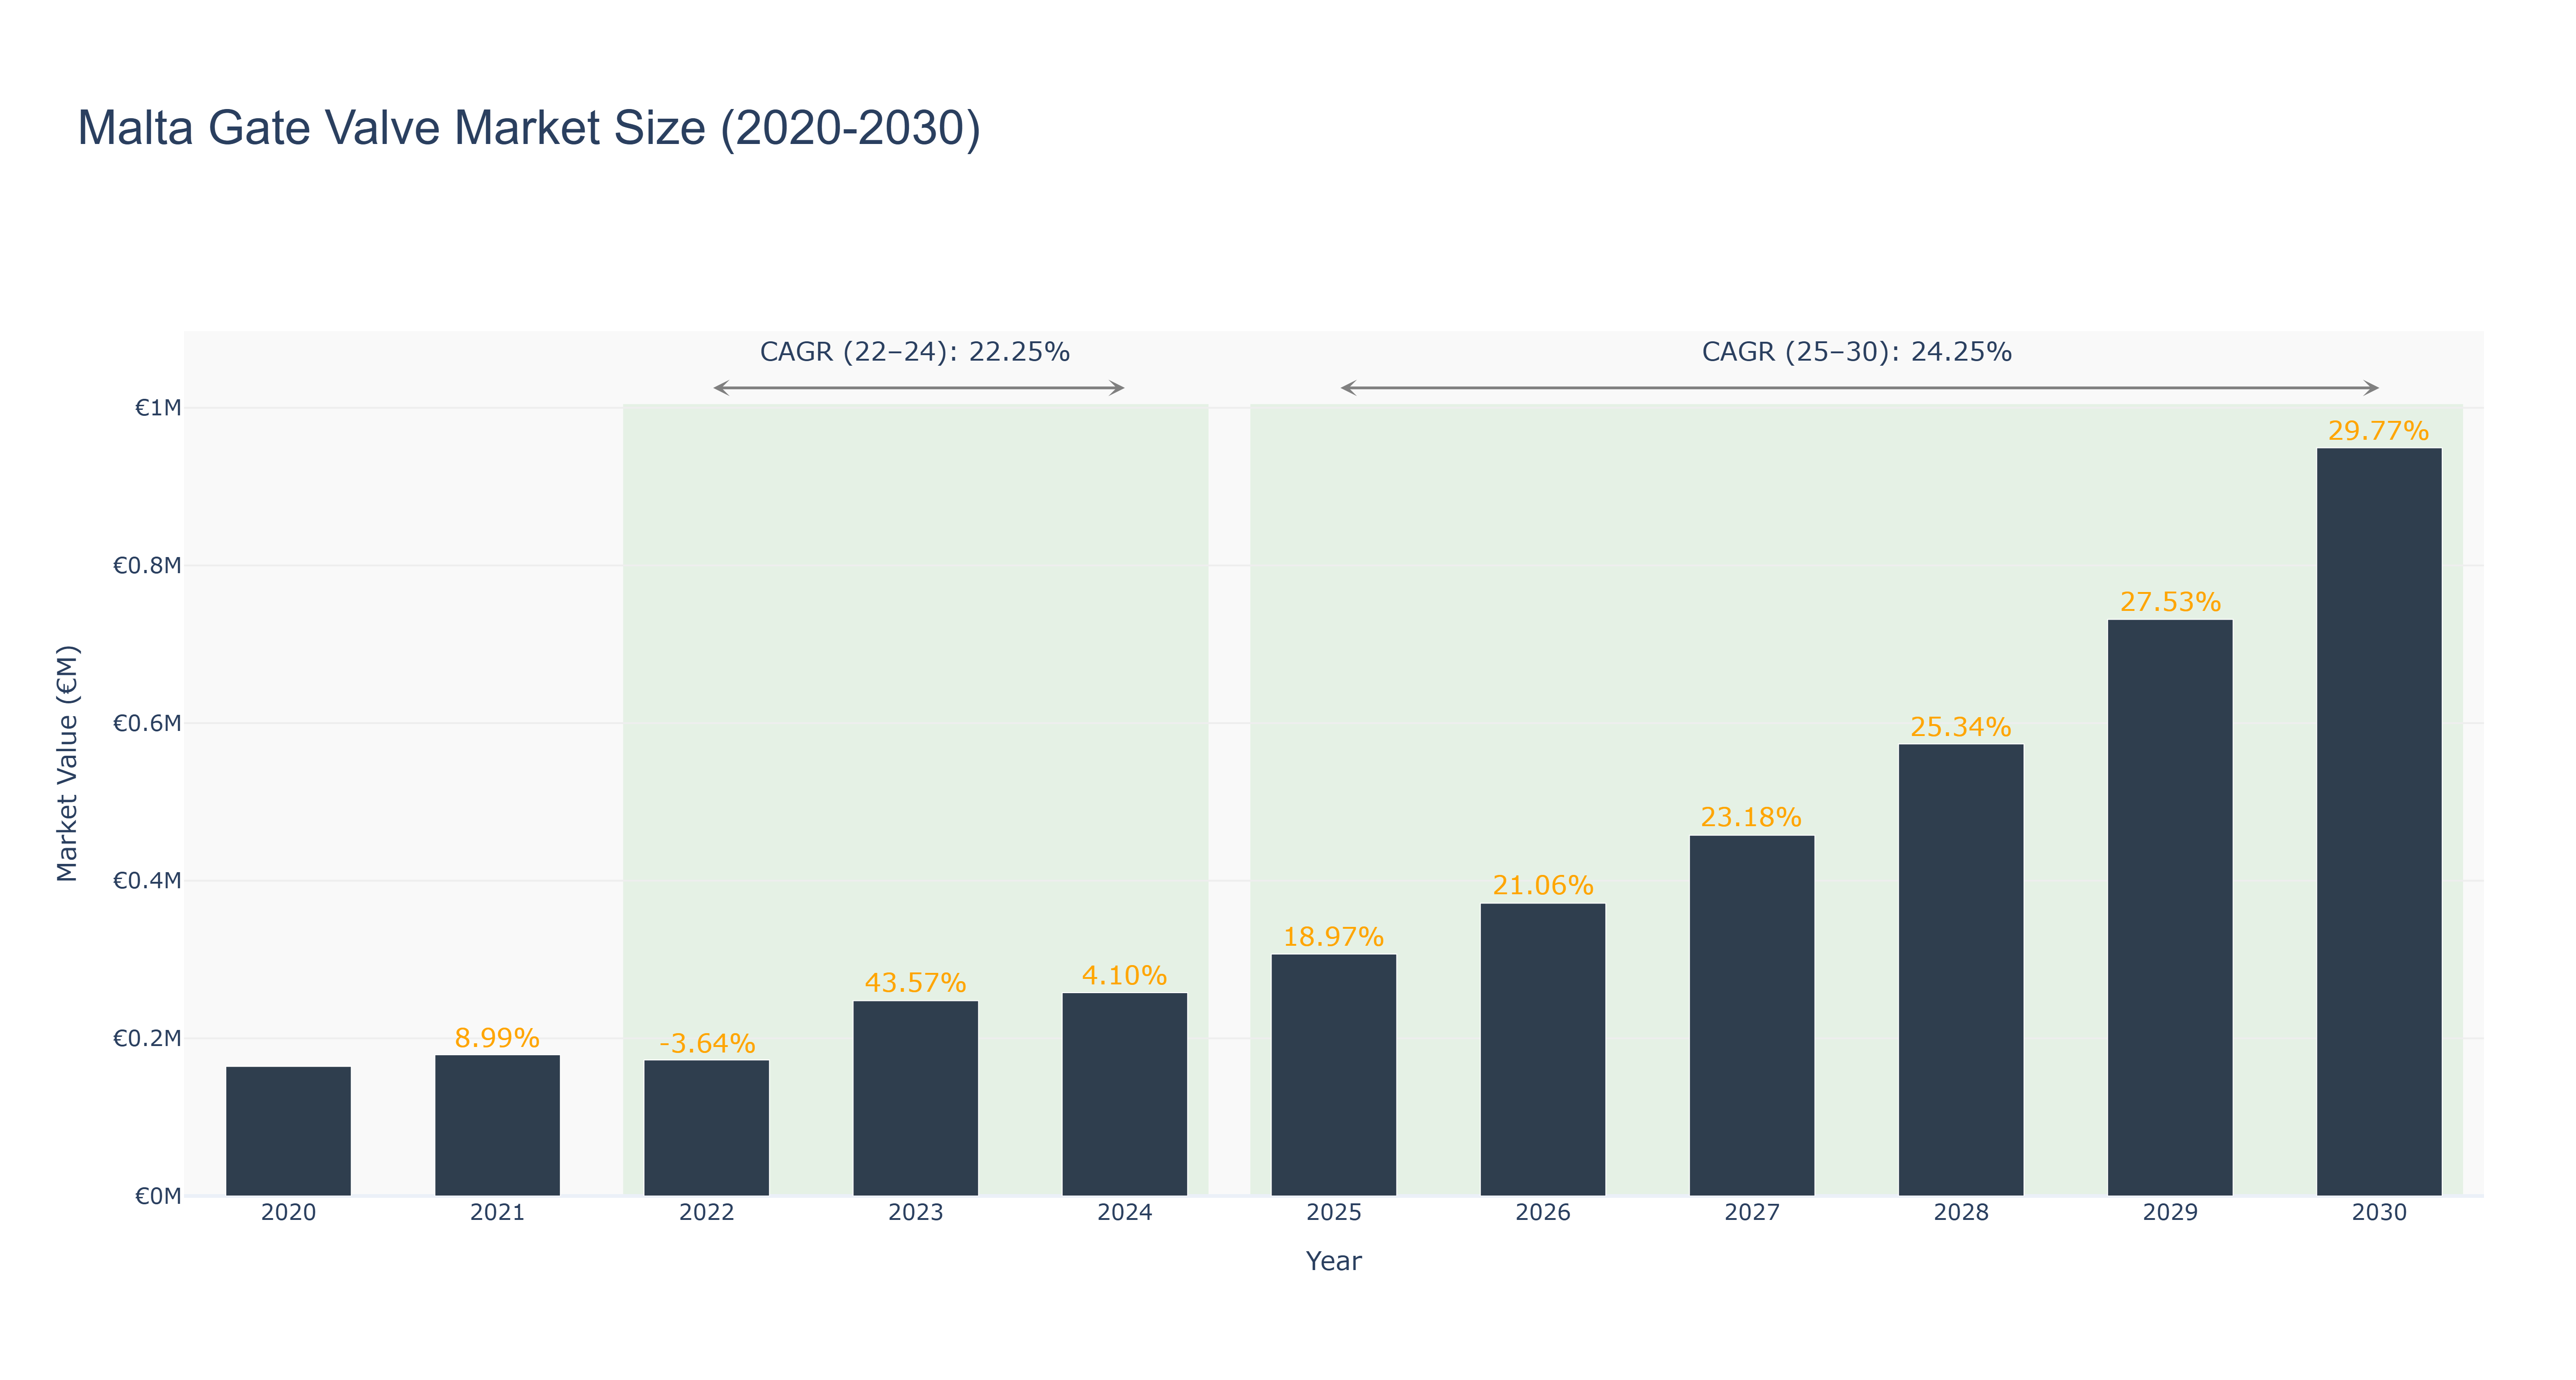
The Malta Gate Valve Market has exhibited significant fluctuations in its actual performance from 2020 to 2024, peaking at €257.96 thousand in 2024, following a robust recovery from a decline in 2022. The market experienced a notable growth rate of 43.57% in 2023, driven by increased infrastructure investments and rising demand for efficient water management systems. The compound annual growth rate (CAGR) for the actual data from 2022 to 2024 stands at 22.25%. Looking ahead, the forecasted period from 2025 to 2030 shows an optimistic trend, with the market projected to reach €949.25 thousand by 2030, reflecting a CAGR of 24.25%. This growth is anticipated to be fueled by ongoing urban development projects and heightened regulatory focus on sustainable water practices, positioning the Malta Gate Valve Market for continued expansion in the coming years.
Malta Gate Valve Market: Production & Trade Performance (2019-2025)
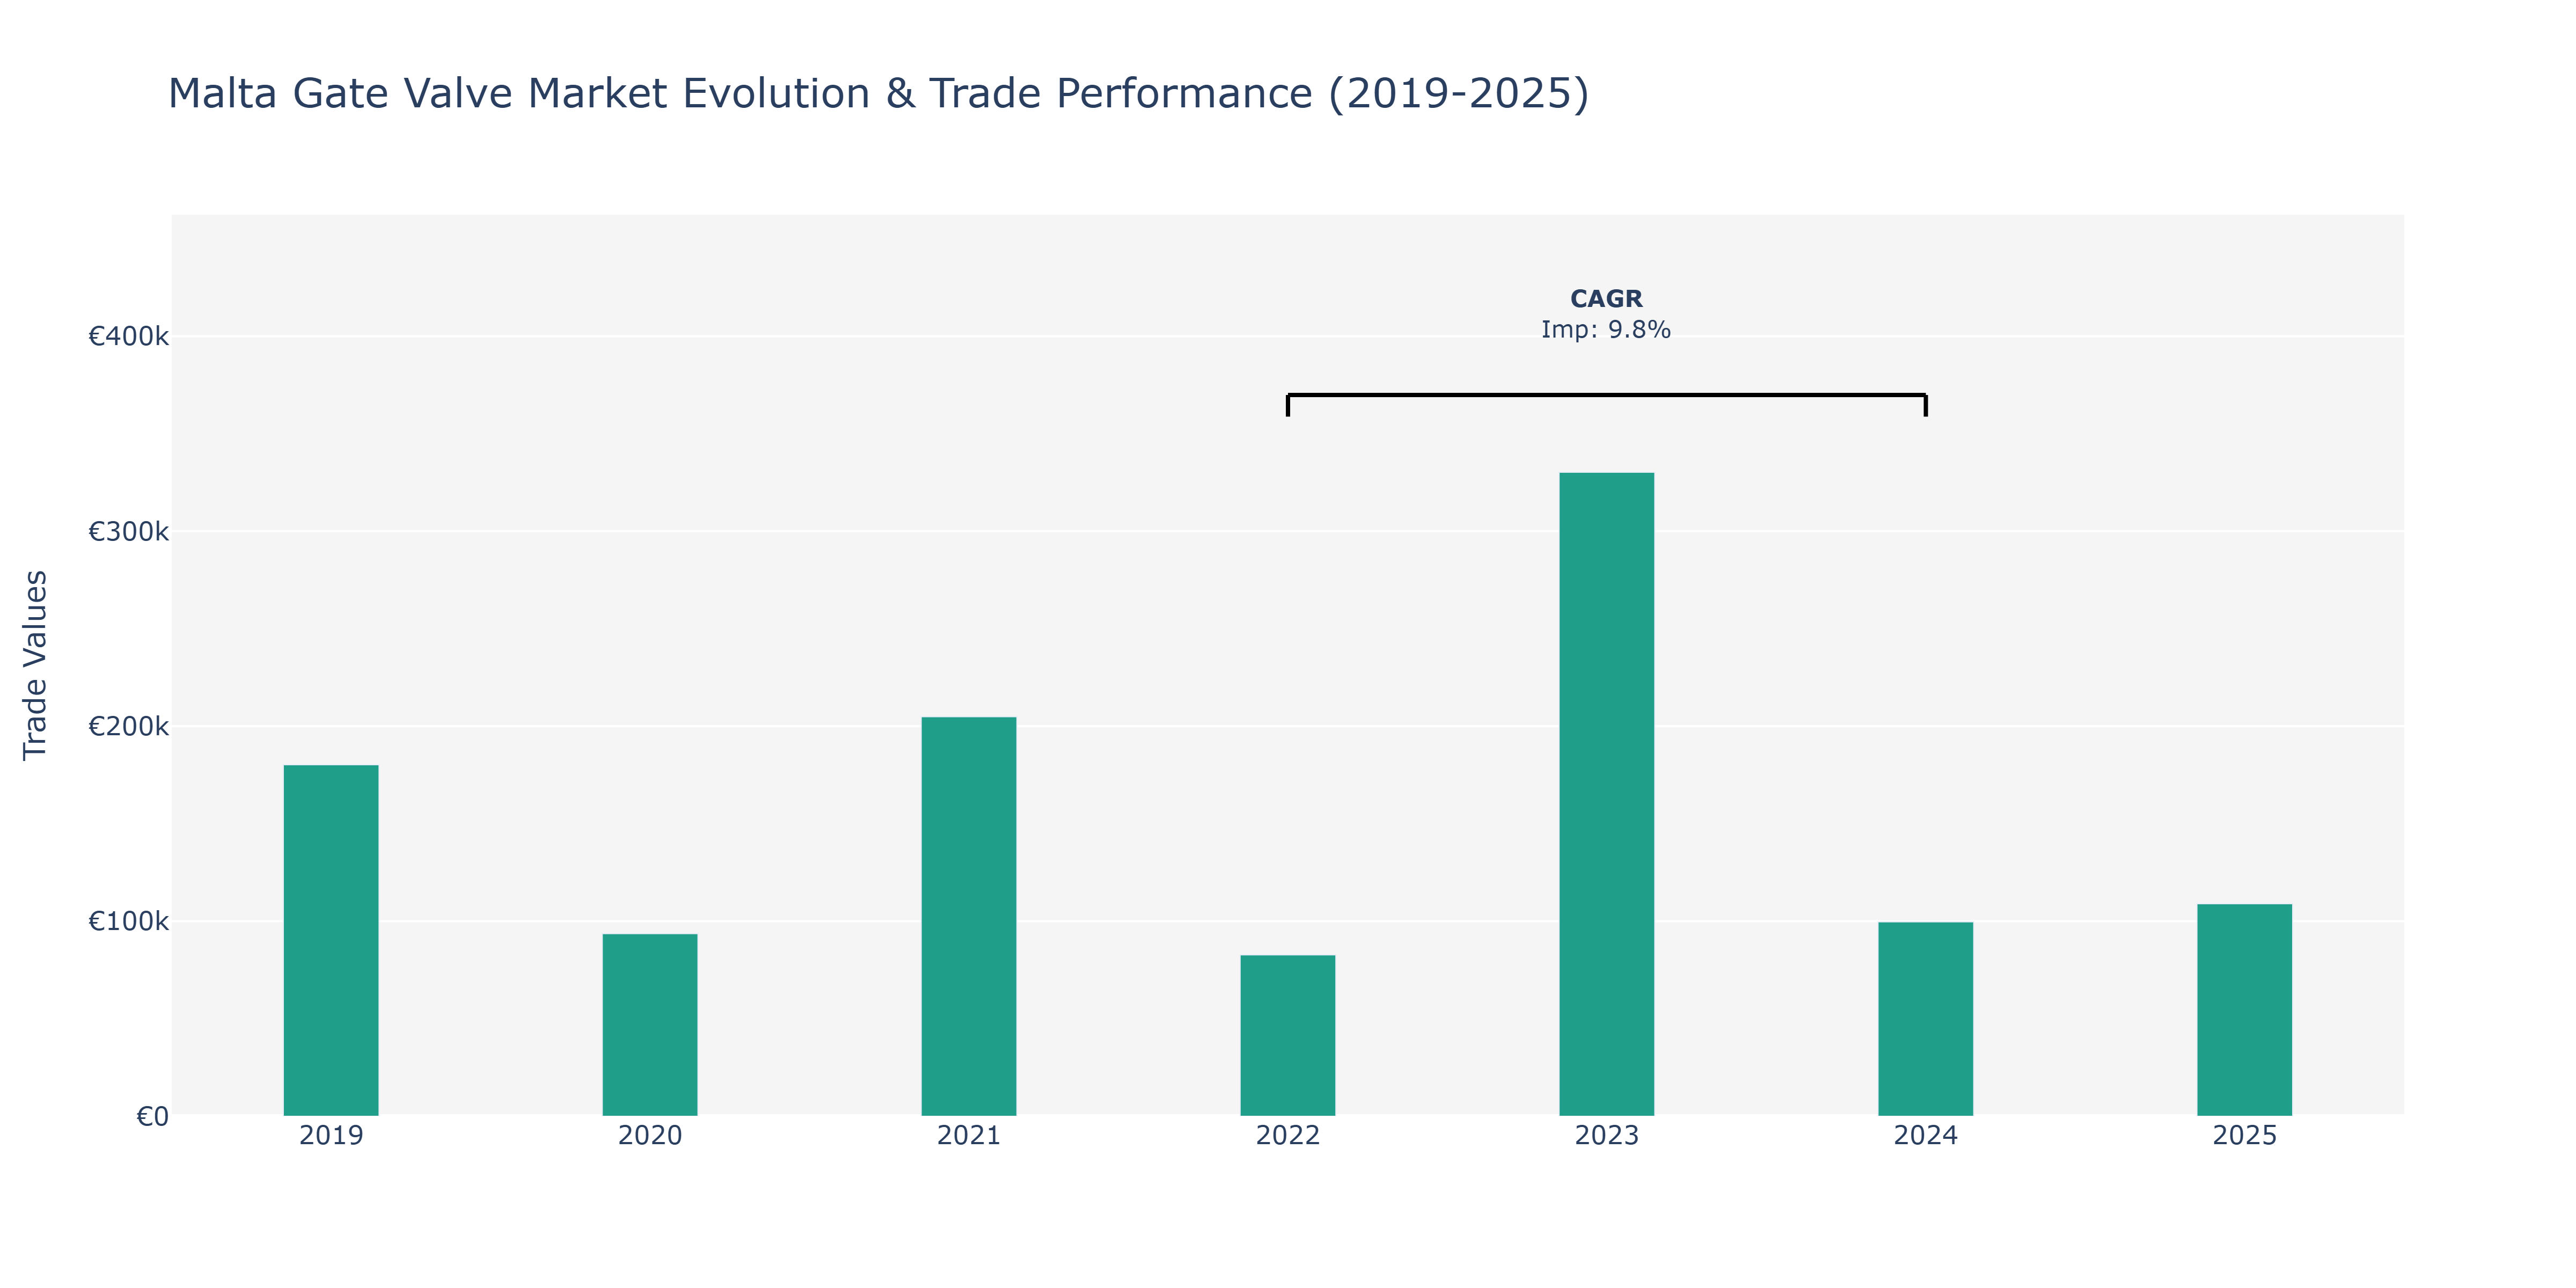
In the Malta Gate Valve Market, imports exhibited notable fluctuations over the years. In 2019, imports stood at €180.28 thousand, marking a substantial drop to €93.64 thousand in 2020, likely influenced by global economic uncertainties. The following year, 2021, saw a considerable recovery with imports reaching €204.9 thousand, potentially driven by increased infrastructure projects and industrial activities. However, in 2022, imports decreased to €82.76 thousand, reflecting a temporary downturn, possibly due to supply chain disruptions or shifts in trade policies. The trend reversed significantly in 2023, skyrocketing to €330.23 thousand, signaling a robust resurgence attributed to growing demand for gate valve products in various sectors. By 2024, imports declined to €99.7 thousand, indicating a corrective phase post the peak in 2023. The market's volatility underscores the sensitivity of import dynamics to both domestic and international market conditions, necessitating strategic planning and adaptability for stakeholders in the Malta Gate Valve Market.
Key Highlights of the Report:
- Malta Gate Valve Market Outlook
- Market Size of Malta Gate Valve Market, 2025
- Forecast of Malta Gate Valve Market, 2032
- Historical Data and Forecast of Malta Gate Valve Revenues & Volume for the Period 2022 - 2032
- Malta Gate Valve Market Trend Evolution
- Malta Gate Valve Market Drivers and Challenges
- Malta Gate Valve Price Trends
- Malta Gate Valve Porter's Five Forces
- Malta Gate Valve Industry Life Cycle
- Historical Data and Forecast of Malta Gate Valve Market Revenues & Volume By End-user Industry for the Period 2022 - 2032
- Historical Data and Forecast of Malta Gate Valve Market Revenues & Volume By Power for the Period 2022 - 2032
- Historical Data and Forecast of Malta Gate Valve Market Revenues & Volume By Water and Wastewater Management for the Period 2022 - 2032
- Historical Data and Forecast of Malta Gate Valve Market Revenues & Volume By Chemicals for the Period 2022 - 2032
- Historical Data and Forecast of Malta Gate Valve Market Revenues & Volume By Oil and Gas for the Period 2022 - 2032
- Historical Data and Forecast of Malta Gate Valve Market Revenues & Volume By Food Processing for the Period 2022 - 2032
- Historical Data and Forecast of Malta Gate Valve Market Revenues & Volume By Mining for the Period 2022 - 2032
- Historical Data and Forecast of Malta Gate Valve Market Revenues & Volume By Marine for the Period 2022 - 2032
- Malta Gate Valve Import Export Trade Statistics
- Market Opportunity Assessment By End-user Industry
- Malta Gate Valve Top Companies Market Share
- Malta Gate Valve Competitive Benchmarking By Technical and Operational Parameters
- Malta Gate Valve Company Profiles
- Malta Gate Valve Key Strategic Recommendations
Frequently Asked Questions About the Market Study (FAQs):
6Wresearch actively monitors the Malta Gate Valve Market and publishes its comprehensive annual report, highlighting emerging trends, growth drivers, revenue analysis, and forecast outlook. Our insights help businesses to make data-backed strategic decisions with ongoing market dynamics. Our analysts track relevent industries related to the Malta Gate Valve Market, allowing our clients with actionable intelligence and reliable forecasts tailored to emerging regional needs.
Yes, we provide customisation as per your requirements. To learn more, feel free to contact us on sales@6wresearch.com
1 Executive Summary |
2 Introduction |
2.1 Key Highlights of the Report |
2.2 Report Description |
2.3 Market Scope & Segmentation |
2.4 Research Methodology |
2.5 Assumptions |
3 Malta Gate Valve Market Overview |
3.1 Malta Country Macro Economic Indicators |
3.2 Malta Gate Valve Market Revenues & Volume, 2022 & 2032F |
3.3 Malta Gate Valve Market - Industry Life Cycle |
3.4 Malta Gate Valve Market - Porter's Five Forces |
3.5 Malta Gate Valve Market Revenues & Volume Share, By End-user Industry, 2022 & 2032F |
4 Malta Gate Valve Market Dynamics |
4.1 Impact Analysis |
4.2 Market Drivers |
4.2.1 Increasing demand for water and wastewater treatment infrastructure projects in Malta |
4.2.2 Growing focus on energy efficiency and sustainability in industrial applications |
4.2.3 Rise in construction activities and infrastructure development projects in Malta |
4.3 Market Restraints |
4.3.1 Intense competition from other types of valves such as ball valves and butterfly valves |
4.3.2 Volatility in raw material prices affecting manufacturing costs |
4.3.3 Impact of economic fluctuations on overall investment in infrastructure projects |
5 Malta Gate Valve Market Trends |
6 Malta Gate Valve Market, By Types |
6.1 Malta Gate Valve Market, By End-user Industry |
6.1.1 Overview and Analysis |
6.1.2 Malta Gate Valve Market Revenues & Volume, By End-user Industry, 2022 - 2032F |
6.1.3 Malta Gate Valve Market Revenues & Volume, By Power, 2022 - 2032F |
6.1.4 Malta Gate Valve Market Revenues & Volume, By Water and Wastewater Management, 2022 - 2032F |
6.1.5 Malta Gate Valve Market Revenues & Volume, By Chemicals, 2022 - 2032F |
6.1.6 Malta Gate Valve Market Revenues & Volume, By Oil and Gas, 2022 - 2032F |
6.1.7 Malta Gate Valve Market Revenues & Volume, By Food Processing, 2022 - 2032F |
6.1.8 Malta Gate Valve Market Revenues & Volume, By Mining, 2022 - 2032F |
7 Malta Gate Valve Market Import-Export Trade Statistics |
7.1 Malta Gate Valve Market Export to Major Countries |
7.2 Malta Gate Valve Market Imports from Major Countries |
8 Malta Gate Valve Market Key Performance Indicators |
8.1 Number of new water and wastewater treatment projects initiated in Malta |
8.2 Adoption rate of energy-efficient gate valves in industrial sectors |
8.3 Growth in the construction sector in Malta as indicated by building permits issued |
9 Malta Gate Valve Market - Opportunity Assessment |
9.1 Malta Gate Valve Market Opportunity Assessment, By End-user Industry, 2022 & 2032F |
10 Malta Gate Valve Market - Competitive Landscape |
10.1 Malta Gate Valve Market Revenue Share, By Companies, 2025 |
10.2 Malta Gate Valve Market Competitive Benchmarking, By Operating and Technical Parameters |
11 Company Profiles |
12 Recommendations |
13 Disclaimer |
Global Go To Market Strategy - 2030
Export potential enables firms to identify high-growth global markets with greater confidence by combining advanced trade intelligence with a structured quantitative methodology. The framework analyzes emerging demand trends and country-level import patterns while integrating macroeconomic and trade datasets such as GDP and population forecasts, bilateral import–export flows, tariff structures, elasticity differentials between developed and developing economies, geographic distance, and import demand projections. Using weighted trade values from 2020–2024 as the base period to project country-to-country export potential for 2030, these inputs are operationalized through calculated drivers such as gravity model parameters, tariff impact factors, and projected GDP per-capita growth. Through an analysis of hidden potentials, demand hotspots, and market conditions that are most favorable to success, this method enables firms to focus on target countries, maximize returns, and global expansion with data, backed by accuracy.
By factoring in the projected importer demand gap that is currently unmet and could be potential opportunity, it identifies the potential for the Exporter (Country) among 190 countries, against the general trade analysis, which identifies the biggest importer or exporter.
To discover high-growth global markets and optimize your business strategy:
Click Here
Pricing
- Single User License$ 1,995
- Department License$ 2,400
- Site License$ 3,120
- Global License$ 3,795

Leadership Perspectives from Industry Events
Search
Thought Leadership and Analyst Meet


Our Clients
6WResearch In News
- Doha a strategic location for EV manufacturing hub: IPA Qatar
- Demand for luxury TVs surging in the GCC, says Samsung
- Empowering Growth: The Thriving Journey of Bangladesh’s Cable Industry
- Demand for luxury TVs surging in the GCC, says Samsung
- Video call with a traditional healer? Once unthinkable, it’s now common in South Africa
- Intelligent Buildings To Smooth GCC’s Path To Net Zero
Latest Reports
- Taiwan Airport Wireless Infrastructure Market (2026-2032)
- Vietnam Airport Wireless Infrastructure Market (2026-2032)
- Thailand Airport Wireless Infrastructure Market (2026-2032)
- South Korea Airport Wireless Infrastructure Market (2026-2032)
- Romania Airport Wireless Infrastructure Market (2026-2032)
- Qatar Airport Wireless Infrastructure Market (2026-2032)
- Philippines Airport Wireless Infrastructure Market (2026-2032)
- Japan Airport Wireless Infrastructure Market (2026-2032)
- Taiwan Airport Winter Services Market (2026-2032)
- Vietnam Airport Winter Services Market (2026-2032)
Industry Events and Analyst Meet

HIMTEX 2026

India Refining Summit 2026

India EV Show 2026

EV tech India Expo 2026

Auto Tech Asia 2026
Whitepaper
- Middle East & Africa Commercial Security Market Click here to view more.
- Middle East & Africa Fire Safety Systems & Equipment Market Click here to view more.
- GCC Drone Market Click here to view more.
- Middle East Lighting Fixture Market Click here to view more.
- GCC Physical & Perimeter Security Market Click here to view more.