Malta Styrene Market (2025-2031) | Companies, Revenue, Industry, Value, Growth, Share, Outlook, Forecast, Analysis, Segmentation, Trends & Size
Market Forecast By Type (Acrylonitrile Butadiene Styrene (ABS), Expanded Polystyrene (EPS), Others), By Application (Automotive, Construction, Packaging Consumer Goods, Others), By Distribution Channel (Offline, Online) And Competitive Landscape
| Product Code: ETC5322858 | Publication Date: Nov 2023 | Updated Date: Apr 2026 | Product Type: Market Research Report | |
| Publisher: 6Wresearch | Author: Ravi Bhandari | No. of Pages: 60 | No. of Figures: 30 | No. of Tables: 5 |
Malta Styrene Market Size (2020-2030)
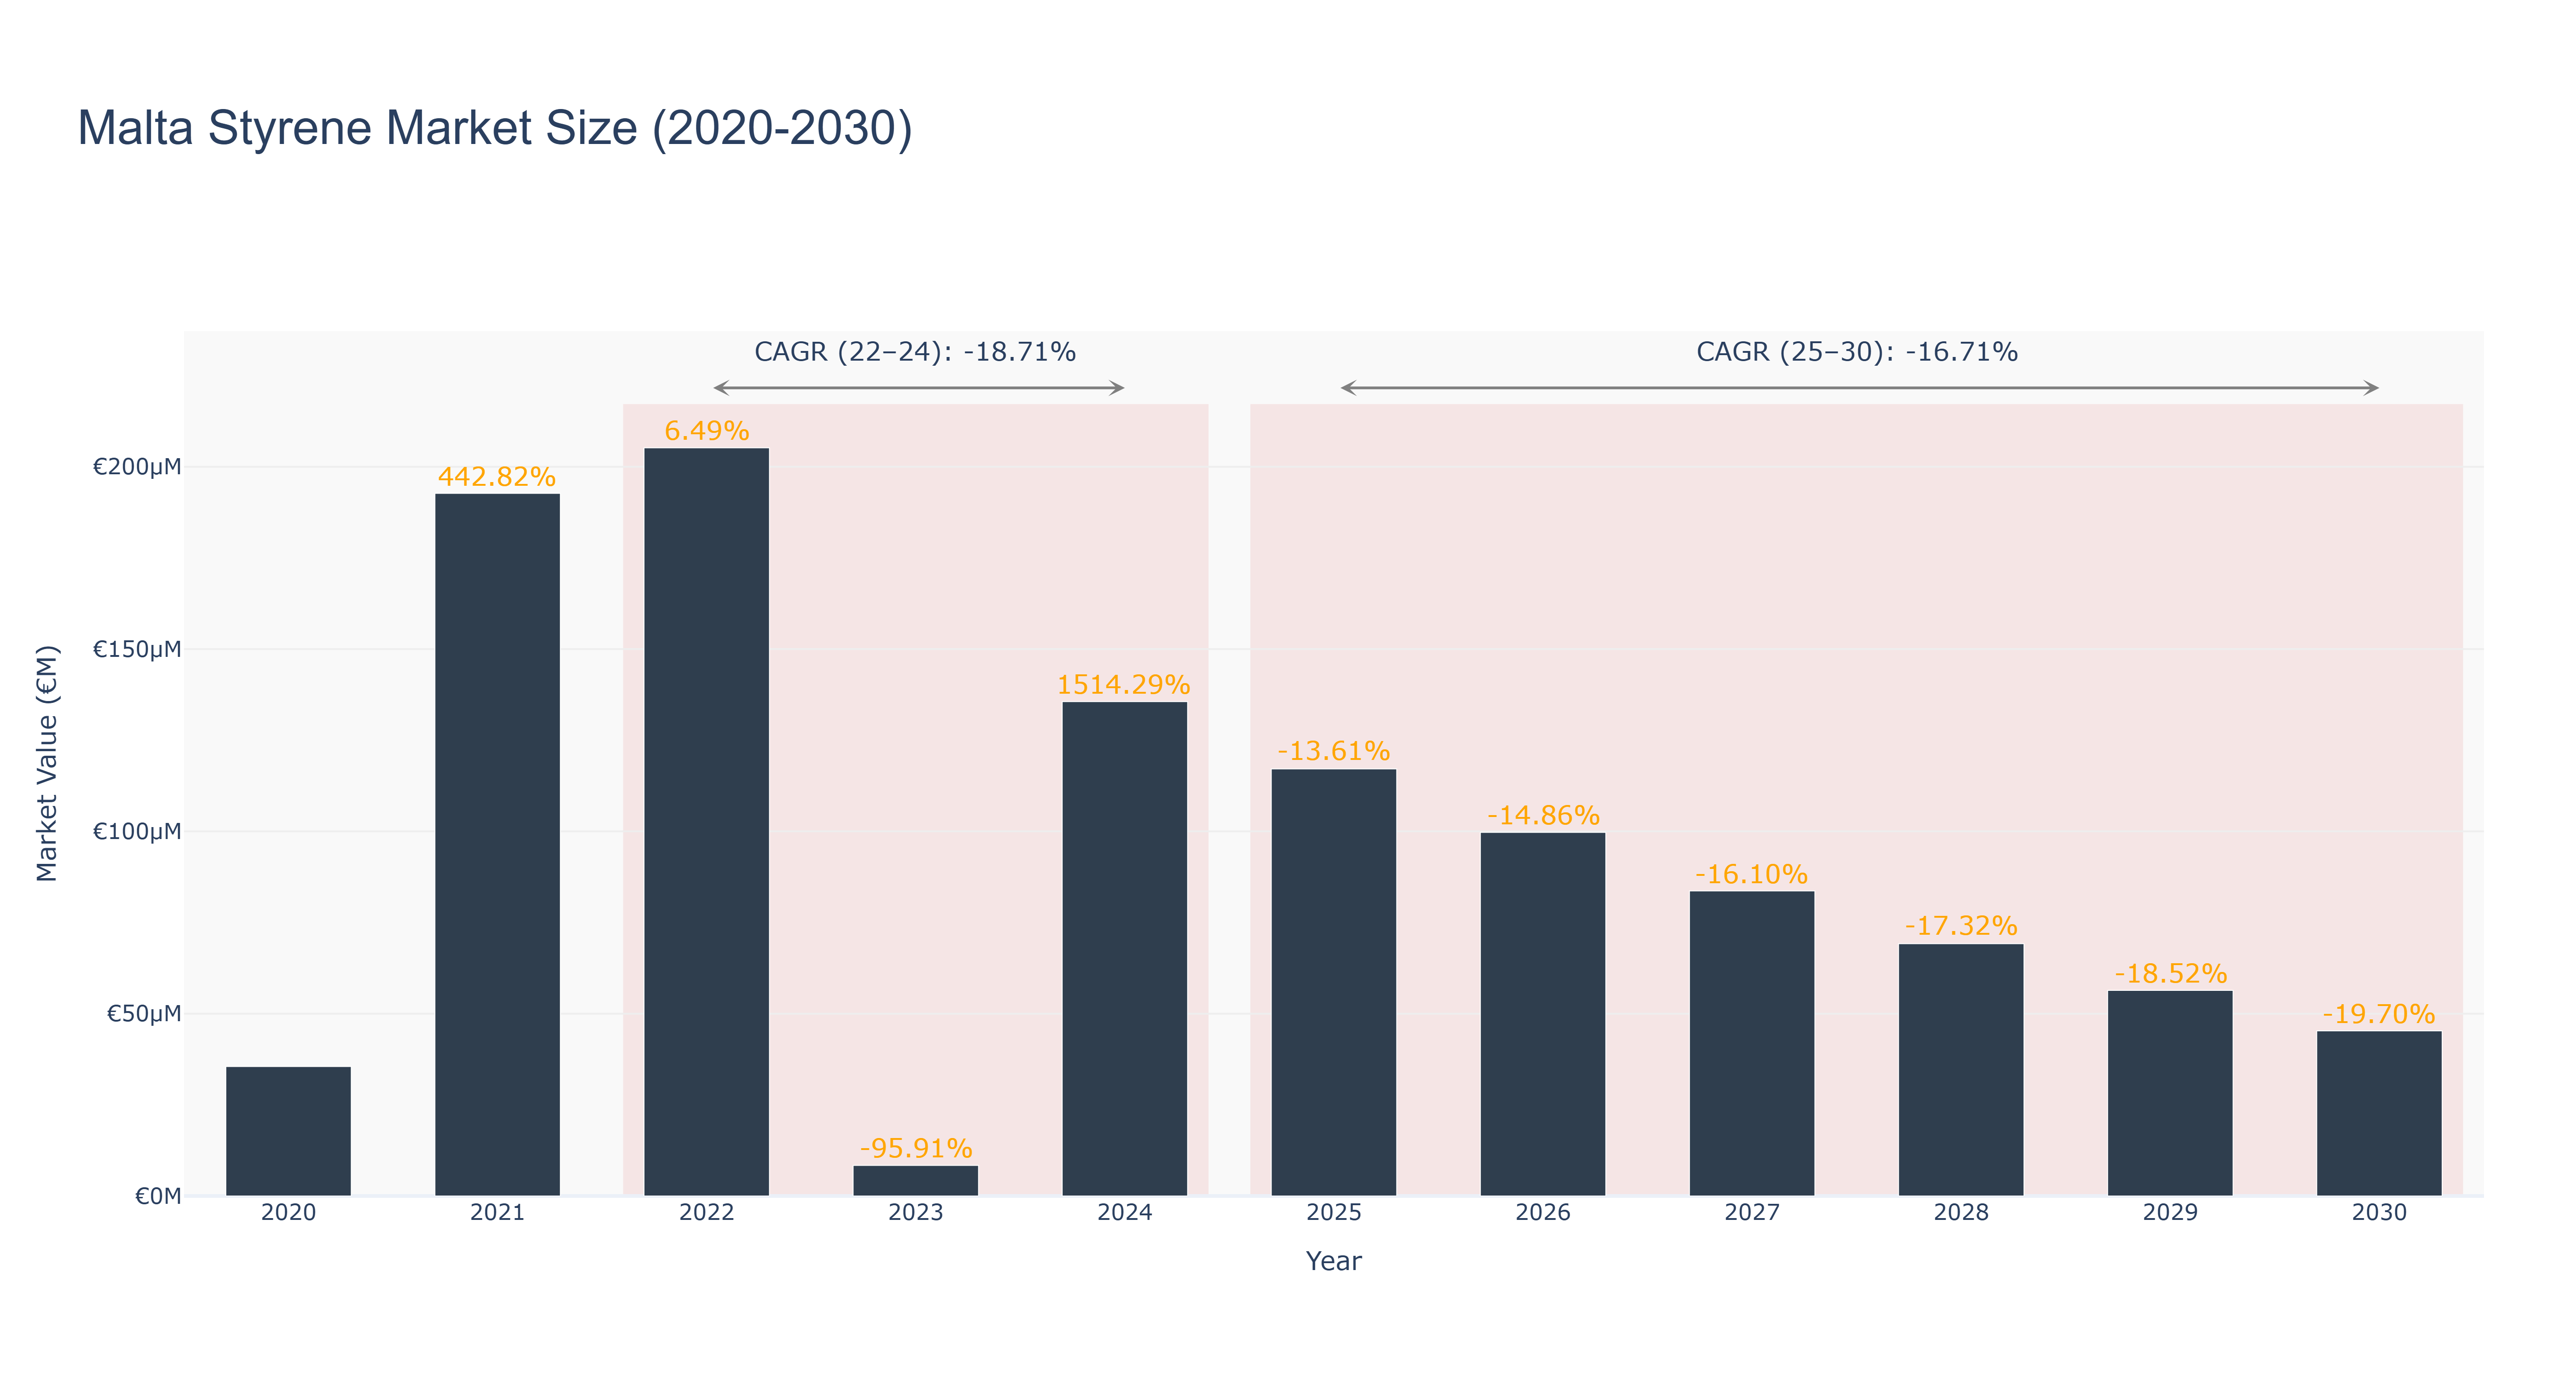
The Malta Styrene Market has experienced significant fluctuations, characterized by a dramatic peak in 2021 with a market size of €192.70, following a modest €35.50 in 2020. The actual market size reached €205.20 in 2022 before plummeting to €8.40 in 2023, reflecting a staggering growth decline of -95.91%. The market is expected to rebound to €135.60 in 2024, resulting in a negative CAGR of -18.71% from 2022 to 2024. Looking ahead, the forecasted market size is projected to decline steadily to €45.27 by 2030, with a CAGR of -16.71% from 2025 to 2030. This downturn may be driven by market saturation, competitive pressures, and potential shifts in consumer preferences. While specific upcoming projects are not detailed, macroeconomic factors and regulatory changes could influence future dynamics in the styrene sector in Malta.
Malta Styrene Market: Production & Trade Performance (2019-2025)
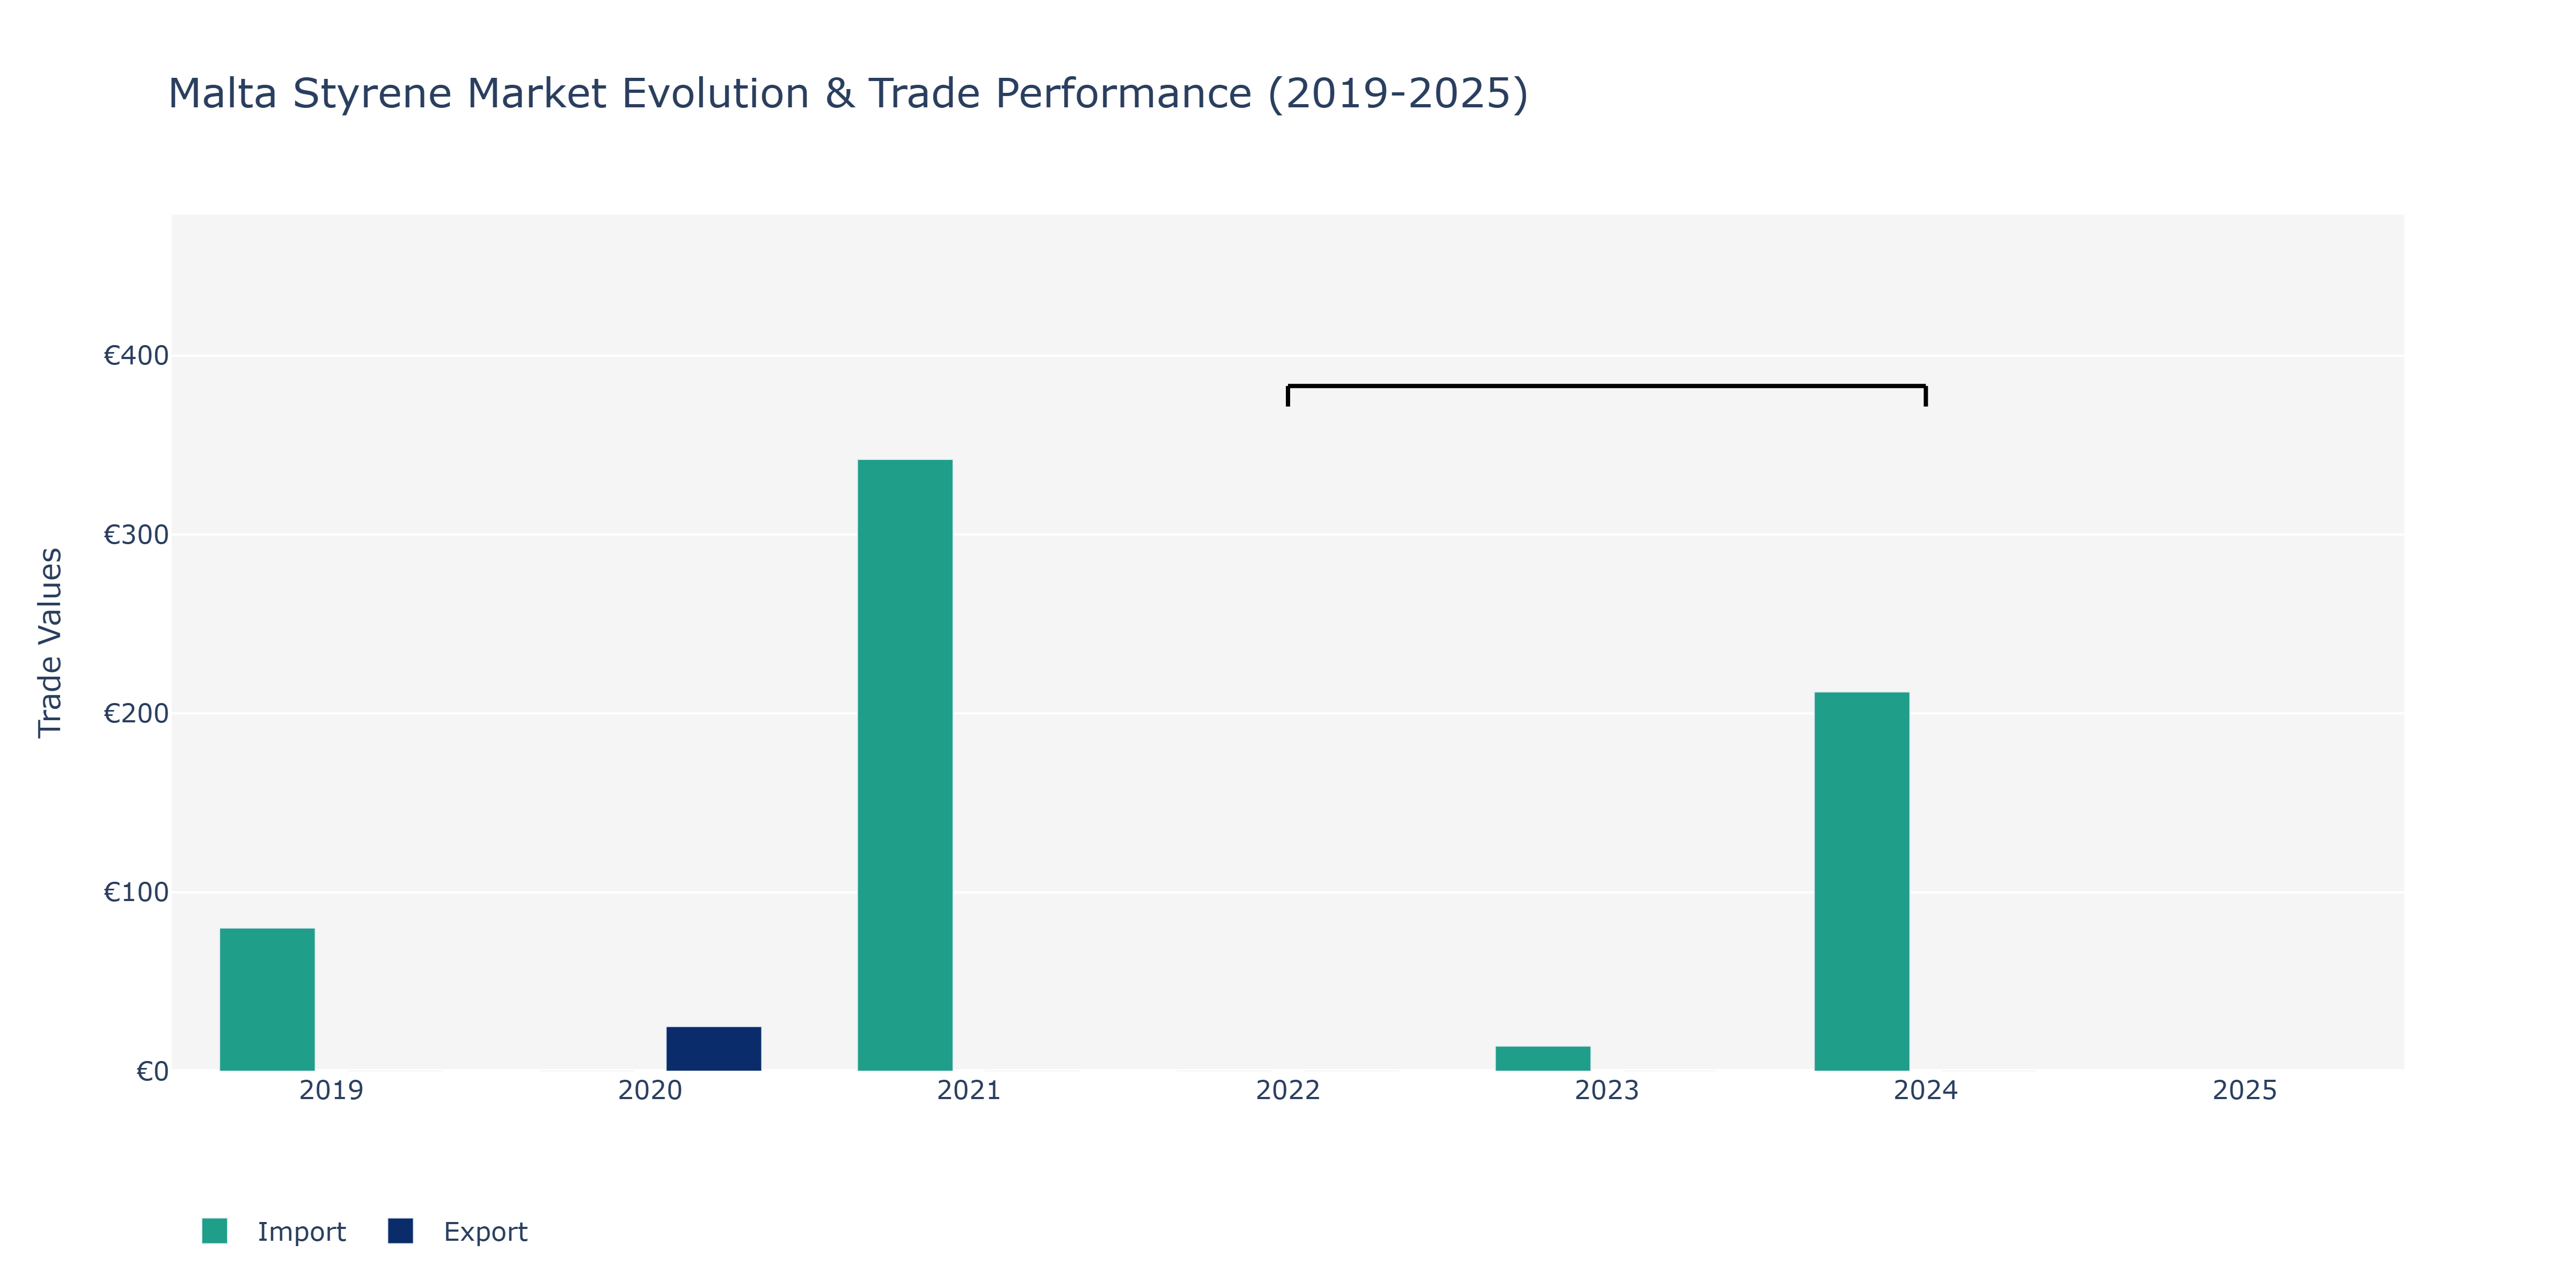
In the Malta Styrene Market, the data reveals notable fluctuations in both Exports and Imports over the years. In 2019, imports stood at €80.0 million, significantly higher than the €25.0 million in exports recorded in 2020. The year 2021 saw a substantial surge in imports to €342.0 million, showcasing a clear upward trend. However, by 2023, imports dropped to €14.0 million before rebounding to €212.0 million in 2024. These fluctuations can be attributed to various factors such as changes in demand from domestic industries, global market conditions affecting trade flows, and regulatory developments impacting import-export policies. For instance, a surge in construction projects in Malta could have driven the increased demand for styrene, consequently impacting import volumes. Such market dynamics underline the importance of staying abreast of industry trends to navigate the volatility in the Malta Styrene Market effectively.
Key Highlights of the Report:
- Malta Styrene Market Outlook
- Market Size of Malta Styrene Market, 2024
- Forecast of Malta Styrene Market, 2031
- Historical Data and Forecast of Malta Styrene Revenues & Volume for the Period 2021-2031
- Malta Styrene Market Trend Evolution
- Malta Styrene Market Drivers and Challenges
- Malta Styrene Price Trends
- Malta Styrene Porter`s Five Forces
- Malta Styrene Industry Life Cycle
- Historical Data and Forecast of Malta Styrene Market Revenues & Volume By Type for the Period 2021-2031
- Historical Data and Forecast of Malta Styrene Market Revenues & Volume By Acrylonitrile Butadiene Styrene (ABS) for the Period 2021-2031
- Historical Data and Forecast of Malta Styrene Market Revenues & Volume By Expanded Polystyrene (EPS) for the Period 2021-2031
- Historical Data and Forecast of Malta Styrene Market Revenues & Volume By Others for the Period 2021-2031
- Historical Data and Forecast of Malta Styrene Market Revenues & Volume By Application for the Period 2021-2031
- Historical Data and Forecast of Malta Styrene Market Revenues & Volume By Automotive for the Period 2021-2031
- Historical Data and Forecast of Malta Styrene Market Revenues & Volume By Construction for the Period 2021-2031
- Historical Data and Forecast of Malta Styrene Market Revenues & Volume By Packaging Consumer Goods for the Period 2021-2031
- Historical Data and Forecast of Malta Styrene Market Revenues & Volume By Others for the Period 2021-2031
- Historical Data and Forecast of Malta Styrene Market Revenues & Volume By Distribution Channel for the Period 2021-2031
- Historical Data and Forecast of Malta Styrene Market Revenues & Volume By Offline for the Period 2021-2031
- Historical Data and Forecast of Malta Styrene Market Revenues & Volume By Online for the Period 2021-2031
- Malta Styrene Import Export Trade Statistics
- Market Opportunity Assessment By Type
- Market Opportunity Assessment By Application
- Market Opportunity Assessment By Distribution Channel
- Malta Styrene Top Companies Market Share
- Malta Styrene Competitive Benchmarking By Technical and Operational Parameters
- Malta Styrene Company Profiles
- Malta Styrene Key Strategic Recommendations
Frequently Asked Questions About the Market Study (FAQs):
6Wresearch actively monitors the Malta Styrene Market and publishes its comprehensive annual report, highlighting emerging trends, growth drivers, revenue analysis, and forecast outlook. Our insights help businesses to make data-backed strategic decisions with ongoing market dynamics. Our analysts track relevent industries related to the Malta Styrene Market, allowing our clients with actionable intelligence and reliable forecasts tailored to emerging regional needs.
Yes, we provide customisation as per your requirements. To learn more, feel free to contact us on sales@6wresearch.com
1 Executive Summary |
2 Introduction |
2.1 Key Highlights of the Report |
2.2 Report Description |
2.3 Market Scope & Segmentation |
2.4 Research Methodology |
2.5 Assumptions |
3 Malta Styrene Market Overview |
3.1 Malta Country Macro Economic Indicators |
3.2 Malta Styrene Market Revenues & Volume, 2021 & 2031F |
3.3 Malta Styrene Market - Industry Life Cycle |
3.4 Malta Styrene Market - Porter's Five Forces |
3.5 Malta Styrene Market Revenues & Volume Share, By Type, 2021 & 2031F |
3.6 Malta Styrene Market Revenues & Volume Share, By Application, 2021 & 2031F |
3.7 Malta Styrene Market Revenues & Volume Share, By Distribution Channel, 2021 & 2031F |
4 Malta Styrene Market Dynamics |
4.1 Impact Analysis |
4.2 Market Drivers |
4.2.1 Growing demand for styrene-based products in various industries such as packaging, automotive, and electronics. |
4.2.2 Increasing investments in research and development for the development of innovative styrene products. |
4.2.3 Favorable government regulations supporting the use of styrene in manufacturing processes. |
4.3 Market Restraints |
4.3.1 Volatile raw material prices impacting the production cost of styrene. |
4.3.2 Environmental concerns related to the disposal and recycling of styrene-based products. |
4.3.3 Intense competition from substitute materials affecting the market growth of styrene. |
5 Malta Styrene Market Trends |
6 Malta Styrene Market Segmentations |
6.1 Malta Styrene Market, By Type |
6.1.1 Overview and Analysis |
6.1.2 Malta Styrene Market Revenues & Volume, By Acrylonitrile Butadiene Styrene (ABS), 2021-2031F |
6.1.3 Malta Styrene Market Revenues & Volume, By Expanded Polystyrene (EPS), 2021-2031F |
6.1.4 Malta Styrene Market Revenues & Volume, By Others, 2021-2031F |
6.2 Malta Styrene Market, By Application |
6.2.1 Overview and Analysis |
6.2.2 Malta Styrene Market Revenues & Volume, By Automotive, 2021-2031F |
6.2.3 Malta Styrene Market Revenues & Volume, By Construction, 2021-2031F |
6.2.4 Malta Styrene Market Revenues & Volume, By Packaging Consumer Goods, 2021-2031F |
6.2.5 Malta Styrene Market Revenues & Volume, By Others, 2021-2031F |
6.3 Malta Styrene Market, By Distribution Channel |
6.3.1 Overview and Analysis |
6.3.2 Malta Styrene Market Revenues & Volume, By Offline, 2021-2031F |
6.3.3 Malta Styrene Market Revenues & Volume, By Online, 2021-2031F |
7 Malta Styrene Market Import-Export Trade Statistics |
7.1 Malta Styrene Market Export to Major Countries |
7.2 Malta Styrene Market Imports from Major Countries |
8 Malta Styrene Market Key Performance Indicators |
8.1 Research and development expenditure on new styrene product development. |
8.2 Adoption rate of eco-friendly production processes in the styrene industry. |
8.3 Number of patents filed for new styrene-based technologies. |
8.4 Percentage of styrene products meeting quality standards set by regulatory authorities. |
9 Malta Styrene Market - Opportunity Assessment |
9.1 Malta Styrene Market Opportunity Assessment, By Type, 2021 & 2031F |
9.2 Malta Styrene Market Opportunity Assessment, By Application, 2021 & 2031F |
9.3 Malta Styrene Market Opportunity Assessment, By Distribution Channel, 2021 & 2031F |
10 Malta Styrene Market - Competitive Landscape |
10.1 Malta Styrene Market Revenue Share, By Companies, 2024 |
10.2 Malta Styrene Market Competitive Benchmarking, By Operating and Technical Parameters |
11 Company Profiles |
12 Recommendations | 13 Disclaimer |
Global Go To Market Strategy - 2030
Export potential enables firms to identify high-growth global markets with greater confidence by combining advanced trade intelligence with a structured quantitative methodology. The framework analyzes emerging demand trends and country-level import patterns while integrating macroeconomic and trade datasets such as GDP and population forecasts, bilateral import–export flows, tariff structures, elasticity differentials between developed and developing economies, geographic distance, and import demand projections. Using weighted trade values from 2020–2024 as the base period to project country-to-country export potential for 2030, these inputs are operationalized through calculated drivers such as gravity model parameters, tariff impact factors, and projected GDP per-capita growth. Through an analysis of hidden potentials, demand hotspots, and market conditions that are most favorable to success, this method enables firms to focus on target countries, maximize returns, and global expansion with data, backed by accuracy.
By factoring in the projected importer demand gap that is currently unmet and could be potential opportunity, it identifies the potential for the Exporter (Country) among 190 countries, against the general trade analysis, which identifies the biggest importer or exporter.
To discover high-growth global markets and optimize your business strategy:
Click Here
Pricing
- Single User License$ 1,995
- Department License$ 2,400
- Site License$ 3,120
- Global License$ 3,795

Leadership Perspectives from Industry Events
Search
Thought Leadership and Analyst Meet


Our Clients
6WResearch In News
- Doha a strategic location for EV manufacturing hub: IPA Qatar
- Demand for luxury TVs surging in the GCC, says Samsung
- Empowering Growth: The Thriving Journey of Bangladesh’s Cable Industry
- Demand for luxury TVs surging in the GCC, says Samsung
- Video call with a traditional healer? Once unthinkable, it’s now common in South Africa
- Intelligent Buildings To Smooth GCC’s Path To Net Zero
Latest Reports
- New Zealand Aseptic Manufacturing Market (2026-2032)
- Netherlands Aseptic Manufacturing Market (2026-2032)
- Nauru Aseptic Manufacturing Market (2026-2032)
- Namibia Aseptic Manufacturing Market (2026-2032)
- Mozambique Aseptic Manufacturing Market (2026-2032)
- Montenegro Aseptic Manufacturing Market (2026-2032)
- Mongolia Aseptic Manufacturing Market (2026-2032)
- Monaco Aseptic Manufacturing Market (2026-2032)
- Micronesia Aseptic Manufacturing Market (2026-2032)
- Mauritius Aseptic Manufacturing Market (2026-2032)
Industry Events and Analyst Meet

HIMTEX 2026

India Refining Summit 2026

India EV Show 2026

EV tech India Expo 2026

Auto Tech Asia 2026
Whitepaper
- Middle East & Africa Commercial Security Market Click here to view more.
- Middle East & Africa Fire Safety Systems & Equipment Market Click here to view more.
- GCC Drone Market Click here to view more.
- Middle East Lighting Fixture Market Click here to view more.
- GCC Physical & Perimeter Security Market Click here to view more.