Malta Utility Poles Market (2026-2032) | Value, Segmentation, Analysis, Outlook, Revenue, Industry, Companies, Share, Size, Trends, Forecast & Growth
Market Forecast By Type (Transmission Poles, Distribution Poles), By Material (Concrete, Wood, Steel, Composites), By Pole Size (Below 40ft, Between 40 & 70ft, Above 70ft), By Application (Electricity Transmission & Distribution, Telecommunication, Street Lighting, Heavy Power Lines, Subtransmission Lines, Others) And Competitive Landscape
| Product Code: ETC4754416 | Publication Date: Nov 2023 | Updated Date: Apr 2026 | Product Type: Market Research Report | |
| Publisher: 6Wresearch | Author: Shubham Padhi | No. of Pages: 60 | No. of Figures: 30 | No. of Tables: 5 |
Malta Utility Poles Market Size (2020-2030)
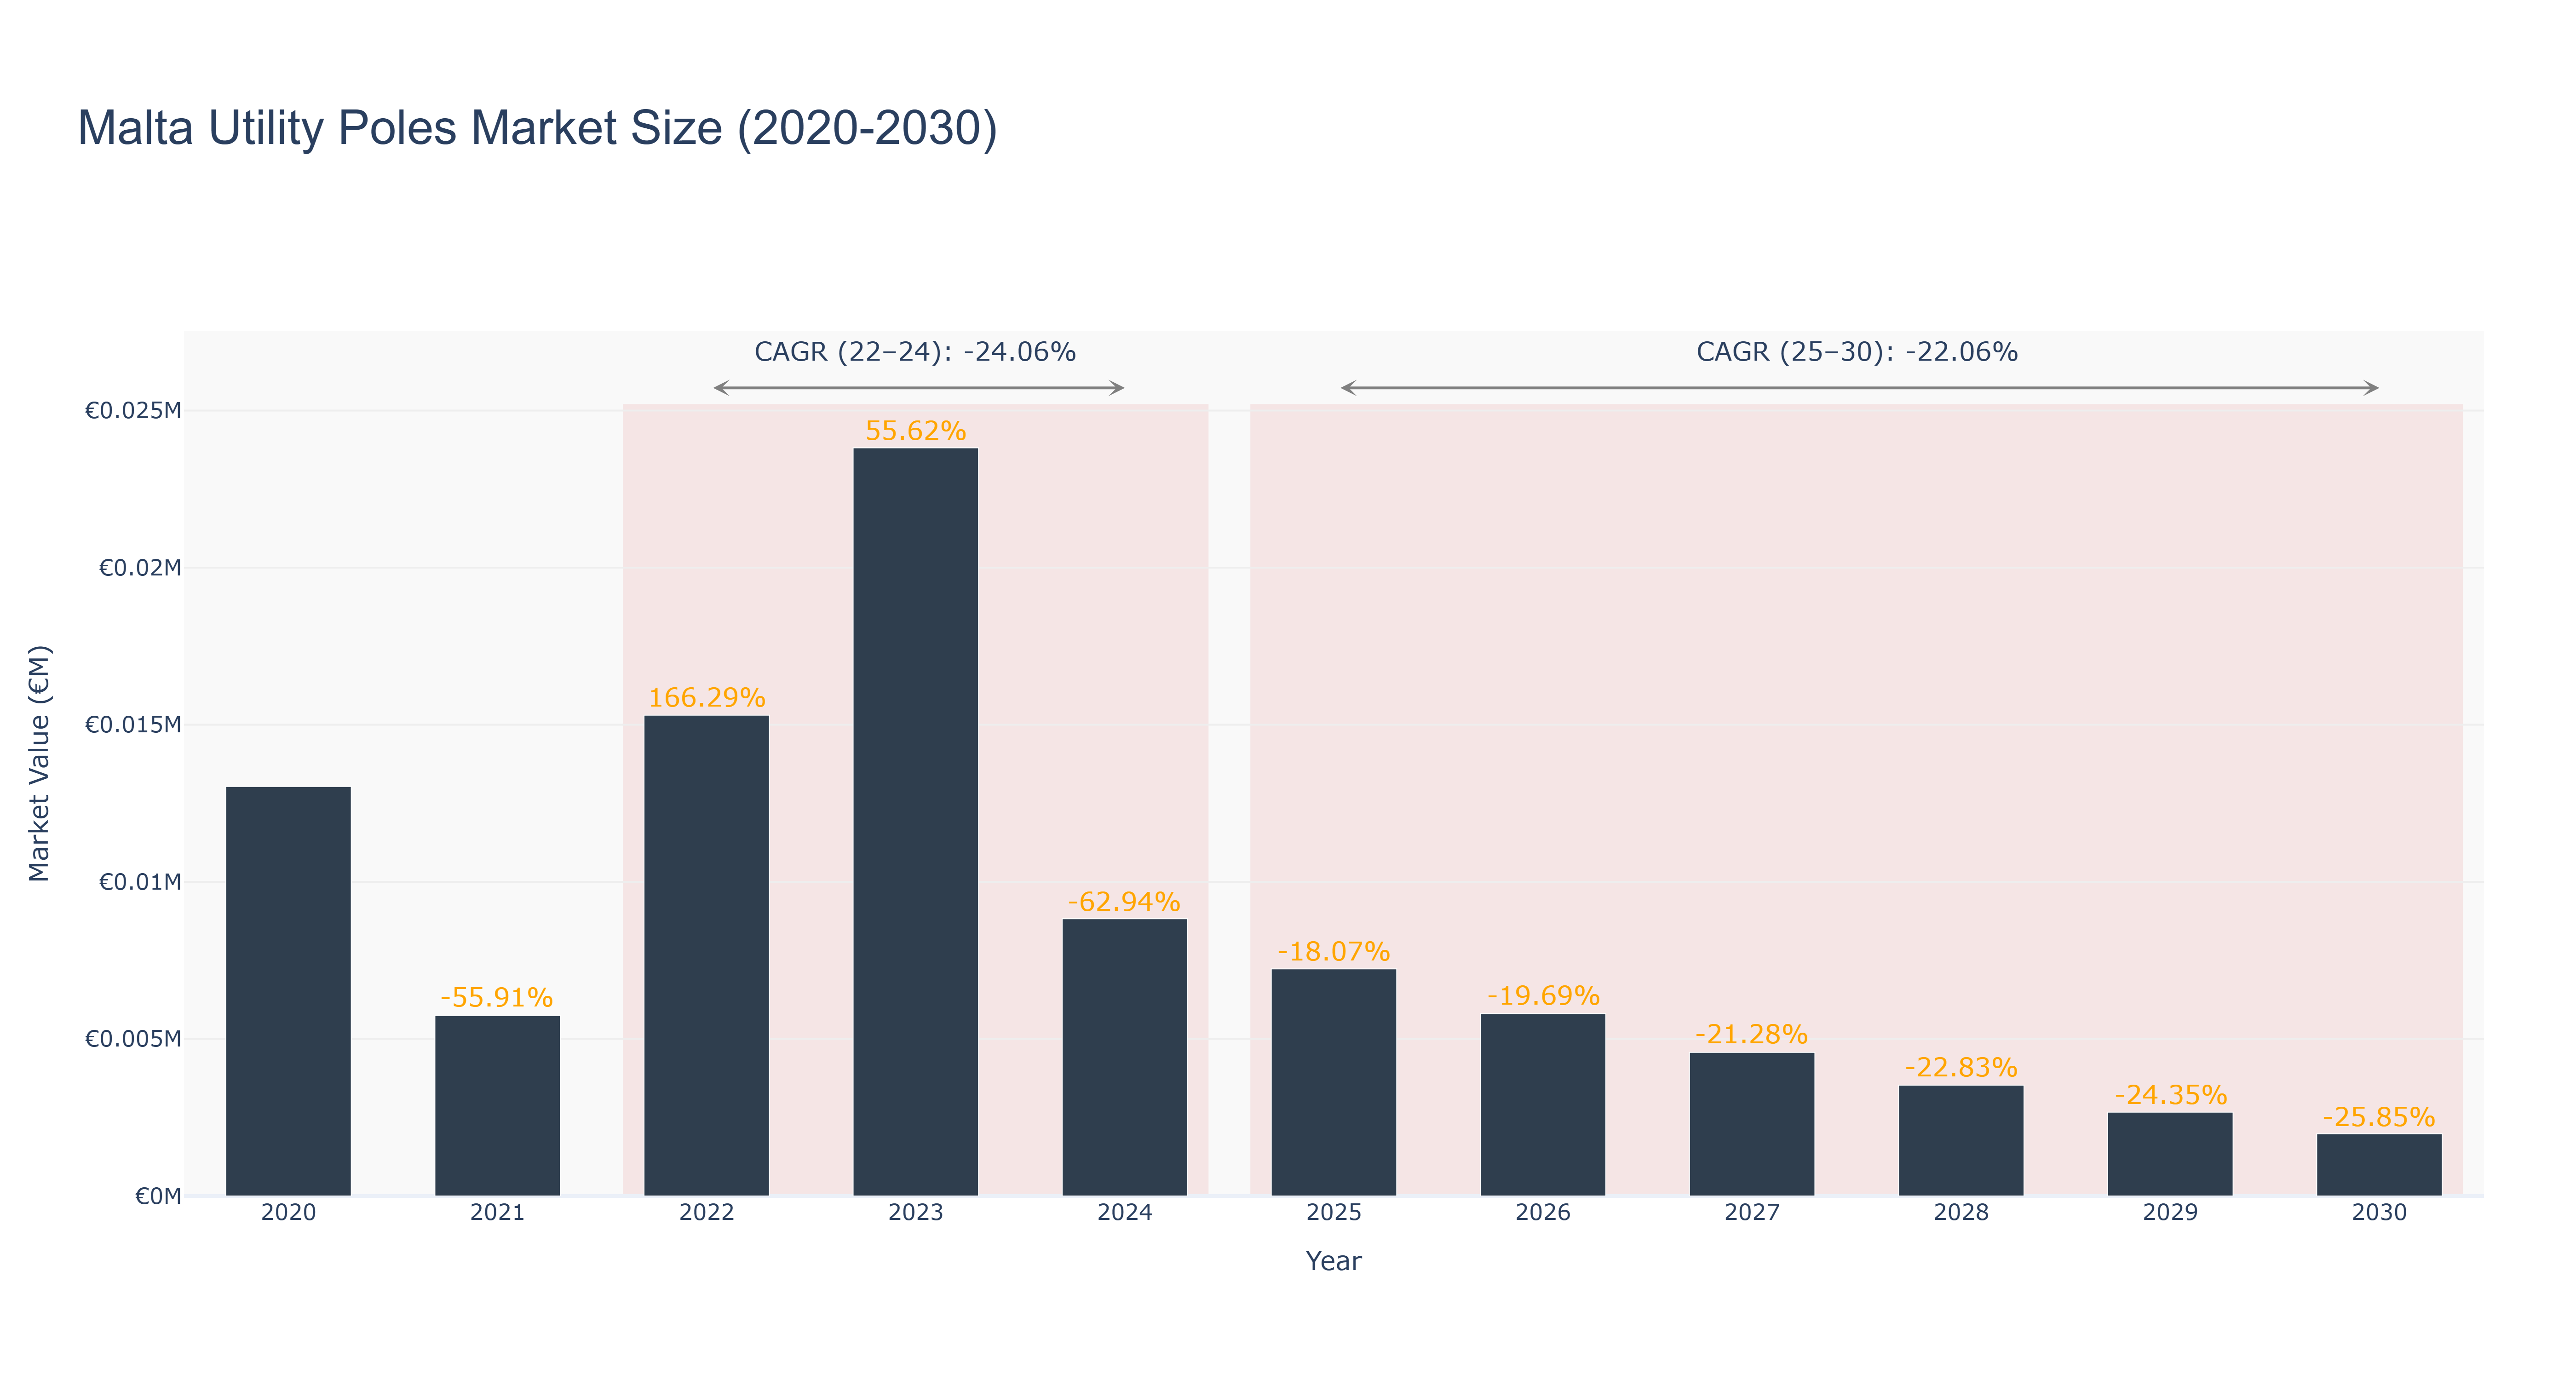
Malta Utility Poles Market has experienced fluctuating market sizes over the years. The peak market size of €0.02 million was recorded in 2022, followed by a decline to €0.01 million in 2024. The forecasted market size is expected to remain stagnant at €0.01 million from 2025 to 2030. The CAGR for 2022-24 stands at -24.06%, while for 2025-30, it is projected at -22.06%. The market saw growth in 2022 due to increased infrastructure development projects, but subsequent declines were influenced by economic downturns affecting construction activities. Moving forward, Malta plans to invest in upgrading its utility pole infrastructure to enhance energy distribution efficiency, supporting the market's stability and potential growth. Industry drivers include government initiatives towards modernizing utility infrastructure and increasing renewable energy integration.
Malta Utility Poles Market: Production & Trade Performance (2019-2025)
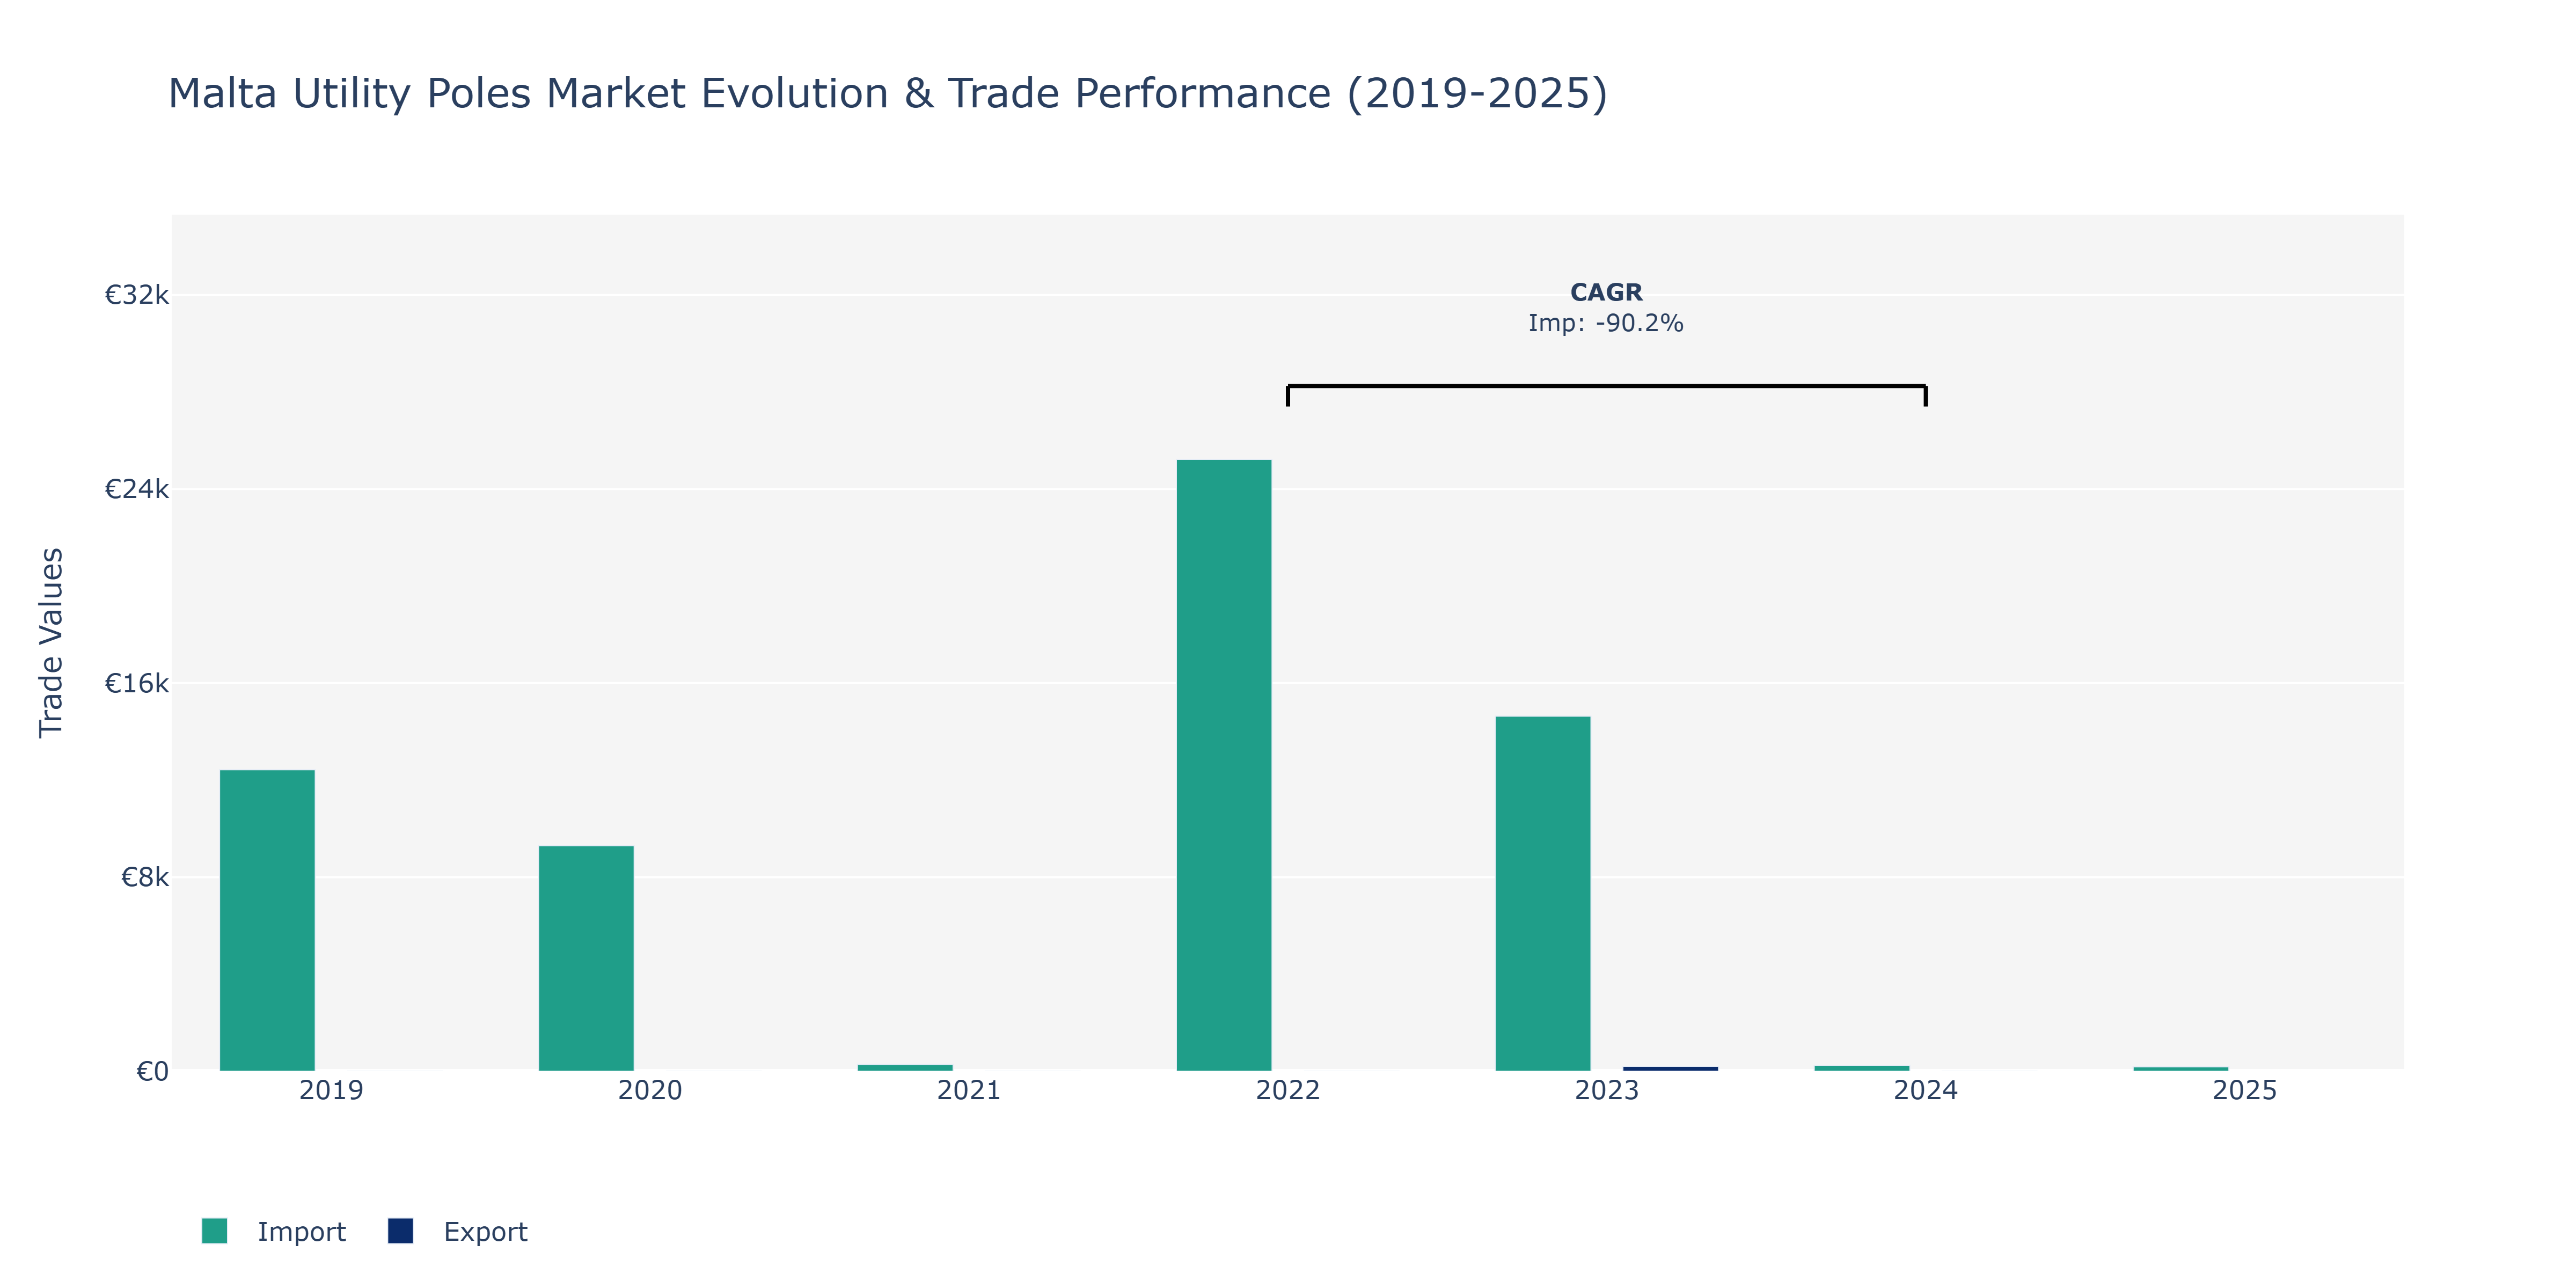
The Malta Utility Poles Market saw notable fluctuations in imports over the years. In 2019, imports stood at €12.43 thousand, declining to €9.29 thousand in 2020 before experiencing a sharp drop to €283 in 2021. The market witnessed a substantial rebound in 2022 with imports soaring to €25.22 thousand. However, this spike was short-lived as imports fell to €241 in 2024 and slightly recovered to €181 in 2025. These fluctuations can be attributed to various factors such as changes in infrastructure development projects, governmental regulations impacting demand, and global market dynamics affecting trade patterns. The abrupt decline in 2021 could be influenced by disruptions caused by the COVID-19 pandemic, while the surge in 2022 might have been driven by renewed construction activities or strategic initiatives to enhance the country's utility infrastructure. Such fluctuations underscore the market's sensitivity to economic conditions and policy changes, necessitating adaptable strategies for stakeholders to navigate uncertainties effectively.
Key Highlights of the Report:
- Malta Utility Poles Market Outlook
- Market Size of Malta Utility Poles Market, 2025
- Forecast of Malta Utility Poles Market, 2032
- Historical Data and Forecast of Malta Utility Poles Revenues & Volume for the Period 2022 - 2032F
- Malta Utility Poles Market Trend Evolution
- Malta Utility Poles Market Drivers and Challenges
- Malta Utility Poles Price Trends
- Malta Utility Poles Porter`s Five Forces
- Malta Utility Poles Industry Life Cycle
- Historical Data and Forecast of Malta Utility Poles Market Revenues & Volume By Type for the Period 2022 - 2032F
- Historical Data and Forecast of Malta Utility Poles Market Revenues & Volume By Transmission Poles for the Period 2022 - 2032F
- Historical Data and Forecast of Malta Utility Poles Market Revenues & Volume By Distribution Poles for the Period 2022 - 2032F
- Historical Data and Forecast of Malta Utility Poles Market Revenues & Volume By Material for the Period 2022 - 2032F
- Historical Data and Forecast of Malta Utility Poles Market Revenues & Volume By Concrete for the Period 2022 - 2032F
- Historical Data and Forecast of Malta Utility Poles Market Revenues & Volume By Wood for the Period 2022 - 2032F
- Historical Data and Forecast of Malta Utility Poles Market Revenues & Volume By Steel for the Period 2022 - 2032F
- Historical Data and Forecast of Malta Utility Poles Market Revenues & Volume By Composites for the Period 2022 - 2032F
- Historical Data and Forecast of Malta Utility Poles Market Revenues & Volume By Pole Size for the Period 2022 - 2032F
- Historical Data and Forecast of Malta Utility Poles Market Revenues & Volume By Below 40ft for the Period 2022 - 2032F
- Historical Data and Forecast of Malta Utility Poles Market Revenues & Volume By Between 40 & 70ft for the Period 2022 - 2032F
- Historical Data and Forecast of Malta Utility Poles Market Revenues & Volume By Above 70ft for the Period 2022 - 2032F
- Historical Data and Forecast of Malta Utility Poles Market Revenues & Volume By Application for the Period 2022 - 2032F
- Historical Data and Forecast of Malta Utility Poles Market Revenues & Volume By Electricity Transmission & Distribution for the Period 2022 - 2032F
- Historical Data and Forecast of Malta Utility Poles Market Revenues & Volume By Telecommunication for the Period 2022 - 2032F
- Historical Data and Forecast of Malta Utility Poles Market Revenues & Volume By Street Lighting for the Period 2022 - 2032F
- Historical Data and Forecast of Malta Utility Poles Market Revenues & Volume By Heavy Power Lines for the Period 2022 - 2032F
- Historical Data and Forecast of Malta Utility Poles Market Revenues & Volume By Subtransmission Lines for the Period 2022 - 2032F
- Historical Data and Forecast of Malta Utility Poles Market Revenues & Volume By Others for the Period 2022 - 2032F
- Malta Utility Poles Import Export Trade Statistics
- Market Opportunity Assessment By Type
- Market Opportunity Assessment By Material
- Market Opportunity Assessment By Pole Size
- Market Opportunity Assessment By Application
- Malta Utility Poles Top Companies Market Share
- Malta Utility Poles Competitive Benchmarking By Technical and Operational Parameters
- Malta Utility Poles Company Profiles
- Malta Utility Poles Key Strategic Recommendations
Frequently Asked Questions About the Market Study (FAQs):
6Wresearch actively monitors the Malta Utility Poles Market and publishes its comprehensive annual report, highlighting emerging trends, growth drivers, revenue analysis, and forecast outlook. Our insights help businesses to make data-backed strategic decisions with ongoing market dynamics. Our analysts track relevent industries related to the Malta Utility Poles Market, allowing our clients with actionable intelligence and reliable forecasts tailored to emerging regional needs.
Yes, we provide customisation as per your requirements. To learn more, feel free to contact us on sales@6wresearch.com
1 Executive Summary |
2 Introduction |
2.1 Key Highlights of the Report |
2.2 Report Description |
2.3 Market Scope & Segmentation |
2.4 Research Methodology |
2.5 Assumptions |
3 Malta Utility Poles Market Overview |
3.1 Malta Country Macro Economic Indicators |
3.2 Malta Utility Poles Market Revenues & Volume, 2022 & 2032F |
3.3 Malta Utility Poles Market - Industry Life Cycle |
3.4 Malta Utility Poles Market - Porter's Five Forces |
3.5 Malta Utility Poles Market Revenues & Volume Share, By Type, 2022 & 2032F |
3.6 Malta Utility Poles Market Revenues & Volume Share, By Material, 2022 & 2032F |
3.7 Malta Utility Poles Market Revenues & Volume Share, By Pole Size, 2022 & 2032F |
3.8 Malta Utility Poles Market Revenues & Volume Share, By Application, 2022 & 2032F |
4 Malta Utility Poles Market Dynamics |
4.1 Impact Analysis |
4.2 Market Drivers |
4.3 Market Restraints |
5 Malta Utility Poles Market Trends |
6 Malta Utility Poles Market Segmentations |
6.1 Malta Utility Poles Market, By Type |
6.1.1 Overview and Analysis |
6.1.2 Malta Utility Poles Market Revenues & Volume, By Transmission Poles, 2022 - 2032F |
6.1.3 Malta Utility Poles Market Revenues & Volume, By Distribution Poles, 2022 - 2032F |
6.2 Malta Utility Poles Market, By Material |
6.2.1 Overview and Analysis |
6.2.2 Malta Utility Poles Market Revenues & Volume, By Concrete, 2022 - 2032F |
6.2.3 Malta Utility Poles Market Revenues & Volume, By Wood, 2022 - 2032F |
6.2.4 Malta Utility Poles Market Revenues & Volume, By Steel, 2022 - 2032F |
6.2.5 Malta Utility Poles Market Revenues & Volume, By Composites, 2022 - 2032F |
6.3 Malta Utility Poles Market, By Pole Size |
6.3.1 Overview and Analysis |
6.3.2 Malta Utility Poles Market Revenues & Volume, By Below 40ft, 2022 - 2032F |
6.3.3 Malta Utility Poles Market Revenues & Volume, By Between 40 & 70ft, 2022 - 2032F |
6.3.4 Malta Utility Poles Market Revenues & Volume, By Above 70ft, 2022 - 2032F |
6.4 Malta Utility Poles Market, By Application |
6.4.1 Overview and Analysis |
6.4.2 Malta Utility Poles Market Revenues & Volume, By Electricity Transmission & Distribution, 2022 - 2032F |
6.4.3 Malta Utility Poles Market Revenues & Volume, By Telecommunication, 2022 - 2032F |
6.4.4 Malta Utility Poles Market Revenues & Volume, By Street Lighting, 2022 - 2032F |
6.4.5 Malta Utility Poles Market Revenues & Volume, By Heavy Power Lines, 2022 - 2032F |
6.4.6 Malta Utility Poles Market Revenues & Volume, By Subtransmission Lines, 2022 - 2032F |
6.4.7 Malta Utility Poles Market Revenues & Volume, By Others, 2022 - 2032F |
7 Malta Utility Poles Market Import-Export Trade Statistics |
7.1 Malta Utility Poles Market Export to Major Countries |
7.2 Malta Utility Poles Market Imports from Major Countries |
8 Malta Utility Poles Market Key Performance Indicators |
9 Malta Utility Poles Market - Opportunity Assessment |
9.1 Malta Utility Poles Market Opportunity Assessment, By Type, 2022 & 2032F |
9.2 Malta Utility Poles Market Opportunity Assessment, By Material, 2022 & 2032F |
9.3 Malta Utility Poles Market Opportunity Assessment, By Pole Size, 2022 & 2032F |
9.4 Malta Utility Poles Market Opportunity Assessment, By Application, 2022 & 2032F |
10 Malta Utility Poles Market - Competitive Landscape |
10.1 Malta Utility Poles Market Revenue Share, By Companies, 2025 |
10.2 Malta Utility Poles Market Competitive Benchmarking, By Operating and Technical Parameters |
11 Company Profiles |
12 Recommendations | 13 Disclaimer |
Export potential assessment - trade Analytics for 2030
Export potential enables firms to identify high-growth global markets with greater confidence by combining advanced trade intelligence with a structured quantitative methodology. The framework analyzes emerging demand trends and country-level import patterns while integrating macroeconomic and trade datasets such as GDP and population forecasts, bilateral import–export flows, tariff structures, elasticity differentials between developed and developing economies, geographic distance, and import demand projections. Using weighted trade values from 2020–2024 as the base period to project country-to-country export potential for 2030, these inputs are operationalized through calculated drivers such as gravity model parameters, tariff impact factors, and projected GDP per-capita growth. Through an analysis of hidden potentials, demand hotspots, and market conditions that are most favorable to success, this method enables firms to focus on target countries, maximize returns, and global expansion with data, backed by accuracy.
By factoring in the projected importer demand gap that is currently unmet and could be potential opportunity, it identifies the potential for the Exporter (Country) among 190 countries, against the general trade analysis, which identifies the biggest importer or exporter.
To discover high-growth global markets and optimize your business strategy:
Click Here
Pricing
- Single User License$ 1,995
- Department License$ 2,400
- Site License$ 3,120
- Global License$ 3,795

Search
Thought Leadership and Analyst Meet


Our Clients
Latest Reports
- India Ultrasonic Smart Water Meter Market (2026-2032) | Outlook, Competition, Drivers, Trends, Demand, Competitive, Strategic Insights, Companies, Challenges, Strategy, Consumer Insights, Analysis, Opportunities, Growth, Size, Share, Industry, Revenue, Segments, Value, Segmentation, Supply, Forecast, Restraints,
- India Electromagnetic Bulk Flow Meter Market (2026-2032) | Analysis, Challenges, Strategic Insights, Supply, Forecast, Growth, Share, Consumer Insights, Competitive, Value, Outlook, Size & Demand,
- India Battery Powered Bulk Flow Meter Market (2026-2032) | Outlook, Analysis, Competitive Landscape, Growth, Size, Trends, Value, Revenue, Companies, Segmentation, Share & Forecast
- Bosnia and Herzegovina Fuel-Efficient Winglets Market (2026-2032) | Growth, Competition, Strategy, Restraints, Trends, Challenges, segmentation, Value, Outlook, Investment Opportunities, Analysis, Revenue, Companies, Insights, Pricing, Size, Drivers, Demand, Share, Forecast
- Canada Cloud CFD Market (2026-2032) | Size & Revenue, Industry, Growth, Competitive Landscape, Forecast, Segmentation, Value, Outlook, Trends, Share, Analysis, Companies
- Taiwan Food Delivery Platform Market (2026-2032) | Companies, Outlook, Analysis, Trends, Value, Revenue, Segmentation, Share, Forecast, Competitive Landscape, Growth, Size & Forecast
- United Kingdom (UK) Long-term Care Insurance Market (2026-2032) | Growth, Share, Consumer Insights, Drivers, Opportunities, Competition, Pricing Analysis, Segments, Restraints, Companies, Competitive, Value, Outlook, Size, Demand, Analysis, Challenges, Strategic Insights, Investment Trends, Revenue, Trends, Supply, Forecast
- United Kingdom (UK) Long Term Care Market (2026-2032) | Companies, Outlook, Analysis, Trends, Value, Revenue, Segmentation, Share, Forecast, Competitive Landscape, Growth, Size & Forecast
- Iraq Insulation and Waterproofing Market (2026-2032) | Outlook, Drivers, Growth, Size, Share, Industry, Revenue, Trends, Demand, Competitive, Strategic Insights, Opportunities, Segments, Companies, Challenges, Strategy, Consumer Insights, Analysis, Investment Trends, Value, Segmentation, Forecast, Restraints
- India Switchgear Market Outlook (2026-2032) | Size, Share, Trends, Growth, Revenue, Forecast, Analysis, Value, Outlook
Industry Events and Analyst Meet

India EV Show 2026

EV tech India Expo 2026

Auto Tech Asia 2026

Battery Tech India 2026

Smart Production Solutions Guangzhou 2026
Whitepaper
- Middle East & Africa Commercial Security Market Click here to view more.
- Middle East & Africa Fire Safety Systems & Equipment Market Click here to view more.
- GCC Drone Market Click here to view more.
- Middle East Lighting Fixture Market Click here to view more.
- GCC Physical & Perimeter Security Market Click here to view more.
6WResearch In News
- Doha a strategic location for EV manufacturing hub: IPA Qatar
- Demand for luxury TVs surging in the GCC, says Samsung
- Empowering Growth: The Thriving Journey of Bangladesh’s Cable Industry
- Demand for luxury TVs surging in the GCC, says Samsung
- Video call with a traditional healer? Once unthinkable, it’s now common in South Africa
- Intelligent Buildings To Smooth GCC’s Path To Net Zero