Malta UV Curable Inks Market (2025-2031) | Analysis, Size & Revenue, Trends, Segmentation, Industry, Share, Forecast, Competitive Landscape, Companies, Growth, Value, Outlook
Market Forecast By Type (Offset Printing UV Curable Inks, Silkscreen Printing UV Curable Inks, Flexo Printing UV Curable Inks, Gravure UV Curable Inks, Digital Printing UV Curable Inks), By Application (Automobile, Consumer goods, Medical, Publications and printing, Others) And Competitive Landscape
| Product Code: ETC8204833 | Publication Date: Sep 2024 | Updated Date: Apr 2026 | Product Type: Market Research Report | |
| Publisher: 6Wresearch | Author: Sumit Sagar | No. of Pages: 75 | No. of Figures: 35 | No. of Tables: 20 |
Malta Uv Curable Inks Market Size (2020-2030)
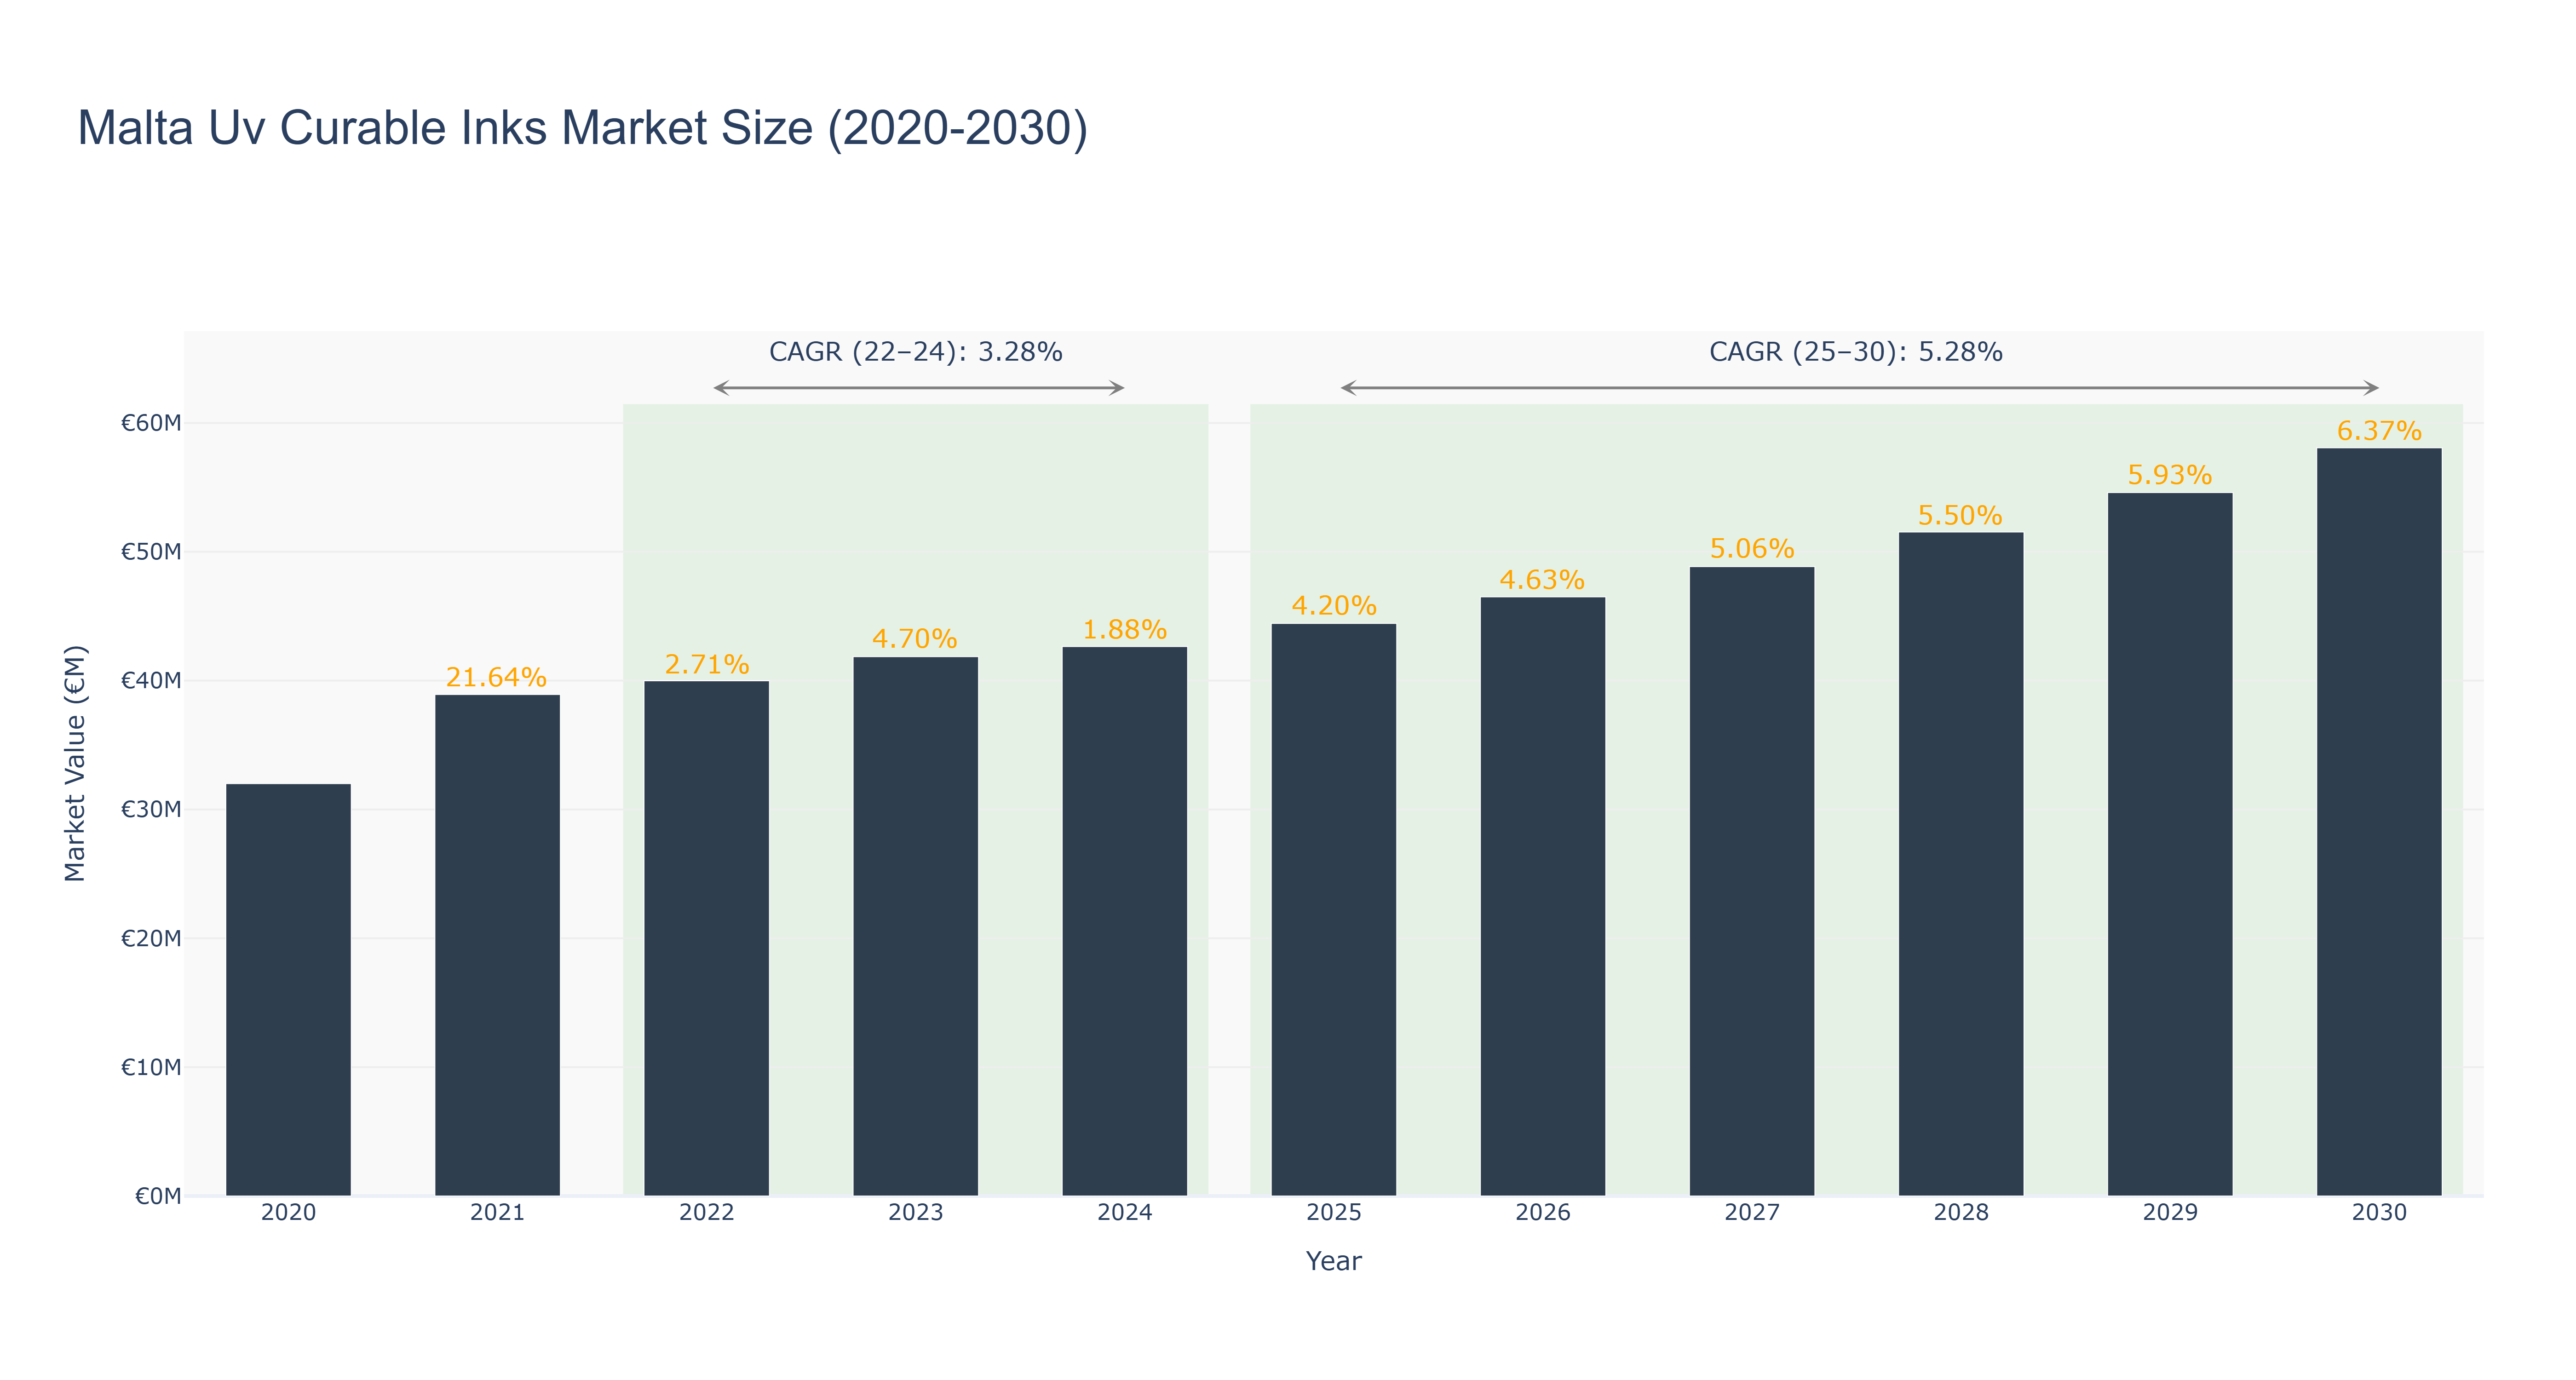
The Malta UV Curable Inks Market demonstrated notable growth in the actual period from 2020 to 2024, reaching a peak market size of €41.86 million in 2023, before stabilizing at €42.65 million in 2024, reflecting a modest CAGR of 3.28%. Initially, the market experienced a robust growth rate of 21.64% in 2021, driven by increasing demand for eco-friendly inks and advancements in printing technologies. However, growth rates have since moderated, indicating a maturing market. Looking ahead, the forecasted years from 2025 to 2030 suggest a more optimistic trajectory, with a projected CAGR of 5.28% and an anticipated market size of €58.07 million by 2030. This growth will likely be fueled by rising environmental awareness, technological innovations, and expanding applications across various sectors. As Malta continues to invest in sustainable practices, the UV curable inks market is poised for further development and expansion.
Malta Uv Curable Inks Market: Production & Trade Performance (2019-2025)
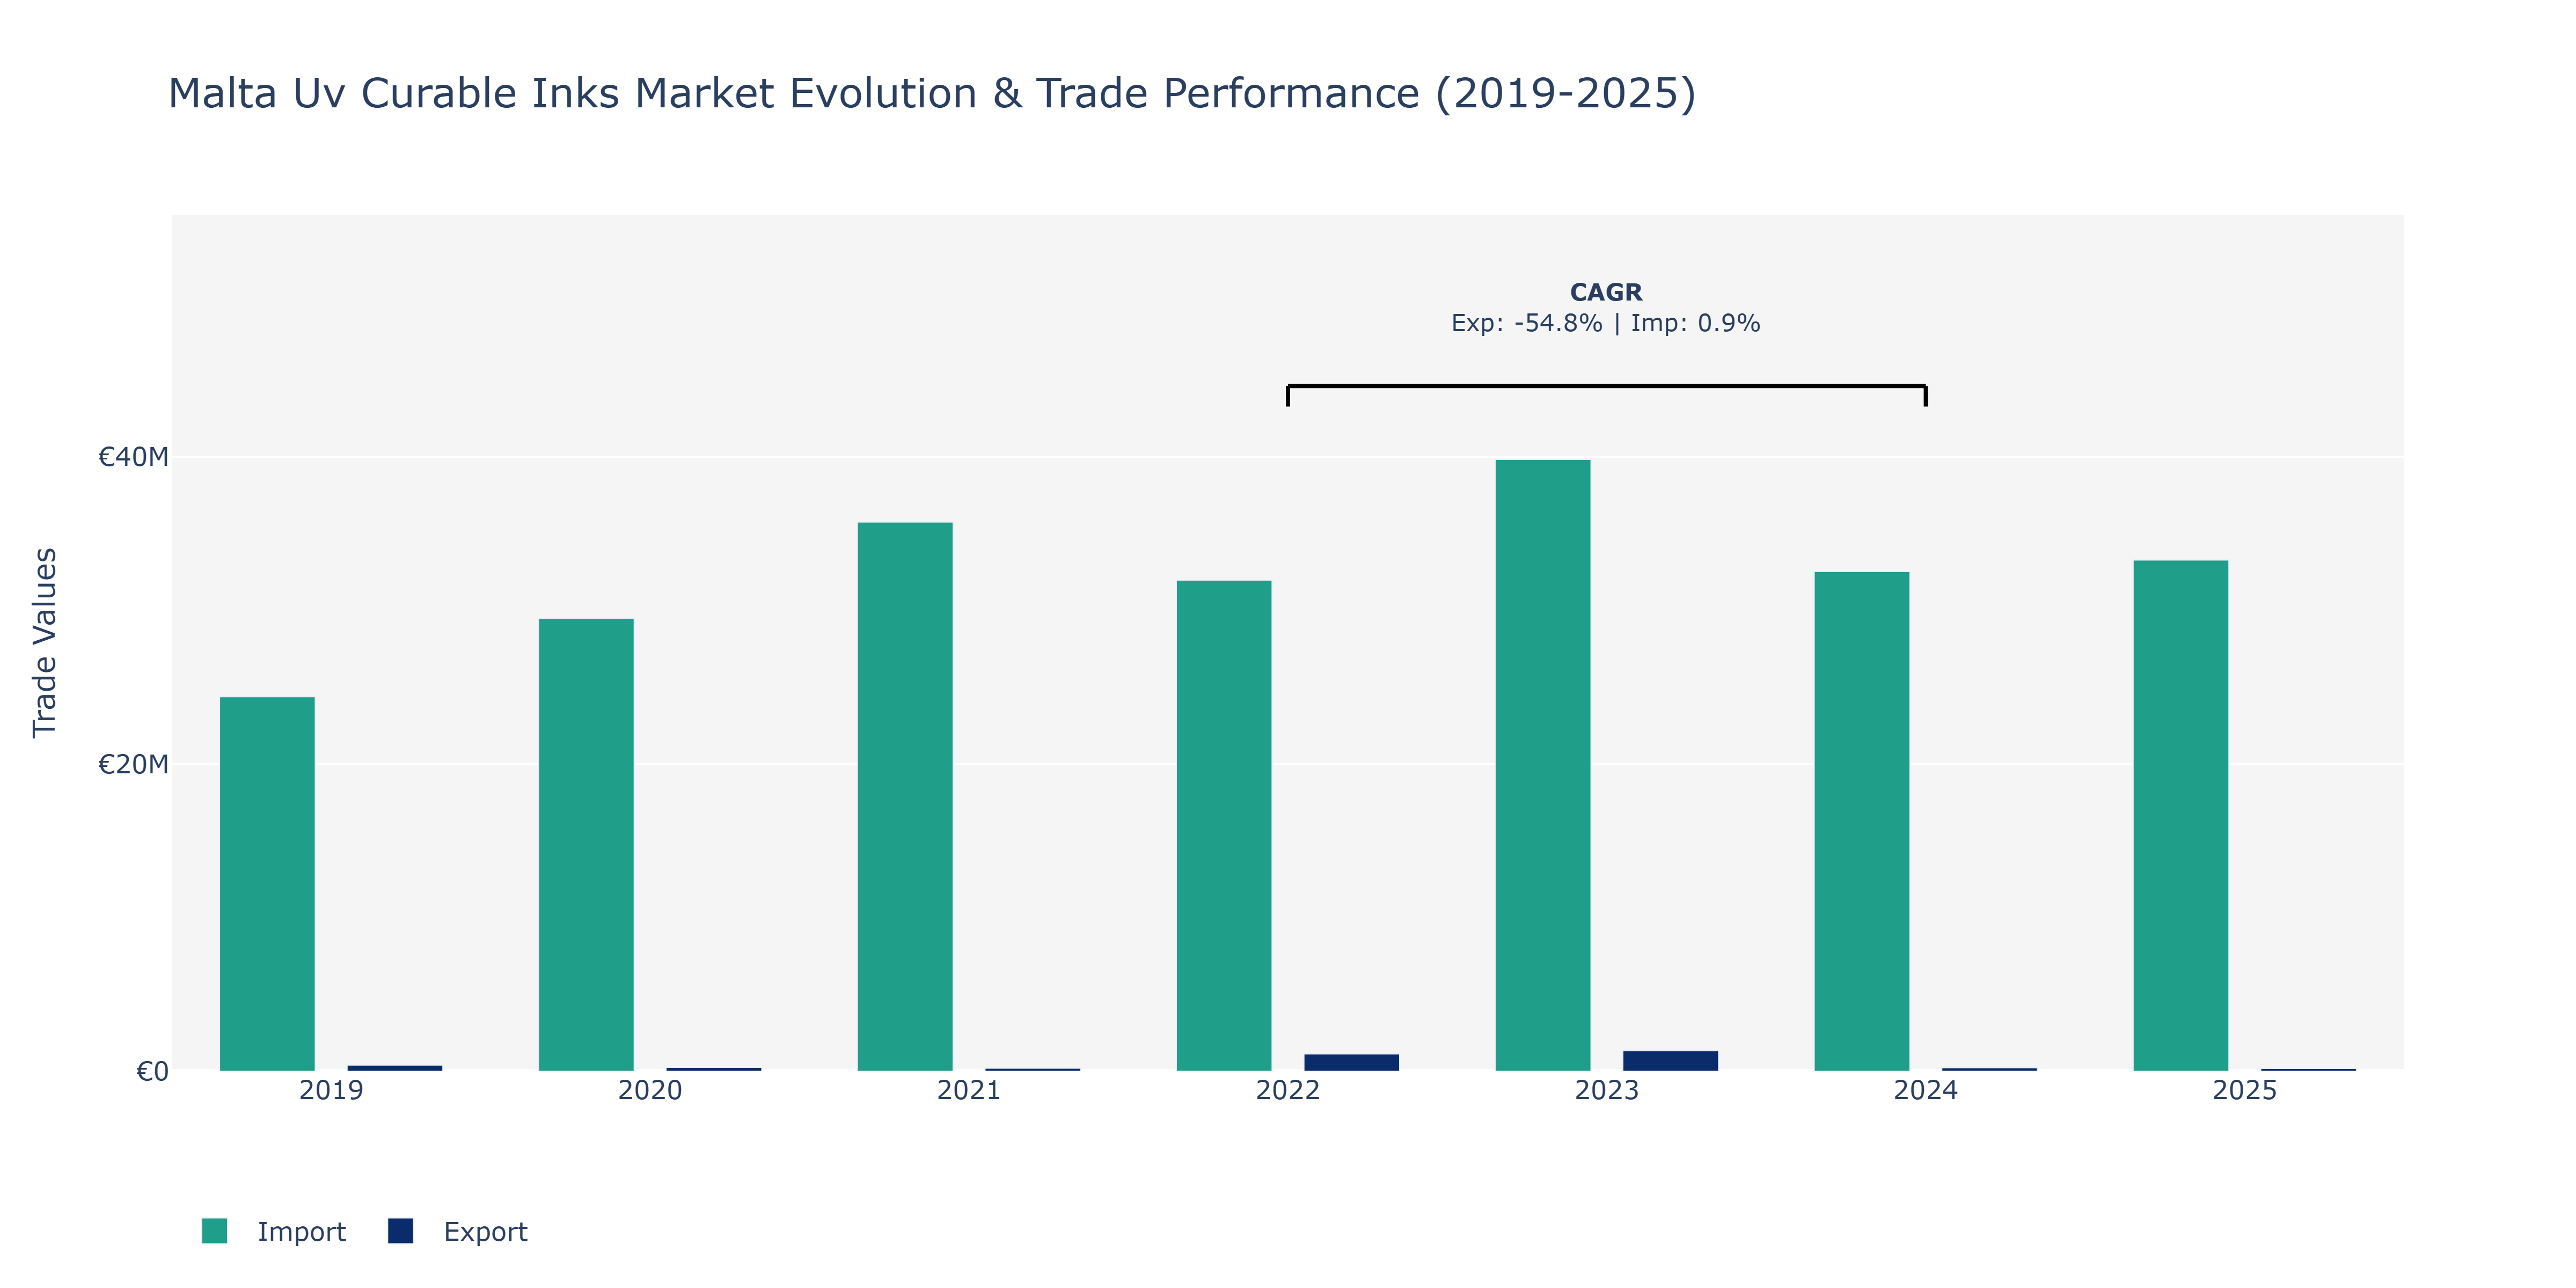
Between 2019 and 2025, Malta's Uv Curable Inks Market witnessed notable fluctuations in both exports and imports. Exports started at €395.1 thousand in 2019, experienced a sharp decline to €1.12 million in 2022, before gradually recovering to €172.56 thousand in 2025. Contrarily, imports began at €24.39 million in 2019, showed varied movements over the years, reaching €39.84 million in 2023 before dropping to €32.54 million in 2024. This rollercoaster trajectory in exports could be attributed to fluctuations in global demand and competitive pricing strategies. On the other hand, the fluctuating Import value might reflect changes in domestic consumption patterns and regulatory influences impacting raw material availability. The modest growth in imports CAGR may indicate a stabilization in demand or evolving supplier relationships, suggesting a maturing market with more balanced trade dynamics in the Malta Uv Curable Inks Market.
Key Highlights of the Report:
- Malta UV Curable Inks Market Outlook
- Market Size of Malta UV Curable Inks Market, 2024
- Forecast of Malta UV Curable Inks Market, 2031
- Historical Data and Forecast of Malta UV Curable Inks Revenues & Volume for the Period 2021- 2031
- Malta UV Curable Inks Market Trend Evolution
- Malta UV Curable Inks Market Drivers and Challenges
- Malta UV Curable Inks Price Trends
- Malta UV Curable Inks Porter's Five Forces
- Malta UV Curable Inks Industry Life Cycle
- Historical Data and Forecast of Malta UV Curable Inks Market Revenues & Volume By Type for the Period 2021- 2031
- Historical Data and Forecast of Malta UV Curable Inks Market Revenues & Volume By Offset Printing UV Curable Inks for the Period 2021- 2031
- Historical Data and Forecast of Malta UV Curable Inks Market Revenues & Volume By Silkscreen Printing UV Curable Inks for the Period 2021- 2031
- Historical Data and Forecast of Malta UV Curable Inks Market Revenues & Volume By Flexo Printing UV Curable Inks for the Period 2021- 2031
- Historical Data and Forecast of Malta UV Curable Inks Market Revenues & Volume By Gravure UV Curable Inks for the Period 2021- 2031
- Historical Data and Forecast of Malta UV Curable Inks Market Revenues & Volume By Digital Printing UV Curable Inks for the Period 2021- 2031
- Historical Data and Forecast of Malta UV Curable Inks Market Revenues & Volume By Application for the Period 2021- 2031
- Historical Data and Forecast of Malta UV Curable Inks Market Revenues & Volume By Automobile for the Period 2021- 2031
- Historical Data and Forecast of Malta UV Curable Inks Market Revenues & Volume By Consumer goods for the Period 2021- 2031
- Historical Data and Forecast of Malta UV Curable Inks Market Revenues & Volume By Medical for the Period 2021- 2031
- Historical Data and Forecast of Malta UV Curable Inks Market Revenues & Volume By Publications and printing for the Period 2021- 2031
- Historical Data and Forecast of Malta UV Curable Inks Market Revenues & Volume By Others for the Period 2021- 2031
- Malta UV Curable Inks Import Export Trade Statistics
- Market Opportunity Assessment By Type
- Market Opportunity Assessment By Application
- Malta UV Curable Inks Top Companies Market Share
- Malta UV Curable Inks Competitive Benchmarking By Technical and Operational Parameters
- Malta UV Curable Inks Company Profiles
- Malta UV Curable Inks Key Strategic Recommendations
Frequently Asked Questions About the Market Study (FAQs):
6Wresearch actively monitors the Malta UV Curable Inks Market and publishes its comprehensive annual report, highlighting emerging trends, growth drivers, revenue analysis, and forecast outlook. Our insights help businesses to make data-backed strategic decisions with ongoing market dynamics. Our analysts track relevent industries related to the Malta UV Curable Inks Market, allowing our clients with actionable intelligence and reliable forecasts tailored to emerging regional needs.
Yes, we provide customisation as per your requirements. To learn more, feel free to contact us on sales@6wresearch.com
1 Executive Summary |
2 Introduction |
2.1 Key Highlights of the Report |
2.2 Report Description |
2.3 Market Scope & Segmentation |
2.4 Research Methodology |
2.5 Assumptions |
3 Malta UV Curable Inks Market Overview |
3.1 Malta Country Macro Economic Indicators |
3.2 Malta UV Curable Inks Market Revenues & Volume, 2021 & 2031F |
3.3 Malta UV Curable Inks Market - Industry Life Cycle |
3.4 Malta UV Curable Inks Market - Porter's Five Forces |
3.5 Malta UV Curable Inks Market Revenues & Volume Share, By Type, 2021 & 2031F |
3.6 Malta UV Curable Inks Market Revenues & Volume Share, By Application, 2021 & 2031F |
4 Malta UV Curable Inks Market Dynamics |
4.1 Impact Analysis |
4.2 Market Drivers |
4.2.1 Growing demand for environmentally friendly and sustainable printing solutions |
4.2.2 Increasing adoption of UV curable inks in various industries such as packaging, automotive, and electronics |
4.2.3 Technological advancements leading to improved performance and versatility of Malta UV curable inks |
4.3 Market Restraints |
4.3.1 High initial investment costs associated with UV curing equipment and inks |
4.3.2 Limited availability of raw materials for UV curable inks production |
4.3.3 Stringent regulations regarding the use of chemicals in printing inks |
5 Malta UV Curable Inks Market Trends |
6 Malta UV Curable Inks Market, By Types |
6.1 Malta UV Curable Inks Market, By Type |
6.1.1 Overview and Analysis |
6.1.2 Malta UV Curable Inks Market Revenues & Volume, By Type, 2021- 2031F |
6.1.3 Malta UV Curable Inks Market Revenues & Volume, By Offset Printing UV Curable Inks, 2021- 2031F |
6.1.4 Malta UV Curable Inks Market Revenues & Volume, By Silkscreen Printing UV Curable Inks, 2021- 2031F |
6.1.5 Malta UV Curable Inks Market Revenues & Volume, By Flexo Printing UV Curable Inks, 2021- 2031F |
6.1.6 Malta UV Curable Inks Market Revenues & Volume, By Gravure UV Curable Inks, 2021- 2031F |
6.1.7 Malta UV Curable Inks Market Revenues & Volume, By Digital Printing UV Curable Inks, 2021- 2031F |
6.2 Malta UV Curable Inks Market, By Application |
6.2.1 Overview and Analysis |
6.2.2 Malta UV Curable Inks Market Revenues & Volume, By Automobile, 2021- 2031F |
6.2.3 Malta UV Curable Inks Market Revenues & Volume, By Consumer goods, 2021- 2031F |
6.2.4 Malta UV Curable Inks Market Revenues & Volume, By Medical, 2021- 2031F |
6.2.5 Malta UV Curable Inks Market Revenues & Volume, By Publications and printing, 2021- 2031F |
6.2.6 Malta UV Curable Inks Market Revenues & Volume, By Others, 2021- 2031F |
7 Malta UV Curable Inks Market Import-Export Trade Statistics |
7.1 Malta UV Curable Inks Market Export to Major Countries |
7.2 Malta UV Curable Inks Market Imports from Major Countries |
8 Malta UV Curable Inks Market Key Performance Indicators |
8.1 Research and development investment in new UV curable ink formulations |
8.2 Number of patents filed for UV curable ink technologies |
8.3 Adoption rate of UV curable inks in key end-user industries |
8.4 Market penetration in emerging markets for Malta UV curable inks |
8.5 Environmental certifications obtained for sustainable UV curable ink production |
9 Malta UV Curable Inks Market - Opportunity Assessment |
9.1 Malta UV Curable Inks Market Opportunity Assessment, By Type, 2021 & 2031F |
9.2 Malta UV Curable Inks Market Opportunity Assessment, By Application, 2021 & 2031F |
10 Malta UV Curable Inks Market - Competitive Landscape |
10.1 Malta UV Curable Inks Market Revenue Share, By Companies, 2024 |
10.2 Malta UV Curable Inks Market Competitive Benchmarking, By Operating and Technical Parameters |
11 Company Profiles |
12 Recommendations |
13 Disclaimer |
Export potential assessment - trade Analytics for 2030
Export potential enables firms to identify high-growth global markets with greater confidence by combining advanced trade intelligence with a structured quantitative methodology. The framework analyzes emerging demand trends and country-level import patterns while integrating macroeconomic and trade datasets such as GDP and population forecasts, bilateral import–export flows, tariff structures, elasticity differentials between developed and developing economies, geographic distance, and import demand projections. Using weighted trade values from 2020–2024 as the base period to project country-to-country export potential for 2030, these inputs are operationalized through calculated drivers such as gravity model parameters, tariff impact factors, and projected GDP per-capita growth. Through an analysis of hidden potentials, demand hotspots, and market conditions that are most favorable to success, this method enables firms to focus on target countries, maximize returns, and global expansion with data, backed by accuracy.
By factoring in the projected importer demand gap that is currently unmet and could be potential opportunity, it identifies the potential for the Exporter (Country) among 190 countries, against the general trade analysis, which identifies the biggest importer or exporter.
To discover high-growth global markets and optimize your business strategy:
Click Here
Pricing
- Single User License$ 1,995
- Department License$ 2,400
- Site License$ 3,120
- Global License$ 3,795

Thought Leadership
Search
Thought Leadership and Analyst Meet


Our Clients
Latest Reports
- New Zealand Aseptic Manufacturing Market (2026-2032)
- Netherlands Aseptic Manufacturing Market (2026-2032)
- Nauru Aseptic Manufacturing Market (2026-2032)
- Namibia Aseptic Manufacturing Market (2026-2032)
- Mozambique Aseptic Manufacturing Market (2026-2032)
- Montenegro Aseptic Manufacturing Market (2026-2032)
- Mongolia Aseptic Manufacturing Market (2026-2032)
- Monaco Aseptic Manufacturing Market (2026-2032)
- Micronesia Aseptic Manufacturing Market (2026-2032)
- Mauritius Aseptic Manufacturing Market (2026-2032)
Industry Events and Analyst Meet

HIMTEX 2026

India Refining Summit 2026

India EV Show 2026

EV tech India Expo 2026

Auto Tech Asia 2026
Whitepaper
- Middle East & Africa Commercial Security Market Click here to view more.
- Middle East & Africa Fire Safety Systems & Equipment Market Click here to view more.
- GCC Drone Market Click here to view more.
- Middle East Lighting Fixture Market Click here to view more.
- GCC Physical & Perimeter Security Market Click here to view more.
6WResearch In News
- Doha a strategic location for EV manufacturing hub: IPA Qatar
- Demand for luxury TVs surging in the GCC, says Samsung
- Empowering Growth: The Thriving Journey of Bangladesh’s Cable Industry
- Demand for luxury TVs surging in the GCC, says Samsung
- Video call with a traditional healer? Once unthinkable, it’s now common in South Africa
- Intelligent Buildings To Smooth GCC’s Path To Net Zero