Malta Water Repellant Agent Market (2026-2032) | Revenue, Trends, Industry, Segmentation, Value, Forecast, Analysis, Companies, Outlook, Size, Growth & Share
Market Forecast By Product Type (Polyurethane, Teflon, Silicones), By Technology (Water-Based, Solvent-Based, Others), By End Use (Textiles, Construction, Automotive, Medical, Others) And Competitive Landscape
| Product Code: ETC5332035 | Publication Date: Nov 2023 | Updated Date: Apr 2026 | Product Type: Market Research Report | |
| Publisher: 6Wresearch | Author: Ravi Bhandari | No. of Pages: 60 | No. of Figures: 30 | No. of Tables: 5 |
Malta Water Repellant Agent Market Size (2020-2030)
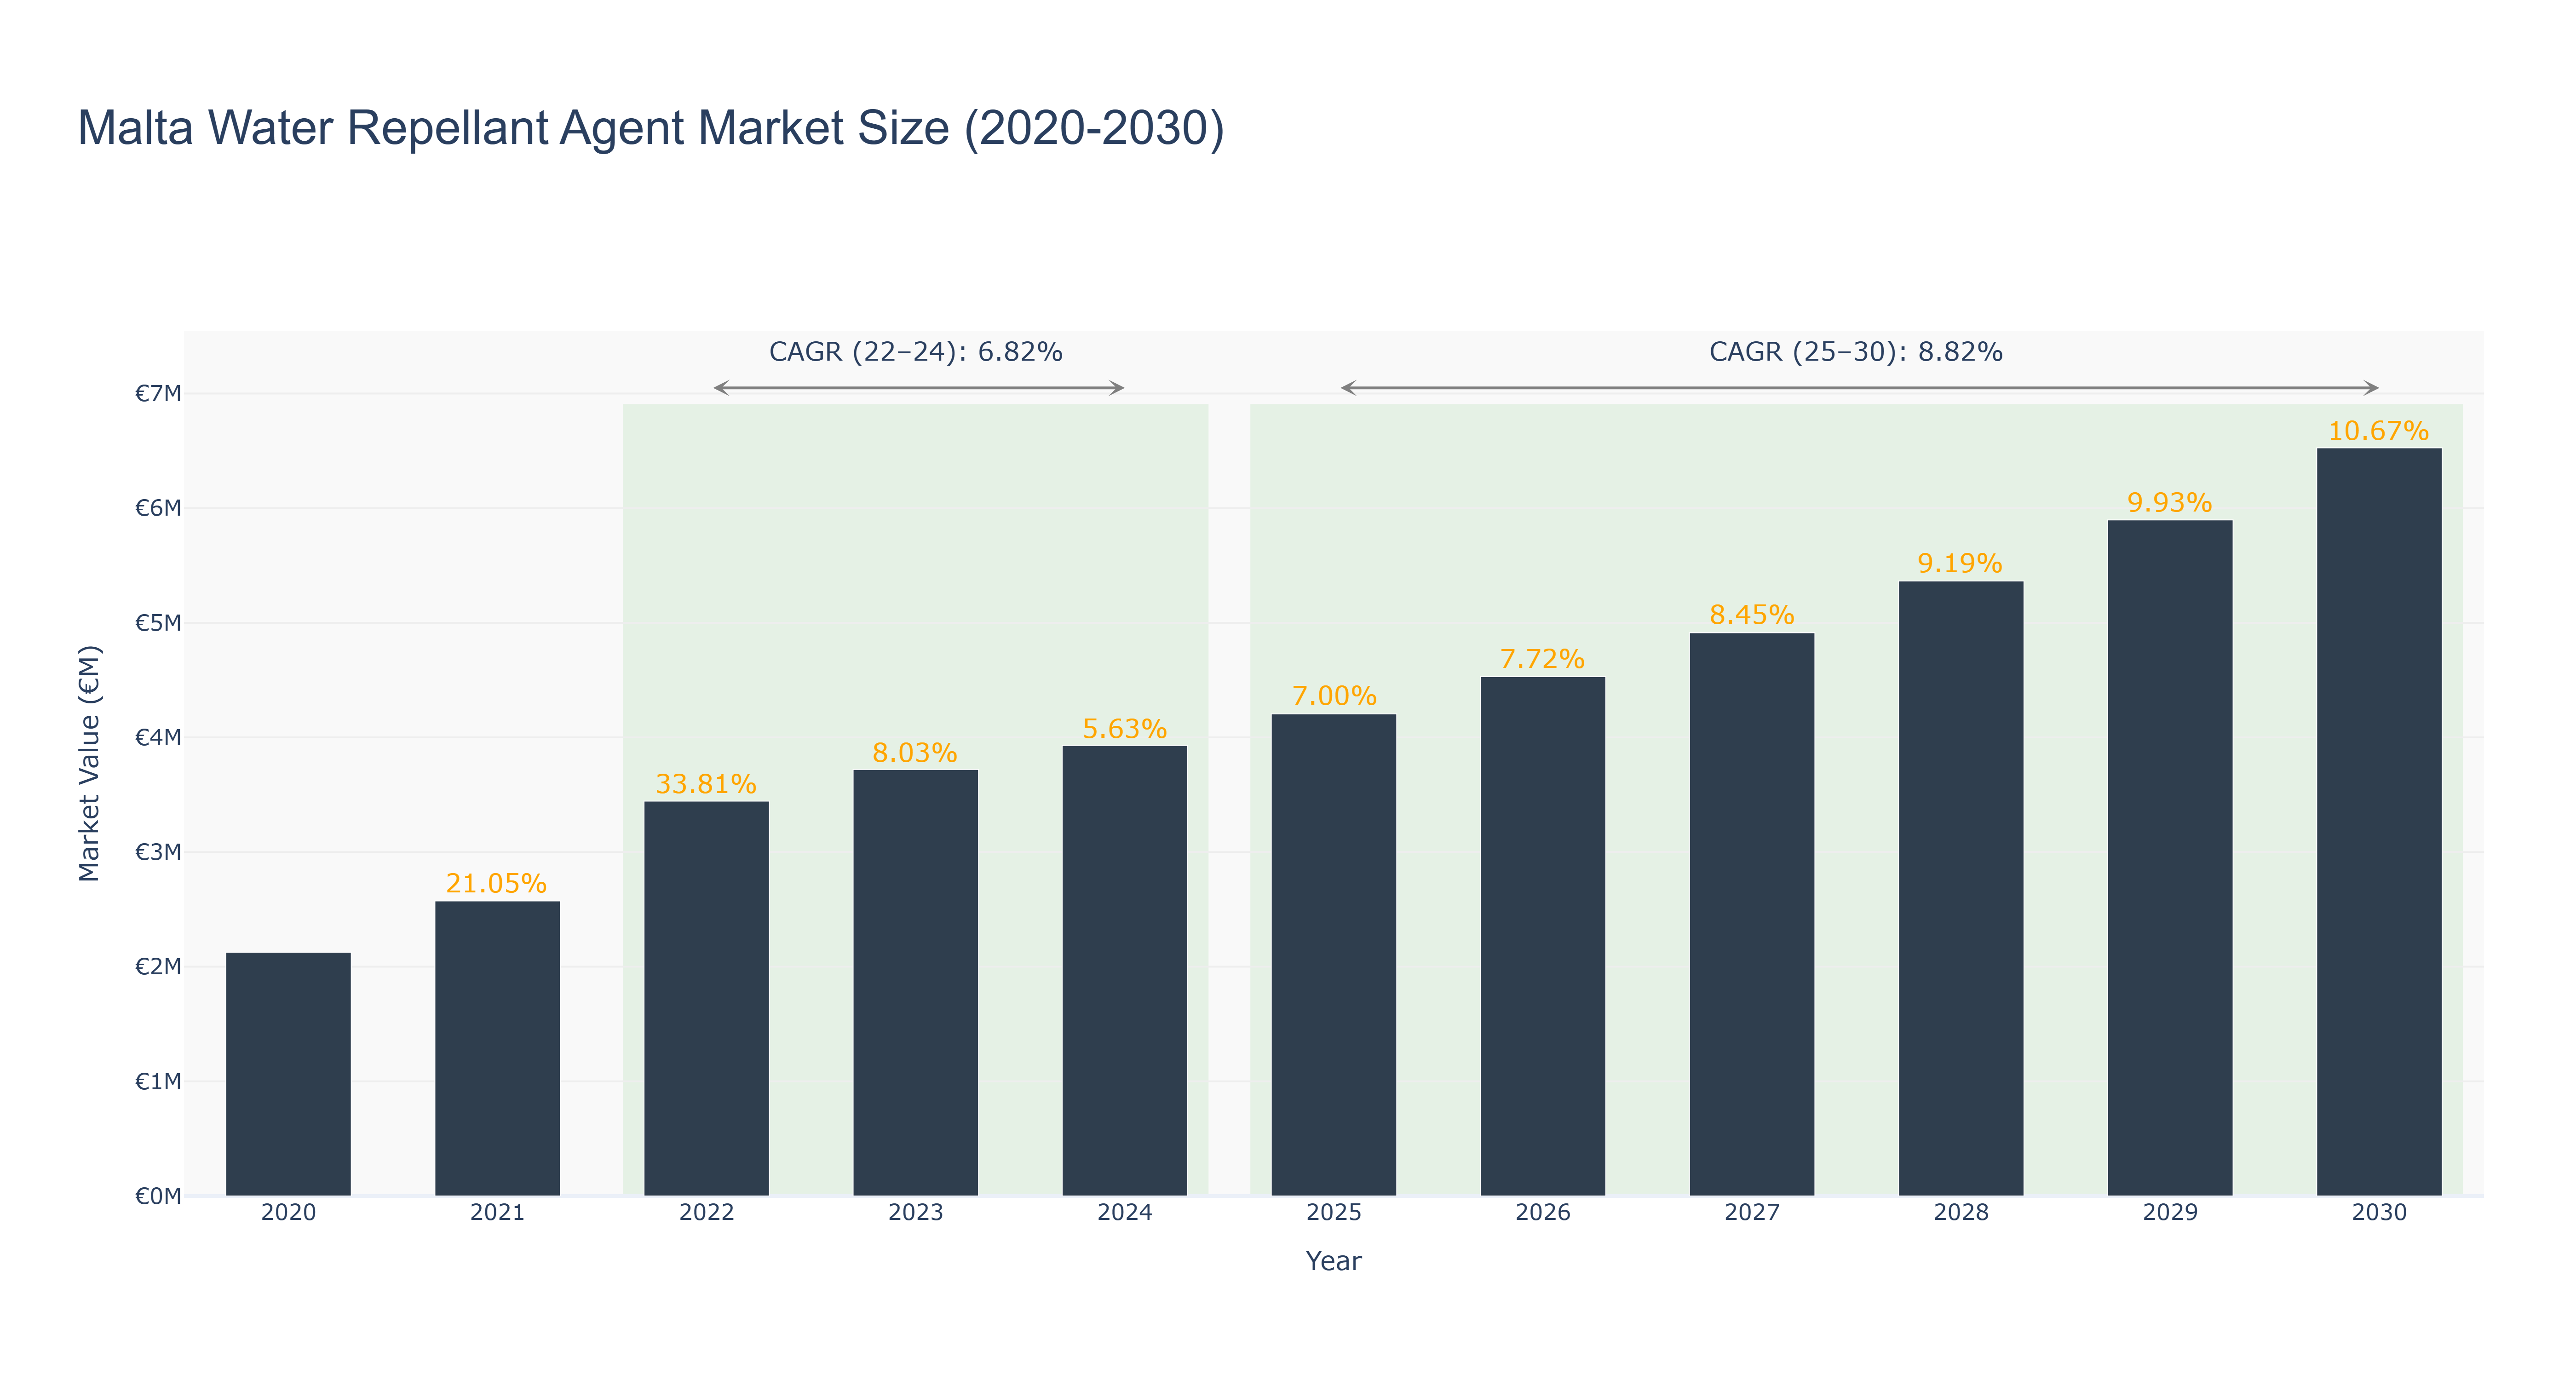
Malta Water Repellant Agent Market has shown a steady growth trajectory over the years. The peak market size of €6.53 million is forecasted for 2030, with a consistent upward trend. Actual market size increased from €2.13 million in 2020 to €3.93 million in 2024, driven by increasing demand for water repellant agents. The forecasted market size is expected to reach €6.53 million by 2030, with a CAGR of 8.82% from 2025 to 2030. The market experienced a slight dip in growth from 2022 to 2024 due to external economic factors, but rebounded with a higher CAGR of 8.82% from 2025 to 2030, reflecting renewed market interest. Recent developments include collaborations with eco-friendly product manufacturers, paving the way for sustainable growth in the water repellant agent market in Malta.
Malta Water Repellant Agent Market: Production & Trade Performance (2019-2025)
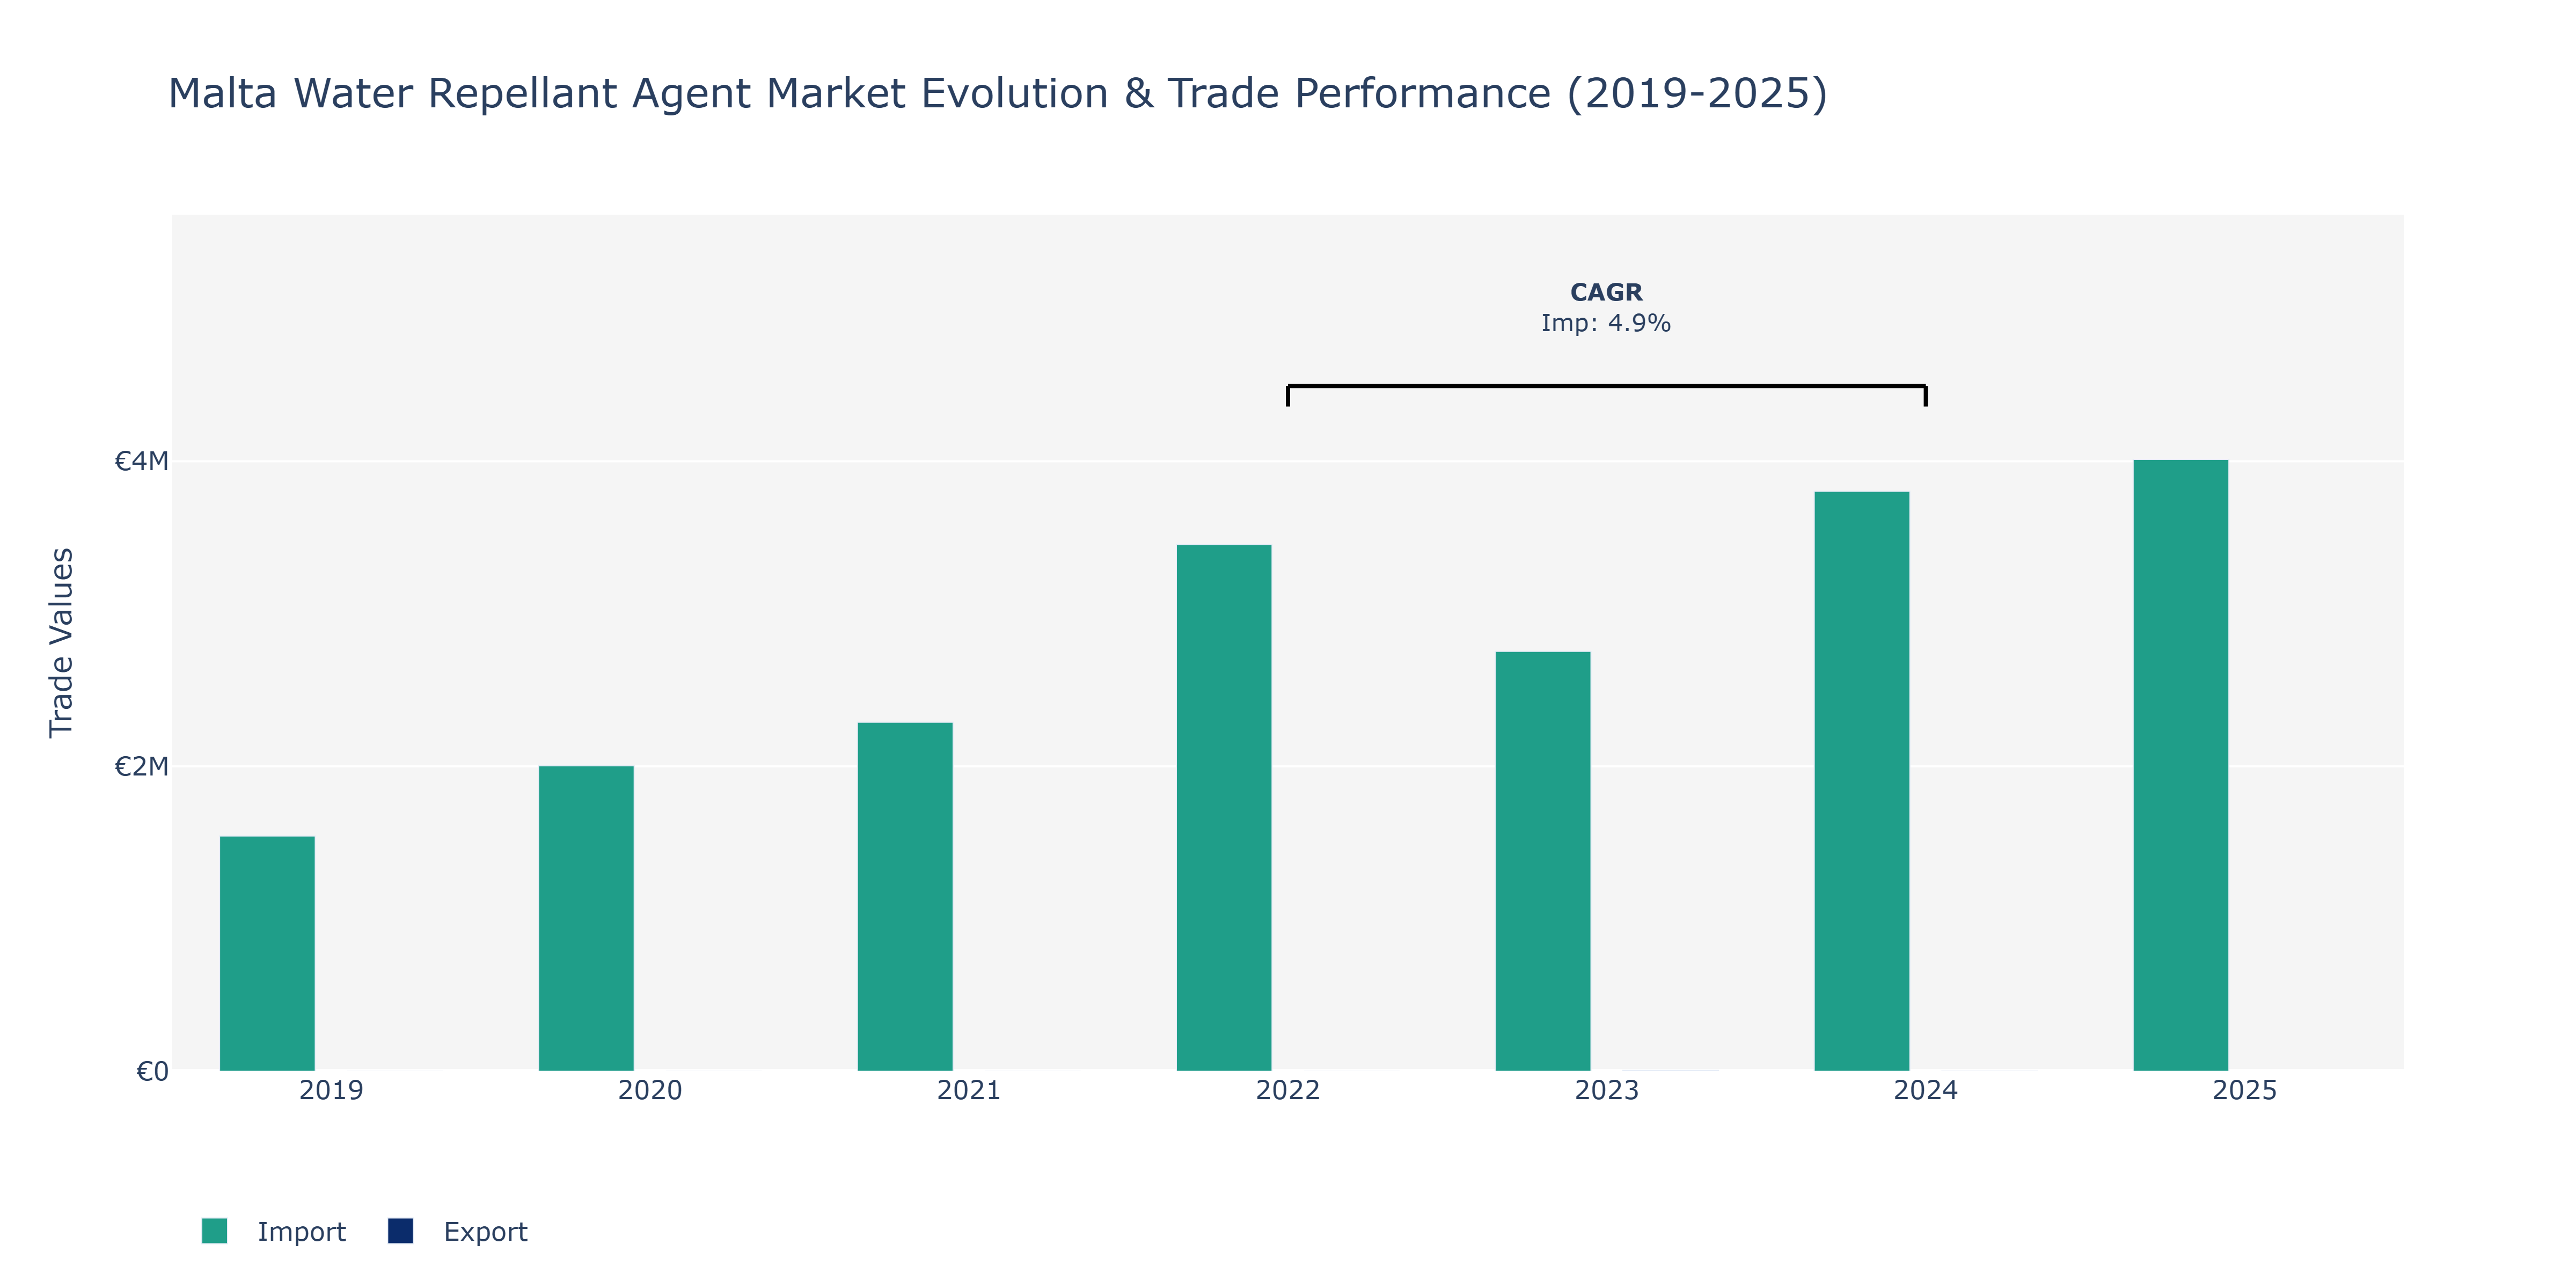
Between 2019 and 2025, the Malta Water Repellant Agent Market witnessed fluctuations in Imports. Starting at €1.54 million in 2019, imports surged to €3.45 million in 2022, indicating a substantial increase. The peak point for imports was reached in 2025, totaling approximately €4.01 million. In contrast, Exports showed a different trend, with figures standing at €4.97 thousand in 2023 and declining to €1.08 thousand in 2024. This decline in exports could be attributed to increased domestic demand or enhanced local production capabilities, leading to a decrease in products available for export. The significant growth in imports from 2022 to 2025 suggests a rising demand for water-repellant agents, possibly driven by infrastructure development projects, increased construction activities, or a focus on sustainable building materials in Malta. Such developments align with global trends emphasizing environmental protection and durability in construction practices, supporting the market's expansion in the region.
Key Highlights of the Report:
- Malta Water Repellant Agent Market Outlook
- Market Size of Malta Water Repellant Agent Market, 2025
- Forecast of Malta Water Repellant Agent Market, 2032
- Historical Data and Forecast of Malta Water Repellant Agent Revenues & Volume for the Period 2022 - 2032F
- Malta Water Repellant Agent Market Trend Evolution
- Malta Water Repellant Agent Market Drivers and Challenges
- Malta Water Repellant Agent Price Trends
- Malta Water Repellant Agent Porter`s Five Forces
- Malta Water Repellant Agent Industry Life Cycle
- Historical Data and Forecast of Malta Water Repellant Agent Market Revenues & Volume By Product Type for the Period 2022 - 2032F
- Historical Data and Forecast of Malta Water Repellant Agent Market Revenues & Volume By Polyurethane for the Period 2022 - 2032F
- Historical Data and Forecast of Malta Water Repellant Agent Market Revenues & Volume By Teflon for the Period 2022 - 2032F
- Historical Data and Forecast of Malta Water Repellant Agent Market Revenues & Volume By Silicones for the Period 2022 - 2032F
- Historical Data and Forecast of Malta Water Repellant Agent Market Revenues & Volume By Technology for the Period 2022 - 2032F
- Historical Data and Forecast of Malta Water Repellant Agent Market Revenues & Volume By Water-Based for the Period 2022 - 2032F
- Historical Data and Forecast of Malta Water Repellant Agent Market Revenues & Volume By Solvent-Based for the Period 2022 - 2032F
- Historical Data and Forecast of Malta Water Repellant Agent Market Revenues & Volume By Others for the Period 2022 - 2032F
- Historical Data and Forecast of Malta Water Repellant Agent Market Revenues & Volume By End Use for the Period 2022 - 2032F
- Historical Data and Forecast of Malta Water Repellant Agent Market Revenues & Volume By Textiles for the Period 2022 - 2032F
- Historical Data and Forecast of Malta Water Repellant Agent Market Revenues & Volume By Construction for the Period 2022 - 2032F
- Historical Data and Forecast of Malta Water Repellant Agent Market Revenues & Volume By Automotive for the Period 2022 - 2032F
- Historical Data and Forecast of Malta Water Repellant Agent Market Revenues & Volume By Medical for the Period 2022 - 2032F
- Historical Data and Forecast of Malta Water Repellant Agent Market Revenues & Volume By Others for the Period 2022 - 2032F
- Malta Water Repellant Agent Import Export Trade Statistics
- Market Opportunity Assessment By Product Type
- Market Opportunity Assessment By Technology
- Market Opportunity Assessment By End Use
- Malta Water Repellant Agent Top Companies Market Share
- Malta Water Repellant Agent Competitive Benchmarking By Technical and Operational Parameters
- Malta Water Repellant Agent Company Profiles
- Malta Water Repellant Agent Key Strategic Recommendations
Frequently Asked Questions About the Market Study (FAQs):
6Wresearch actively monitors the Malta Water Repellant Agent Market and publishes its comprehensive annual report, highlighting emerging trends, growth drivers, revenue analysis, and forecast outlook. Our insights help businesses to make data-backed strategic decisions with ongoing market dynamics. Our analysts track relevent industries related to the Malta Water Repellant Agent Market, allowing our clients with actionable intelligence and reliable forecasts tailored to emerging regional needs.
Yes, we provide customisation as per your requirements. To learn more, feel free to contact us on sales@6wresearch.com
1 Executive Summary |
2 Introduction |
2.1 Key Highlights of the Report |
2.2 Report Description |
2.3 Market Scope & Segmentation |
2.4 Research Methodology |
2.5 Assumptions |
3 Malta Water Repellant Agent Market Overview |
3.1 Malta Country Macro Economic Indicators |
3.2 Malta Water Repellant Agent Market Revenues & Volume, 2022 & 2032F |
3.3 Malta Water Repellant Agent Market - Industry Life Cycle |
3.4 Malta Water Repellant Agent Market - Porter's Five Forces |
3.5 Malta Water Repellant Agent Market Revenues & Volume Share, By Product Type, 2022 & 2032F |
3.6 Malta Water Repellant Agent Market Revenues & Volume Share, By Technology, 2022 & 2032F |
3.7 Malta Water Repellant Agent Market Revenues & Volume Share, By End Use, 2022 & 2032F |
4 Malta Water Repellant Agent Market Dynamics |
4.1 Impact Analysis |
4.2 Market Drivers |
4.2.1 Increasing demand for waterproofing solutions in construction industry |
4.2.2 Growing awareness about benefits of using water repellent agents in preserving building materials |
4.2.3 Rise in infrastructure development projects in Malta |
4.3 Market Restraints |
4.3.1 High initial costs associated with water repellent agents |
4.3.2 Limited availability of technologically advanced products in the market |
5 Malta Water Repellant Agent Market Trends |
6 Malta Water Repellant Agent Market Segmentations |
6.1 Malta Water Repellant Agent Market, By Product Type |
6.1.1 Overview and Analysis |
6.1.2 Malta Water Repellant Agent Market Revenues & Volume, By Polyurethane, 2022 - 2032F |
6.1.3 Malta Water Repellant Agent Market Revenues & Volume, By Teflon, 2022 - 2032F |
6.1.4 Malta Water Repellant Agent Market Revenues & Volume, By Silicones, 2022 - 2032F |
6.2 Malta Water Repellant Agent Market, By Technology |
6.2.1 Overview and Analysis |
6.2.2 Malta Water Repellant Agent Market Revenues & Volume, By Water-Based, 2022 - 2032F |
6.2.3 Malta Water Repellant Agent Market Revenues & Volume, By Solvent-Based, 2022 - 2032F |
6.2.4 Malta Water Repellant Agent Market Revenues & Volume, By Others, 2022 - 2032F |
6.3 Malta Water Repellant Agent Market, By End Use |
6.3.1 Overview and Analysis |
6.3.2 Malta Water Repellant Agent Market Revenues & Volume, By Textiles, 2022 - 2032F |
6.3.3 Malta Water Repellant Agent Market Revenues & Volume, By Construction, 2022 - 2032F |
6.3.4 Malta Water Repellant Agent Market Revenues & Volume, By Automotive, 2022 - 2032F |
6.3.5 Malta Water Repellant Agent Market Revenues & Volume, By Medical, 2022 - 2032F |
6.3.6 Malta Water Repellant Agent Market Revenues & Volume, By Others, 2022 - 2032F |
7 Malta Water Repellant Agent Market Import-Export Trade Statistics |
7.1 Malta Water Repellant Agent Market Export to Major Countries |
7.2 Malta Water Repellant Agent Market Imports from Major Countries |
8 Malta Water Repellant Agent Market Key Performance Indicators |
8.1 Number of construction permits issued in Malta |
8.2 Percentage of buildings using water repellent agents |
8.3 Investment in research and development for new water repellent agent technologies |
9 Malta Water Repellant Agent Market - Opportunity Assessment |
9.1 Malta Water Repellant Agent Market Opportunity Assessment, By Product Type, 2022 & 2032F |
9.2 Malta Water Repellant Agent Market Opportunity Assessment, By Technology, 2022 & 2032F |
9.3 Malta Water Repellant Agent Market Opportunity Assessment, By End Use, 2022 & 2032F |
10 Malta Water Repellant Agent Market - Competitive Landscape |
10.1 Malta Water Repellant Agent Market Revenue Share, By Companies, 2025 |
10.2 Malta Water Repellant Agent Market Competitive Benchmarking, By Operating and Technical Parameters |
11 Company Profiles |
12 Recommendations | 13 Disclaimer |
Global Go To Market Strategy - 2030
Export potential enables firms to identify high-growth global markets with greater confidence by combining advanced trade intelligence with a structured quantitative methodology. The framework analyzes emerging demand trends and country-level import patterns while integrating macroeconomic and trade datasets such as GDP and population forecasts, bilateral import–export flows, tariff structures, elasticity differentials between developed and developing economies, geographic distance, and import demand projections. Using weighted trade values from 2020–2024 as the base period to project country-to-country export potential for 2030, these inputs are operationalized through calculated drivers such as gravity model parameters, tariff impact factors, and projected GDP per-capita growth. Through an analysis of hidden potentials, demand hotspots, and market conditions that are most favorable to success, this method enables firms to focus on target countries, maximize returns, and global expansion with data, backed by accuracy.
By factoring in the projected importer demand gap that is currently unmet and could be potential opportunity, it identifies the potential for the Exporter (Country) among 190 countries, against the general trade analysis, which identifies the biggest importer or exporter.
To discover high-growth global markets and optimize your business strategy:
Click Here
Pricing
- Single User License$ 1,995
- Department License$ 2,400
- Site License$ 3,120
- Global License$ 3,795

Leadership Perspectives from Industry Events
Search
Thought Leadership and Analyst Meet


Our Clients
6WResearch In News
- India Air Conditioner Market Set for Strong Rebound in 2026 After Weather-Led Correction and GST-Driven Recovery: 6Wresearch
- ADAS in India: How Automatic Emergency Braking, Blind Spot Detection & Driver Monitoring are Transforming Road Safety
- Doha a strategic location for EV manufacturing hub: IPA Qatar
- Demand for luxury TVs surging in the GCC, says Samsung
- Empowering Growth: The Thriving Journey of Bangladesh’s Cable Industry
- Demand for luxury TVs surging in the GCC, says Samsung
Latest Reports
- Nicaragua RPG Gaming Market (2026-2032)
- New Zealand RPG Gaming Market (2026-2032)
- Netherlands RPG Gaming Market (2026-2032)
- Nauru RPG Gaming Market (2026-2032)
- Namibia RPG Gaming Market (2026-2032)
- Mozambique RPG Gaming Market (2026-2032)
- Montenegro RPG Gaming Market (2026-2032)
- Mongolia RPG Gaming Market (2026-2032)
- Monaco RPG Gaming Market (2026-2032)
- Micronesia RPG Gaming Market (2026-2032)
Industry Events and Analyst Meet

EV India Expo 2026

HIMTEX 2026

India Refining Summit 2026

India EV Show 2026

EV tech India Expo 2026
Whitepaper
- Middle East & Africa Commercial Security Market Click here to view more.
- Middle East & Africa Fire Safety Systems & Equipment Market Click here to view more.
- GCC Drone Market Click here to view more.
- Middle East Lighting Fixture Market Click here to view more.
- GCC Physical & Perimeter Security Market Click here to view more.