Mexico Commercial vehicles Market (2026-2032) | Share, Trends, Value, Analysis, Size, Revenue, Industry, Outlook, COVID-19 IMPACT, Growth, Forecast & Companies
Market Forecast By Product (Light Commercial Vehicles (LCVs), Heavy Trucks, Buses & Coaches), By End-Users (Industrial, Mining & Construction, Logistics, Passenger Transportation, Others) And Competitive Landscape
| Product Code: ETC027983 | Publication Date: Jun 2023 | Updated Date: Jun 2026 | Product Type: Report | |
| Publisher: 6Wresearch | Author: Ravi Bhandari | No. of Pages: 70 | No. of Figures: 35 | No. of Tables: 5 |
Mexico Commercial vehicles Market Summary
The mexico commercial vehicles market was estimated at USD 138 Million in 2025 and is projected to reach USD 159 Million by 2032, growing at a CAGR of 1.2% from 2026 to 2032.
Mexico Commercial vehicles Market Growth Rate Analysis (2021-2032)
The Mexico commercial vehicles market has shown notable fluctuations over the past few years, starting with a decline of 4.0% in 2021, primarily due to pandemic-related disruptions and supply chain challenges. However, 2022 marked a significant rebound with a 6.4% growth as demand surged, driven by increased investments in infrastructure and a resurgence in e-commerce logistics. This upward trend continued into 2023 with a growth rate of 4.3%, propelled by ongoing investments and a shift towards cleaner technologies. As we look forward to 2024 and beyond, moderate growth rates around 4.0% to 2.4% are expected, reflecting a stable market fueled by consumer demand and an evolving regulatory landscape focused on energy transition and sustainability.
Mexico Commercial vehicles Market Year-wise Growth Rate and Key Drivers
This graph highlights how the Mexico Commercial vehicles Market has steadily grown over the past five years, supported by major growth factors.
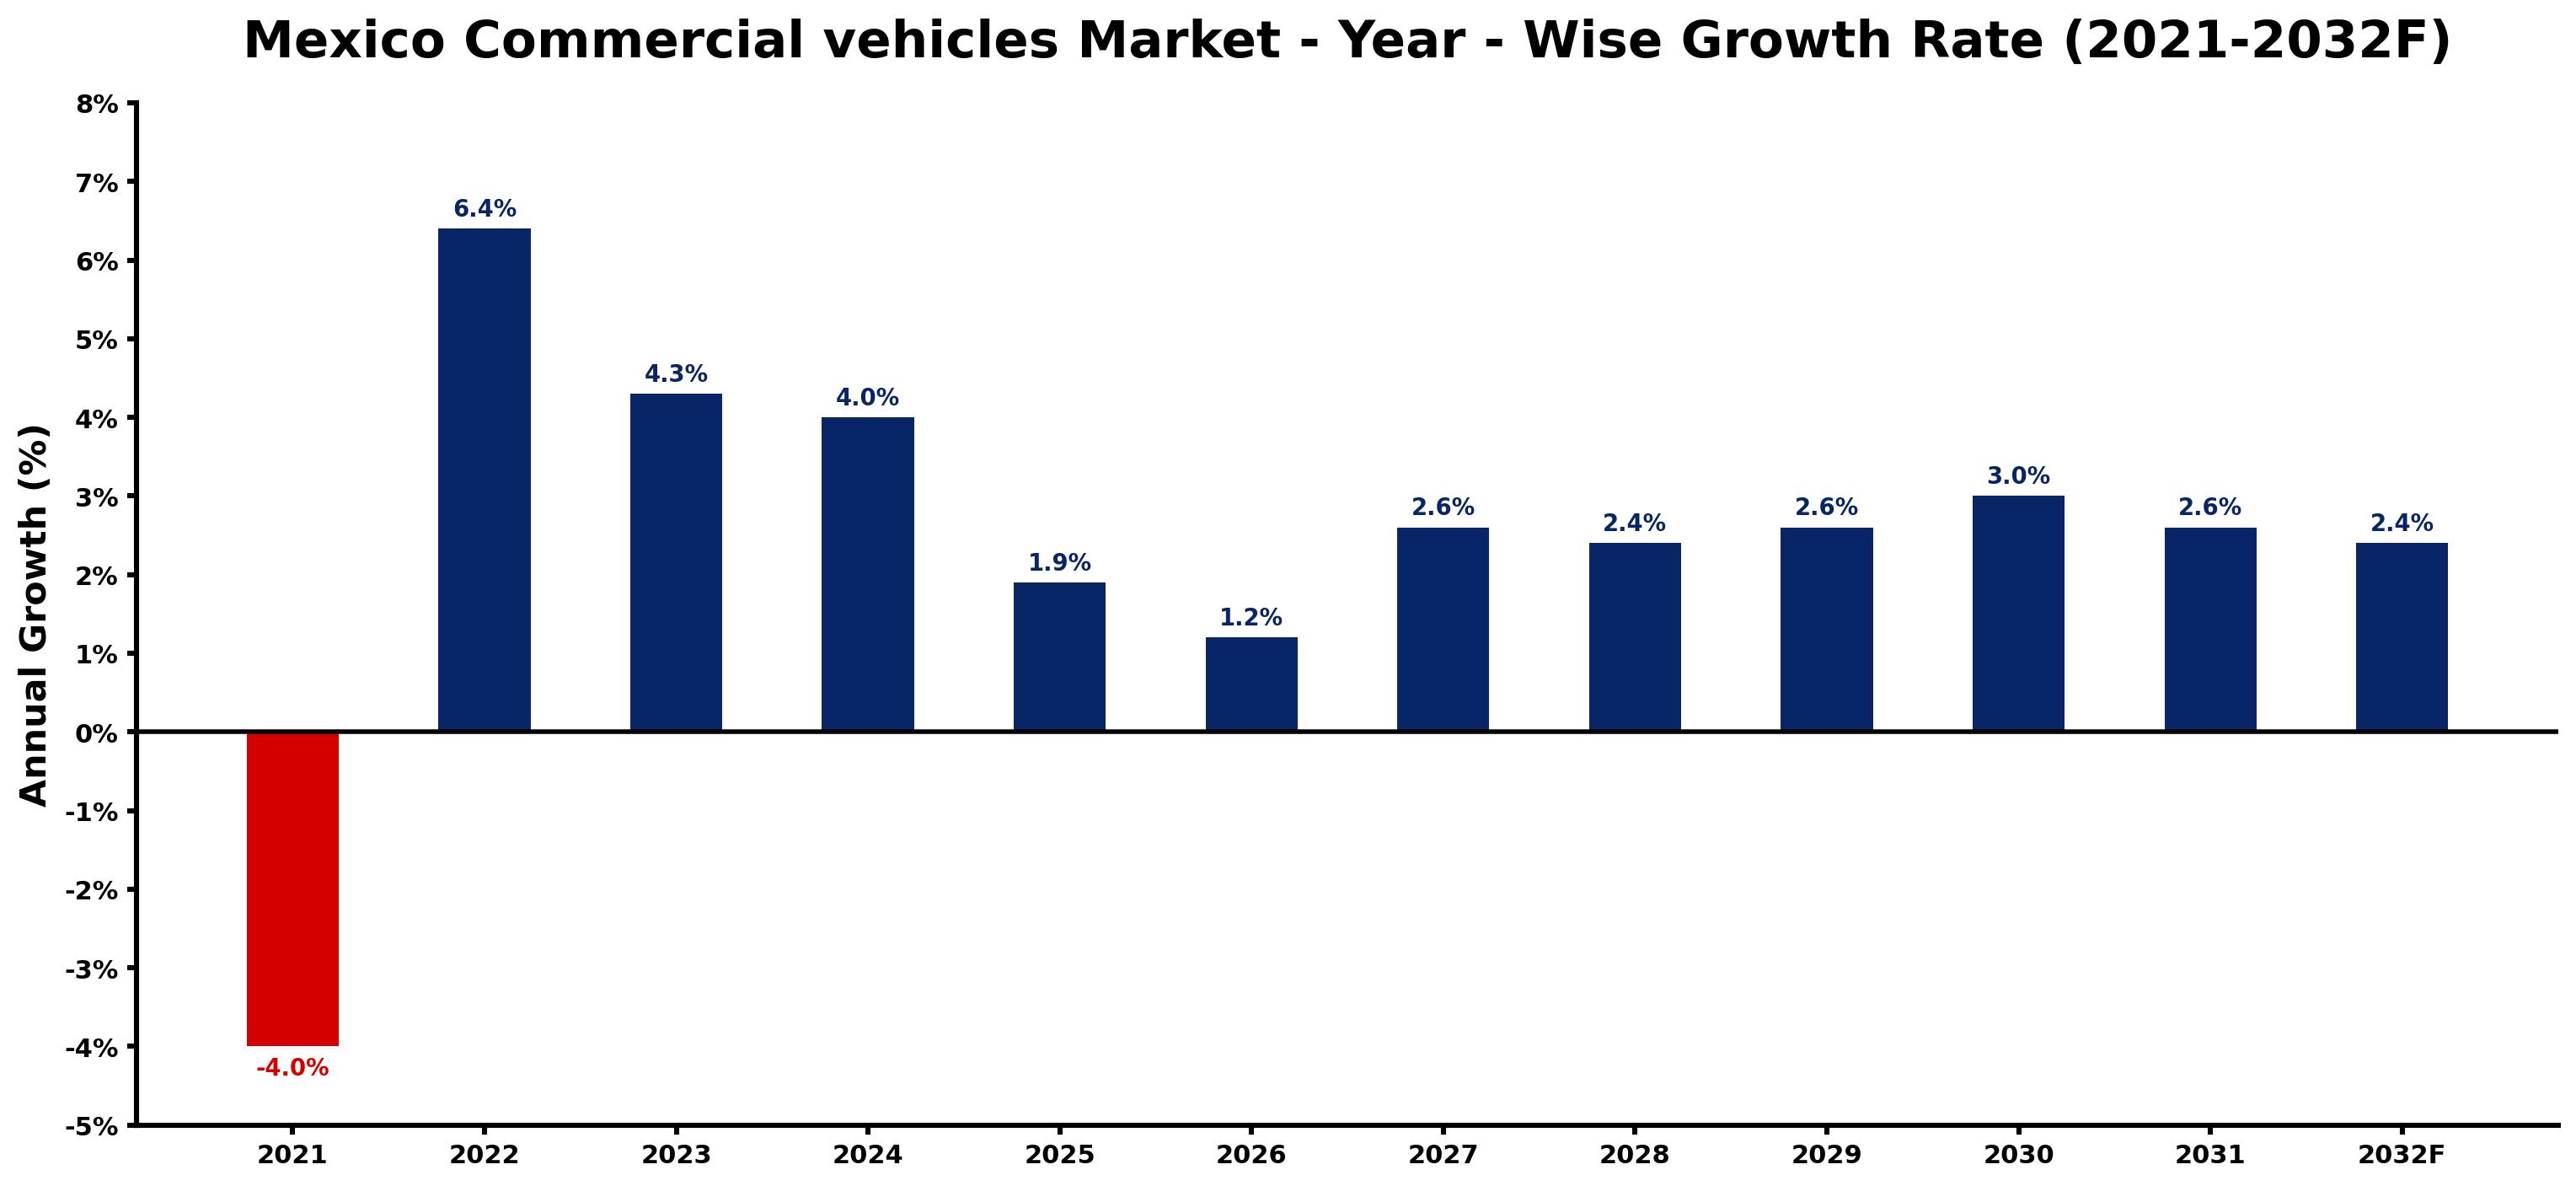
The table below presents the year wise growth rates along with the key drivers influencing the market
| Year | Growth Rate | Major Drivers |
| 2021 | -4.0% | Economic instability stemming from the pandemic diminished business investments in fleet expansions and upgrades. |
| 2022 | 6.4% | Oil price volatility influenced fleet management decisions across various industries. |
| 2023 | 4.3% | Growing e-commerce trends prompted businesses to expand their delivery vehicle fleets. |
| 2024 | 4.0% | Infrastructure investments supported urban development and demand for larger commercial vehicles. |
| 2025 | 1.9% | Shift to electric commercial vehicles gained traction among environmentally conscious businesses. |
| 2026 | 1.2% | Local manufacturing initiatives reduced import dependencies for commercial vehicle parts and assembly. |
| 2027 | 2.6% | Technological innovations improved fuel efficiency, appealing to cost-conscious fleet operators. |
| 2028 | 2.4% | Increased urbanization created challenges for traditional transportation methods, requiring adaptable vehicle solutions. |
| 2029 | 2.6% | Changing consumer behaviors drove logistics companies to diversify their service offerings. |
| 2030 | 3.0% | International trade agreements boosted cross-border commercial activities, enhancing vehicle demand. |
| 2031 | 2.6% | Advanced telematics systems became critical for fleet management and operational efficiency. |
| 2032 | 2.4% | Focus on sustainable practices pushed companies toward eco-friendly commercial vehicle options. |
Note - Market size estimations and growth projections presented in this report are based on 6Wresearch's advanced forecasting approach, validated with industry datasets as of June 2026.
Mexico Commercial vehicles Market Synopsis
The Mexico Commercial vehicles Market is projected to reach 1.2% and witness significant growth during the forecast period (2026-2032). This robust growth trajectory is largely driven by several key factors that contribute to the increasing demand for commercial vehicles across various sectors, including transportation, construction, and mining.
Mexico Commercial vehicles Market Growth Drivers
Several critical drivers are influencing the expansion of the Mexico commercial vehicles market. Firstly, the rising demand for new and efficient commercial vehicles is evident in both public and private sectors. This demand is fueled by the growth of transportation services that cater to a growing urban population. Furthermore, infrastructure projects initiated by the government create a substantial need for commercial vehicles, particularly in construction and logistics.
- Government investment in transportation infrastructure is set to stimulate the commercial vehicles market. By enhancing road networks and expanding public transport systems, the government is directly fostering a conducive environment for vehicle purchases.
- The mining sector's ongoing expansion necessitates the use of heavy-duty commercial vehicles, driving demand for specialized vehicles designed for rugged environments. This trend is expected to grow as mining operations continue to innovate.
- Increasing per capita income in Mexico is altering consumer spending habits, leading to a surge in demand for luxury buses and coaches. As consumers become more affluent, there is a distinct shift towards comfort and quality in public transport options.
- Moreover, manufacturers are responding to market needs by focusing on developing fuel-efficient commercial vehicles. This strategic shift not only aligns with global emission regulation norms but also meets the demands of environmentally conscious consumers.
- Lastly, the rise in shared mobility and rental services has created new business models that rely heavily on commercial vehicles, thereby broadening the market's scope and inviting innovative solutions from various industry players.
Mexico Commercial vehicles Market Trends and Opportunities
The Mexico commercial vehicles market is witnessing several trends that present ample opportunities for growth. One notable trend is the increasing integration of technology in commercial vehicles, including advanced telematics, fleet management systems, and electric vehicle technologies. These advancements are reshaping the market landscape and encouraging fleet operators to upgrade their vehicles for enhanced efficiency and sustainability.
- The shift towards electric vehicles (EVs) in the commercial segment is gaining traction, supported by government incentives for cleaner transport options. The transition to EVs is anticipated to be swift, providing new avenues for investment and innovation.
- Another significant trend is the increasing popularity of connected vehicles, which enable real-time data sharing and operational insights. This technology can substantially enhance fleet performance and driver safety.
- There is also a growing emphasis on safety features in commercial vehicles, with manufacturers focusing on incorporating advanced driver-assistance systems (ADAS). This trend reflects the industry's responsiveness to regulatory and consumer demands for safer transportation solutions.
- Additionally, the demand for customization in commercial vehicles is on the rise, with consumers looking for tailored solutions that fit their specific operational requirements. This trend is likely to drive innovation in vehicle design and functionality.
- Lastly, as the population continues to urbanize, the need for effective public transportation solutions, including luxury coaches, is expected to increase, thereby expanding market opportunities for manufacturers.
Mexico Commercial vehicles Market Government Investment and Initiatives
Government initiatives play a crucial role in shaping the Mexico commercial vehicles market. The Mexican government has launched several policies aimed at improving the automotive sector's competitiveness, including incentives for investment in technology and innovation. These initiatives not only encourage domestic manufacturing but also attract foreign investment in automotive infrastructure.
- Public spending on transportation infrastructure, driven by an increase in budget allocations for highways, bridges, and public transportation systems, is likely to create significant opportunities for commercial vehicle sales.
- Furthermore, the government's focus on promoting environmentally friendly vehicles is evident through various subsidy programs aimed at encouraging the adoption of electric and hybrid commercial vehicles.
- Strategic partnerships between public and private sectors are being formed to enhance logistical operations, improve last-mile delivery, and optimize transportation networks, resulting in enhanced demand for commercial vehicles.
- The emphasis on regulatory frameworks that uphold safety and emissions standards is also driving investments in advanced technology within the commercial vehicles sector, ensuring compliance while enhancing vehicle performance.
- Overall, the government's proactive stance in improving the automotive ecosystem not only facilitates market growth but also supports sustainable practices within the commercial vehicles market.
Mexico Commercial vehicles Market Latest Developments (May 2025 - June 2026)
During the period from May 2025 to June 2026, the Mexico commercial vehicles market has observed several significant developments. Notably, advances in vehicle electrification technologies have led to increased interest from fleet operators in acquiring electric commercial vehicles. Manufacturers are enhancing their product offerings by integrating more efficient and advanced technologies to meet growing consumer expectations.
- The expansion of charging infrastructure throughout urban areas has bolstered the viability of electric commercial vehicles, encouraging more companies to transition their fleets to greener options.
- Additionally, sourcing sustainable materials for vehicle manufacturing is becoming increasingly important, as companies aim to align with global sustainability goals and consumer preferences for environmentally friendly products.
- Regulatory changes aimed at further tightening emissions standards have prompted manufacturers to innovate rapidly, ensuring compliance while maintaining vehicle performance and reliability.
- Investment in research and development has intensified as companies strive to adopt cutting-edge technologies, including autonomous driving systems that promise to revolutionize the logistics and transport sectors.
- Lastly, the market has seen a surge in collaborations between technology firms and automotive manufacturers, focusing on enhancing connectivity features in commercial vehicles to improve operational efficiency.
Mexico Commercial vehicles Market - Key Attractiveness of the Report
- 10 Years of Market Numbers
- Historical Data Starting from 2022 to 2025
- Base Year: 2025
- Forecast Data until 2032
- Key Performance Indicators Impacting the Market
- Major Upcoming Developments and Projects
Key Highlights of the Report:
- Mexico Commercial vehicles Market Outlook
- Market Size of Mexico Commercial vehicles Market, 2025
- Forecast of Mexico Commercial vehicles Market, 2032F
- Historical Data and Forecast of Mexico Commercial vehicles Revenues & Volume for the Period 2022-2032F
- Mexico Commercial vehicles Market Trend Evolution
- Mexico Commercial vehicles Market Drivers and Challenges
- Mexico Commercial vehicles Price Trends
- Mexico Commercial vehicles Porter's Five Forces
- Mexico Commercial vehicles Industry Life Cycle
- Historical Data and Forecast of Mexico Commercial vehicles Market Revenues & Volume By Product for the Period 2022-2032F
- Historical Data and Forecast of Mexico Commercial vehicles Market Revenues & Volume By Light Commercial Vehicles (LCVs) for the Period 2022-2032F
- Historical Data and Forecast of Mexico Commercial vehicles Market Revenues & Volume By Heavy Trucks for the Period 2022-2032F
- Historical Data and Forecast of Mexico Commercial vehicles Market Revenues & Volume By Buses & Coaches for the Period 2022-2032F
- Historical Data and Forecast of Mexico Commercial vehicles Market Revenues & Volume By End-Users for the Period 2022-2032F
- Historical Data and Forecast of Mexico Commercial vehicles Market Revenues & Volume By Industrial for the Period 2022-2032F
- Historical Data and Forecast of Mexico Commercial vehicles Market Revenues & Volume By Mining & Construction for the Period 2022-2032F
- Historical Data and Forecast of Mexico Commercial vehicles Market Revenues & Volume By Logistics for the Period 2022-2032F
- Historical Data and Forecast of Mexico Commercial vehicles Market Revenues & Volume By Passenger Transportation for the Period 2022-2032F
- Historical Data and Forecast of Mexico Commercial vehicles Market Revenues & Volume By Others for the Period 2022-2032F
- Mexico Commercial vehicles Import Export Trade Statistics
- Market Opportunity Assessment By Product
- Market Opportunity Assessment By End-Users
- Mexico Commercial vehicles Top Companies Market Share
- Mexico Commercial vehicles Competitive Benchmarking By Technical and Operational Parameters
- Mexico Commercial vehicles Company Profiles
- Mexico Commercial vehicles Key Strategic Recommendations
Frequently Asked Questions About the Market Study (FAQs):
The Mexico commercial vehicles market is expected to grow at a CAGR of 6.1% from the figures recorded in 2020.
Key factors include government initiatives, rising per capita income, demand for fuel-efficient vehicles, and the growth of the transportation and logistics sectors.
The government is supporting the market through public investments in infrastructure, incentives for electric vehicles, and policies that promote technological advancements in the automotive sector.
Emerging trends include the adoption of electric vehicles, enhanced safety features, connected vehicle technologies, and the shift towards rental and shared mobility solutions.
6Wresearch actively monitors the Mexico Commercial vehicles Market and publishes its comprehensive annual report, highlighting emerging trends, growth drivers, revenue analysis, and forecast outlook. Our insights help businesses to make data-backed strategic decisions with ongoing market dynamics. Our analysts track relevent industries related to the Mexico Commercial vehicles Market, allowing our clients with actionable intelligence and reliable forecasts tailored to emerging regional needs.
Yes, we provide customisation as per your requirements. To learn more, feel free to contact us on sales@6wresearch.com
1 Executive Summary |
2 Introduction |
2.1 Key Highlights of the Report |
2.2 Report Description |
2.3 Market Scope & Segmentation |
2.4 Research Methodology |
2.5 Assumptions |
3 Mexico Commercial vehicles Market Overview |
3.1 Mexico Country Macro Economic Indicators |
3.2 Mexico Commercial vehicles Market Revenues & Volume, 2022 & 2032F |
3.3 Mexico Commercial vehicles Market - Industry Life Cycle |
3.4 Mexico Commercial vehicles Market - Porter's Five Forces |
3.5 Mexico Commercial vehicles Market Revenues & Volume Share, By Product, 2022 & 2032F |
3.6 Mexico Commercial vehicles Market Revenues & Volume Share, By End-Users, 2022 & 2032F |
4 Mexico Commercial vehicles Market Dynamics |
4.1 Impact Analysis |
4.2 Market Drivers |
4.3 Market Restraints |
5 Mexico Commercial vehicles Market Trends |
6 Mexico Commercial vehicles Market, By Types |
6.1 Mexico Commercial vehicles Market, By Product |
6.1.1 Overview and Analysis |
6.1.2 Mexico Commercial vehicles Market Revenues & Volume, By Product, 2022-2032F |
6.1.3 Mexico Commercial vehicles Market Revenues & Volume, By Light Commercial Vehicles (LCVs), 2022-2032F |
6.1.4 Mexico Commercial vehicles Market Revenues & Volume, By Heavy Trucks, 2022-2032F |
6.1.5 Mexico Commercial vehicles Market Revenues & Volume, By Buses & Coaches, 2022-2032F |
6.2 Mexico Commercial vehicles Market, By End-Users |
6.2.1 Overview and Analysis |
6.2.2 Mexico Commercial vehicles Market Revenues & Volume, By Industrial, 2022-2032F |
6.2.3 Mexico Commercial vehicles Market Revenues & Volume, By Mining & Construction, 2022-2032F |
6.2.4 Mexico Commercial vehicles Market Revenues & Volume, By Logistics, 2022-2032F |
6.2.5 Mexico Commercial vehicles Market Revenues & Volume, By Passenger Transportation, 2022-2032F |
6.2.6 Mexico Commercial vehicles Market Revenues & Volume, By Others, 2022-2032F |
7 Mexico Commercial vehicles Market Import-Export Trade Statistics |
7.1 Mexico Commercial vehicles Market Export to Major Countries |
7.2 Mexico Commercial vehicles Market Imports from Major Countries |
8 Mexico Commercial vehicles Market Key Performance Indicators |
9 Mexico Commercial vehicles Market - Opportunity Assessment |
9.1 Mexico Commercial vehicles Market Opportunity Assessment, By Product, 2022 & 2032F |
9.2 Mexico Commercial vehicles Market Opportunity Assessment, By End-Users, 2022 & 2032F |
10 Mexico Commercial vehicles Market - Competitive Landscape |
10.1 Mexico Commercial vehicles Market Revenue Share, By Companies, 2025 |
10.2 Mexico Commercial vehicles Market Competitive Benchmarking, By Operating and Technical Parameters |
11 Company Profiles |
12 Recommendations |
13 Disclaimer |
Global Go To Market Strategy - 2030
Export potential enables firms to identify high-growth global markets with greater confidence by combining advanced trade intelligence with a structured quantitative methodology. The framework analyzes emerging demand trends and country-level import patterns while integrating macroeconomic and trade datasets such as GDP and population forecasts, bilateral import–export flows, tariff structures, elasticity differentials between developed and developing economies, geographic distance, and import demand projections. Using weighted trade values from 2020–2024 as the base period to project country-to-country export potential for 2030, these inputs are operationalized through calculated drivers such as gravity model parameters, tariff impact factors, and projected GDP per-capita growth. Through an analysis of hidden potentials, demand hotspots, and market conditions that are most favorable to success, this method enables firms to focus on target countries, maximize returns, and global expansion with data, backed by accuracy.
By factoring in the projected importer demand gap that is currently unmet and could be potential opportunity, it identifies the potential for the Exporter (Country) among 190 countries, against the general trade analysis, which identifies the biggest importer or exporter.
To discover high-growth global markets and optimize your business strategy:
Click Here
Pricing
- Single User License$ 1,995
- Department License$ 2,400
- Site License$ 3,120
- Global License$ 3,795

Leadership Perspectives from Industry Events
Search
Thought Leadership and Analyst Meet


Our Clients
6WResearch In News
- India Air Conditioner Market Set for Strong Rebound in 2026 After Weather-Led Correction and GST-Driven Recovery: 6Wresearch
- ADAS in India: How Automatic Emergency Braking, Blind Spot Detection & Driver Monitoring are Transforming Road Safety
- Doha a strategic location for EV manufacturing hub: IPA Qatar
- Demand for luxury TVs surging in the GCC, says Samsung
- Empowering Growth: The Thriving Journey of Bangladesh’s Cable Industry
- Demand for luxury TVs surging in the GCC, says Samsung
Latest Reports
- Nicaragua RPG Gaming Market (2026-2032)
- New Zealand RPG Gaming Market (2026-2032)
- Netherlands RPG Gaming Market (2026-2032)
- Nauru RPG Gaming Market (2026-2032)
- Namibia RPG Gaming Market (2026-2032)
- Mozambique RPG Gaming Market (2026-2032)
- Montenegro RPG Gaming Market (2026-2032)
- Mongolia RPG Gaming Market (2026-2032)
- Monaco RPG Gaming Market (2026-2032)
- Micronesia RPG Gaming Market (2026-2032)
Industry Events and Analyst Meet

HIMTEX 2026

India Refining Summit 2026

India EV Show 2026

EV tech India Expo 2026

Auto Tech Asia 2026
Whitepaper
- Middle East & Africa Commercial Security Market Click here to view more.
- Middle East & Africa Fire Safety Systems & Equipment Market Click here to view more.
- GCC Drone Market Click here to view more.
- Middle East Lighting Fixture Market Click here to view more.
- GCC Physical & Perimeter Security Market Click here to view more.