Myanmar Coal Based Activated Carbon Market (2026-2032) Outlook | Companies, Trends, Growth, Value, Industry, Revenue, Analysis, Size, Share & Forecast
Market Forecast By Product (Granular, Powdered, Others), By End-Use (Water Treatment, Food & Beverage Processing, Pharmaceutical & Medical, Automotive, Air Purification, Others) And Competitive Landscape
| Product Code: ETC273934 | Publication Date: Aug 2022 | Updated Date: Jul 2026 | Product Type: Market Research Report | |
| Publisher: 6Wresearch | Author: Ravi Bhandari | No. of Pages: 75 | No. of Figures: 35 | No. of Tables: 20 |
Myanmar Coal Based Activated Carbon Market Size, Share & Growth Rate
The Myanmar Coal Based Activated Carbon Market was estimated at USD 155 Million in 2025 and is projected to reach USD 202 Million by 2032, growing at a CAGR of 3.9% from 2026 to 2032. This growth trajectory is primarily driven by the increasing industrialization in Myanmar, which is fueling demand for effective air and water purification solutions. As industries become more aware of environmental sustainability, the reliance on coal-based activated carbon for pollution control is anticipated to escalate in the coming years.
Myanmar Coal Based Activated Carbon Market Year-wise Growth Rate and Key Drivers
This graph highlights how the Myanmar Coal Based Activated Carbon Market has steadily grown over the years, supported by major growth factors.
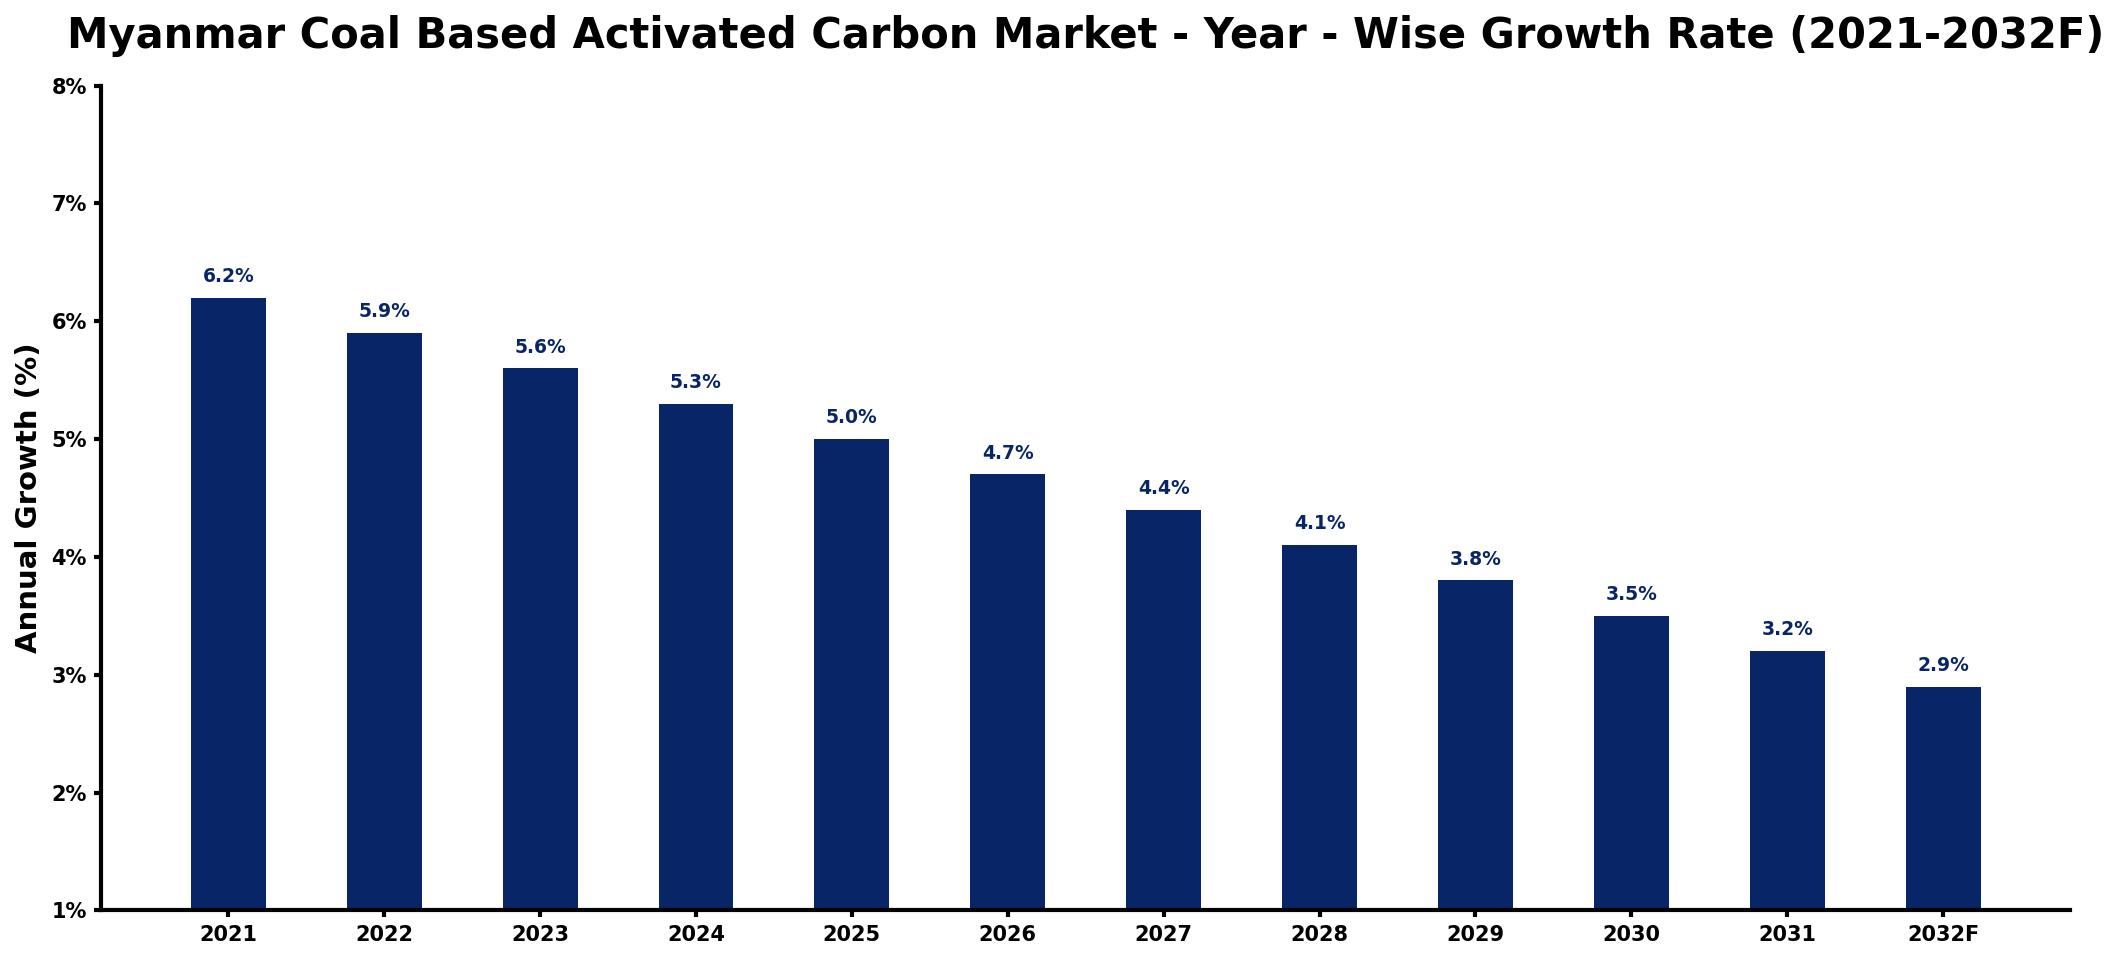
The table below presents the year‑wise growth rates along with the key drivers influencing the market
| Year | Growth Rate | Major Drivers |
| 2021 | 6.2% | Rising industrial filtration requirements |
| 2022 | 5.9% | Increased environmental regulations compliance |
| 2023 | 5.6% | Growing demand in water treatment |
| 2024 | 5.3% | Expansion of manufacturing sectors |
| 2025 | 5.0% | Surge in air pollution control |
| 2026 | 4.7% | Investments in renewable energy projects |
| 2027 | 4.4% | Higher consumer awareness awareness levels |
| 2028 | 4.1% | Demand from pharmaceutical industries |
| 2029 | 3.8% | Growth in food processing applications |
| 2030 | 3.5% | Emerging markets seeking sustainable solutions |
| 2031 | 3.2% | Technological advancements in production |
| 2032 | 2.9% | Focus on waste management solutions |
Note: Market size estimations and growth projections presented in this report are based on 6Wresearch's proprietary forecasting methodology, utilizing the latest available industry data, government publications, and primary research inputs.
Myanmar Coal Based Activated Carbon Market Synopsis
In Myanmar, the coal-based activated carbon market is experiencing a notable expansion due to a heightened awareness of environmental pollution. Industries across the spectrum are integrating activated carbon into their processes, recognizing its vital role in achieving cleaner air and water standards.
The commitment to improving environmental quality, paired with more stringent regulations, is reshaping how businesses in Myanmar operate. This evolving landscape presents both challenges and opportunities, particularly for stakeholders aiming to align with eco-friendly practices while meeting market demands.
Myanmar Coal Based Activated Carbon Market Key Takeaways
- The market is driven by increasing demand in water treatment, air purification, and gold recovery applications.
- Stricter environmental regulations are influencing production and operational practices across industries.
- Potential threats arise from shifting preferences toward renewable alternatives.
- Government policies are evolving to support sustainable practices within the activated carbon industry.
- Investments in cleaner technologies may redefine market dynamics in the coming years.
Evaluation of Restraints in Myanmar Coal Based Activated Carbon Market
While the Myanmar Coal Based Activated Carbon market shows promise, it is not without its restraints. The increasing global emphasis on sustainability and environmental protection raises concerns regarding the long-term viability of coal-based products. Regulatory pressures are becoming more intense, which can lead to higher operational costs for producers. These dynamics create a challenging environment, particularly for companies that may not yet have adapted to the evolving market landscape. Furthermore, the necessity for compliance with rigorous environmental standards can hinder operational efficiencies, thereby impacting profit margins.
Myanmar Coal Based Activated Carbon Market Trends
Current trends indicate a robust focus on integrating advanced technologies in the production of coal-based activated carbon. Innovations aimed at enhancing adsorption capacities and reducing impurities are gaining traction. Moreover, companies are exploring alternative sourcing methods that comply with emerging sustainability standards, ensuring their products meet both market and regulatory demands. As industries push towards sustainable solutions, the trend towards research and development in this sector will likely accelerate, shaping future offerings.
Myanmar Coal Based Activated Carbon Market Opportunities
The market for coal-based activated carbon in Myanmar is ripe with opportunities for growth and investment. As industries continue to prioritize environmental sustainability, there exists a significant demand for innovative filtration solutions that incorporate activated carbon. Furthermore, the potential for export markets can be tapped into, especially for high-quality activated carbon products. With the right strategic partnerships and investments in technology, stakeholders can position themselves favorably within this expanding landscape.
Government Initiatives in the Myanmar Coal Based Activated Carbon Market
Government policies in Myanmar are increasingly recognizing the importance of environmental conservation, which includes regulations specific to the coal-based activated carbon sector. Initiatives promoting cleaner production technologies and sustainable practices are becoming more prevalent. The government aims to strike a balance between economic development and environmental protection, encouraging industries to adopt compliance measures that reduce their ecological footprint. Incentives for businesses implementing greener technologies could significantly shape the future dynamics of this market.
Future Insights of the Myanmar Coal Based Activated Carbon Market
Looking ahead to the period from 2026 to 2032, the Myanmar Coal Based Activated Carbon market is expected to continue evolving in response to both local and global trends. The trajectory towards more stringent environmental regulations will push industries to innovate while also navigating compliance challenges. As coal-based activated carbon remains crucial for effective filtration and purification processes, the focus will likely shift towards improving product quality and sustainability practices. Stakeholders who adapt quickly to these changes will find significant growth opportunities.
Myanmar Coal Based Activated Carbon Market Latest Developments (2025 - 2026)
Recent developments in the Myanmar Coal Based Activated Carbon market indicate a growing inclination towards environmentally responsible production methods. Companies are increasingly investing in research to enhance the sustainability of activated carbon manufacturing processes. Furthermore, the government is stepping up its efforts to enforce policies that regulate emissions and waste management, ensuring industries align with global environmental standards. This shift is expected to drive innovation and redefine competitive advantages within the sector.
Myanmar Coal Based Activated Carbon Market - Key Attractiveness of the Report
- 10 Years of Market Numbers
- Historical Data Starting from 2022 to 2025
- Base Year: 2025
- Forecast Data until 2032
- Key Performance Indicators Impacting the Market
- Major Upcoming Developments and Projects
Key Highlights of the Report:
- Myanmar Coal Based Activated Carbon Market Outlook
- Market Size of Myanmar Coal Based Activated Carbon Market, 2025
- Forecast of Myanmar Coal Based Activated Carbon Market, 2032
- Historical Data and Forecast of Myanmar Coal Based Activated Carbon Revenues & Volume for the Period 2022-2032F
- Myanmar Coal Based Activated Carbon Market Trend Evolution
- Myanmar Coal Based Activated Carbon Market Drivers and Challenges
- Myanmar Coal Based Activated Carbon Price Trends
- Myanmar Coal Based Activated Carbon Porter's Five Forces
- Myanmar Coal Based Activated Carbon Industry Life Cycle
- Historical Data and Forecast of Myanmar Coal Based Activated Carbon Market Revenues & Volume By Product for the Period 2022-2032F
- Historical Data and Forecast of Myanmar Coal Based Activated Carbon Market Revenues & Volume By Granular for the Period 2022-2032F
- Historical Data and Forecast of Myanmar Coal Based Activated Carbon Market Revenues & Volume By Powdered for the Period 2022-2032F
- Historical Data and Forecast of Myanmar Coal Based Activated Carbon Market Revenues & Volume By Others for the Period 2022-2032F
- Historical Data and Forecast of Myanmar Coal Based Activated Carbon Market Revenues & Volume By End-Use for the Period 2022-2032F
- Historical Data and Forecast of Myanmar Coal Based Activated Carbon Market Revenues & Volume By Water Treatment for the Period 2022-2032F
- Historical Data and Forecast of Myanmar Coal Based Activated Carbon Market Revenues & Volume By Food & Beverage Processing for the Period 2022-2032F
- Historical Data and Forecast of Myanmar Coal Based Activated Carbon Market Revenues & Volume By Pharmaceutical & Medical for the Period 2022-2032F
- Historical Data and Forecast of Myanmar Coal Based Activated Carbon Market Revenues & Volume By Automotive for the Period 2022-2032F
- Historical Data and Forecast of Myanmar Coal Based Activated Carbon Market Revenues & Volume By Air Purification for the Period 2022-2032F
- Historical Data and Forecast of Myanmar Coal Based Activated Carbon Market Revenues & Volume By Others for the Period 2022-2032F
- Myanmar Coal Based Activated Carbon Import Export Trade Statistics
- Market Opportunity Assessment By Product
- Market Opportunity Assessment By End-Use
- Myanmar Coal Based Activated Carbon Top Companies Market Share
- Myanmar Coal Based Activated Carbon Competitive Benchmarking By Technical and Operational Parameters
- Myanmar Coal Based Activated Carbon Company Profiles
- Myanmar Coal Based Activated Carbon Key Strategic Recommendations
Frequently Asked Questions About the Market Study (FAQs):
Key factors include rising industrialization, increased awareness of environmental issues, and stringent pollution control regulations that necessitate the use of effective filtration solutions.
The Myanmar Coal Based Activated Carbon Market was estimated at USD 155 Million in 2025 and is projected to reach USD 202 Million by 2032, growing at a CAGR of 3.9% from 2026 to 2032.
Government policies are crucial in establishing environmental regulations that influence production methods and drive the adoption of sustainable practices across industries.
Major applications include water treatment, air purification, and in the gold recovery industry, highlighting its versatility across various sectors.
Future trends are likely to focus on technological advancements in production, increased emphasis on sustainability, and a gradual shift towards innovative filtration solutions that comply with emerging environmental regulations.
6Wresearch actively monitors the Myanmar Coal Based Activated Carbon Market and publishes its comprehensive annual report, highlighting emerging trends, growth drivers, revenue analysis, and forecast outlook. Our insights help businesses to make data-backed strategic decisions with ongoing market dynamics. Our analysts track relevent industries related to the Myanmar Coal Based Activated Carbon Market, allowing our clients with actionable intelligence and reliable forecasts tailored to emerging regional needs.
Yes, we provide customisation as per your requirements. To learn more, feel free to contact us on sales@6wresearch.com
1 Executive Summary |
2 Introduction |
2.1 Key Highlights of the Report |
2.2 Report Description |
2.3 Market Scope & Segmentation |
2.4 Research Methodology |
2.5 Assumptions |
3 Myanmar Coal Based Activated Carbon Market Overview |
3.1 Myanmar Country Macro Economic Indicators |
3.2 Myanmar Coal Based Activated Carbon Market Revenues & Volume, 2022 & 2032F |
3.3 Myanmar Coal Based Activated Carbon Market - Industry Life Cycle |
3.4 Myanmar Coal Based Activated Carbon Market - Porter's Five Forces |
3.5 Myanmar Coal Based Activated Carbon Market Revenues & Volume Share, By Product, 2022 & 2032F |
3.6 Myanmar Coal Based Activated Carbon Market Revenues & Volume Share, By End-Use, 2022 & 2032F |
4 Myanmar Coal Based Activated Carbon Market Dynamics |
4.1 Impact Analysis |
4.2 Market Drivers |
4.2.1 Increasing awareness about environmental pollution and the need for water and air purification solutions |
4.2.2 Growing industrialization and urbanization leading to higher demand for activated carbon in various applications |
4.2.3 Rising investments in water treatment plants and air filtration systems |
4.3 Market Restraints |
4.3.1 Fluctuating coal prices impacting production costs of coal-based activated carbon |
4.3.2 Stringent environmental regulations and policies affecting the manufacturing and usage of activated carbon |
4.3.3 Competition from alternative purification technologies such as UV disinfection and ion exchange |
5 Myanmar Coal Based Activated Carbon Market Trends |
6 Myanmar Coal Based Activated Carbon Market, By Types |
6.1 Myanmar Coal Based Activated Carbon Market, By Product |
6.1.1 Overview and Analysis |
6.1.2 Myanmar Coal Based Activated Carbon Market Revenues & Volume, By Product, 2022-2032F |
6.1.3 Myanmar Coal Based Activated Carbon Market Revenues & Volume, By Granular, 2022-2032F |
6.1.4 Myanmar Coal Based Activated Carbon Market Revenues & Volume, By Powdered, 2022-2032F |
6.1.5 Myanmar Coal Based Activated Carbon Market Revenues & Volume, By Others, 2022-2032F |
6.2 Myanmar Coal Based Activated Carbon Market, By End-Use |
6.2.1 Overview and Analysis |
6.2.2 Myanmar Coal Based Activated Carbon Market Revenues & Volume, By Water Treatment, 2022-2032F |
6.2.3 Myanmar Coal Based Activated Carbon Market Revenues & Volume, By Food & Beverage Processing, 2022-2032F |
6.2.4 Myanmar Coal Based Activated Carbon Market Revenues & Volume, By Pharmaceutical & Medical, 2022-2032F |
6.2.5 Myanmar Coal Based Activated Carbon Market Revenues & Volume, By Automotive, 2022-2032F |
6.2.6 Myanmar Coal Based Activated Carbon Market Revenues & Volume, By Air Purification, 2022-2032F |
6.2.7 Myanmar Coal Based Activated Carbon Market Revenues & Volume, By Others, 2022-2032F |
7 Myanmar Coal Based Activated Carbon Market Import-Export Trade Statistics |
7.1 Myanmar Coal Based Activated Carbon Market Export to Major Countries |
7.2 Myanmar Coal Based Activated Carbon Market Imports from Major Countries |
8 Myanmar Coal Based Activated Carbon Market Key Performance Indicators |
8.1 Average selling price (ASP) of coal-based activated carbon |
8.2 Capacity utilization rate of coal-based activated carbon manufacturers |
8.3 Adoption rate of coal-based activated carbon in key end-user industries |
9 Myanmar Coal Based Activated Carbon Market - Opportunity Assessment |
9.1 Myanmar Coal Based Activated Carbon Market Opportunity Assessment, By Product, 2022 & 2032F |
9.2 Myanmar Coal Based Activated Carbon Market Opportunity Assessment, By End-Use, 2022 & 2032F |
10 Myanmar Coal Based Activated Carbon Market - Competitive Landscape |
10.1 Myanmar Coal Based Activated Carbon Market Revenue Share, By Companies, 2025 |
10.2 Myanmar Coal Based Activated Carbon Market Competitive Benchmarking, By Operating and Technical Parameters |
11 Company Profiles |
12 Recommendations |
13 Disclaimer |
Global Go To Market Strategy - 2030
Export potential enables firms to identify high-growth global markets with greater confidence by combining advanced trade intelligence with a structured quantitative methodology. The framework analyzes emerging demand trends and country-level import patterns while integrating macroeconomic and trade datasets such as GDP and population forecasts, bilateral import–export flows, tariff structures, elasticity differentials between developed and developing economies, geographic distance, and import demand projections. Using weighted trade values from 2020–2024 as the base period to project country-to-country export potential for 2030, these inputs are operationalized through calculated drivers such as gravity model parameters, tariff impact factors, and projected GDP per-capita growth. Through an analysis of hidden potentials, demand hotspots, and market conditions that are most favorable to success, this method enables firms to focus on target countries, maximize returns, and global expansion with data, backed by accuracy.
By factoring in the projected importer demand gap that is currently unmet and could be potential opportunity, it identifies the potential for the Exporter (Country) among 190 countries, against the general trade analysis, which identifies the biggest importer or exporter.
To discover high-growth global markets and optimize your business strategy:
Click Here
Pricing
- Single User License$ 1,995
- Department License$ 2,400
- Site License$ 3,120
- Global License$ 3,795

Leadership Perspectives from Industry Events
Search
Thought Leadership and Analyst Meet


Our Clients
6WResearch In News
- India Air Conditioner Market Set for Strong Rebound in 2026 After Weather-Led Correction and GST-Driven Recovery: 6Wresearch
- ADAS in India: How Automatic Emergency Braking, Blind Spot Detection & Driver Monitoring are Transforming Road Safety
- Doha a strategic location for EV manufacturing hub: IPA Qatar
- Demand for luxury TVs surging in the GCC, says Samsung
- Empowering Growth: The Thriving Journey of Bangladesh’s Cable Industry
- Demand for luxury TVs surging in the GCC, says Samsung
Latest Reports
- Nicaragua RPG Gaming Market (2026-2032)
- New Zealand RPG Gaming Market (2026-2032)
- Netherlands RPG Gaming Market (2026-2032)
- Nauru RPG Gaming Market (2026-2032)
- Namibia RPG Gaming Market (2026-2032)
- Mozambique RPG Gaming Market (2026-2032)
- Montenegro RPG Gaming Market (2026-2032)
- Mongolia RPG Gaming Market (2026-2032)
- Monaco RPG Gaming Market (2026-2032)
- Micronesia RPG Gaming Market (2026-2032)
Industry Events and Analyst Meet

EV India Expo 2026

HIMTEX 2026

India Refining Summit 2026

India EV Show 2026

EV tech India Expo 2026
Whitepaper
- Middle East & Africa Commercial Security Market Click here to view more.
- Middle East & Africa Fire Safety Systems & Equipment Market Click here to view more.
- GCC Drone Market Click here to view more.
- Middle East Lighting Fixture Market Click here to view more.
- GCC Physical & Perimeter Security Market Click here to view more.