Myanmar Filling Equipment Market (2026-2032) | Value, Forecast, Analysis, Outlook, Growth, Companies, Trends, Revenue, Size, Share & Industry
Market Forecast By Type (Rotary Fillers, Volumetric Fillers, Aseptic Fillers, Net Weight Fillers, Other), By Process (Manual, Semi-Automatic, Automatic), By Applications (Food & Beverage, Pharmaceutical, Cosmetic, Others) And Competitive Landscape
| Product Code: ETC047114 | Publication Date: Jan 2021 | Updated Date: Jun 2026 | Product Type: Report | |
| Publisher: 6Wresearch | Author: Shubham Padhi | No. of Pages: 70 | No. of Figures: 35 | No. of Tables: 5 |
Myanmar Filling Equipment Market Size, Share & Growth Rate
The Myanmar Filling Equipment Market was estimated at USD 379 Million in 2025 and is projected to reach USD 547 Million by 2032, growing at a CAGR of 5.4% from 2026 to 2032. This growth trajectory is largely fueled by the increasing demand across various sectors such as food and beverage, pharmaceuticals, and cosmetics, as manufacturers seek enhanced efficiency and production capabilities. The rising trend of automation, coupled with a growing emphasis on sustainable practices, is further propelling the adoption of advanced filling technologies in the market.
Myanmar Filling Equipment Market Year-wise Growth Rate and Key Drivers
This graph highlights how the Myanmar Filling Equipment Market has steadily grown over the years, supported by major growth factors.
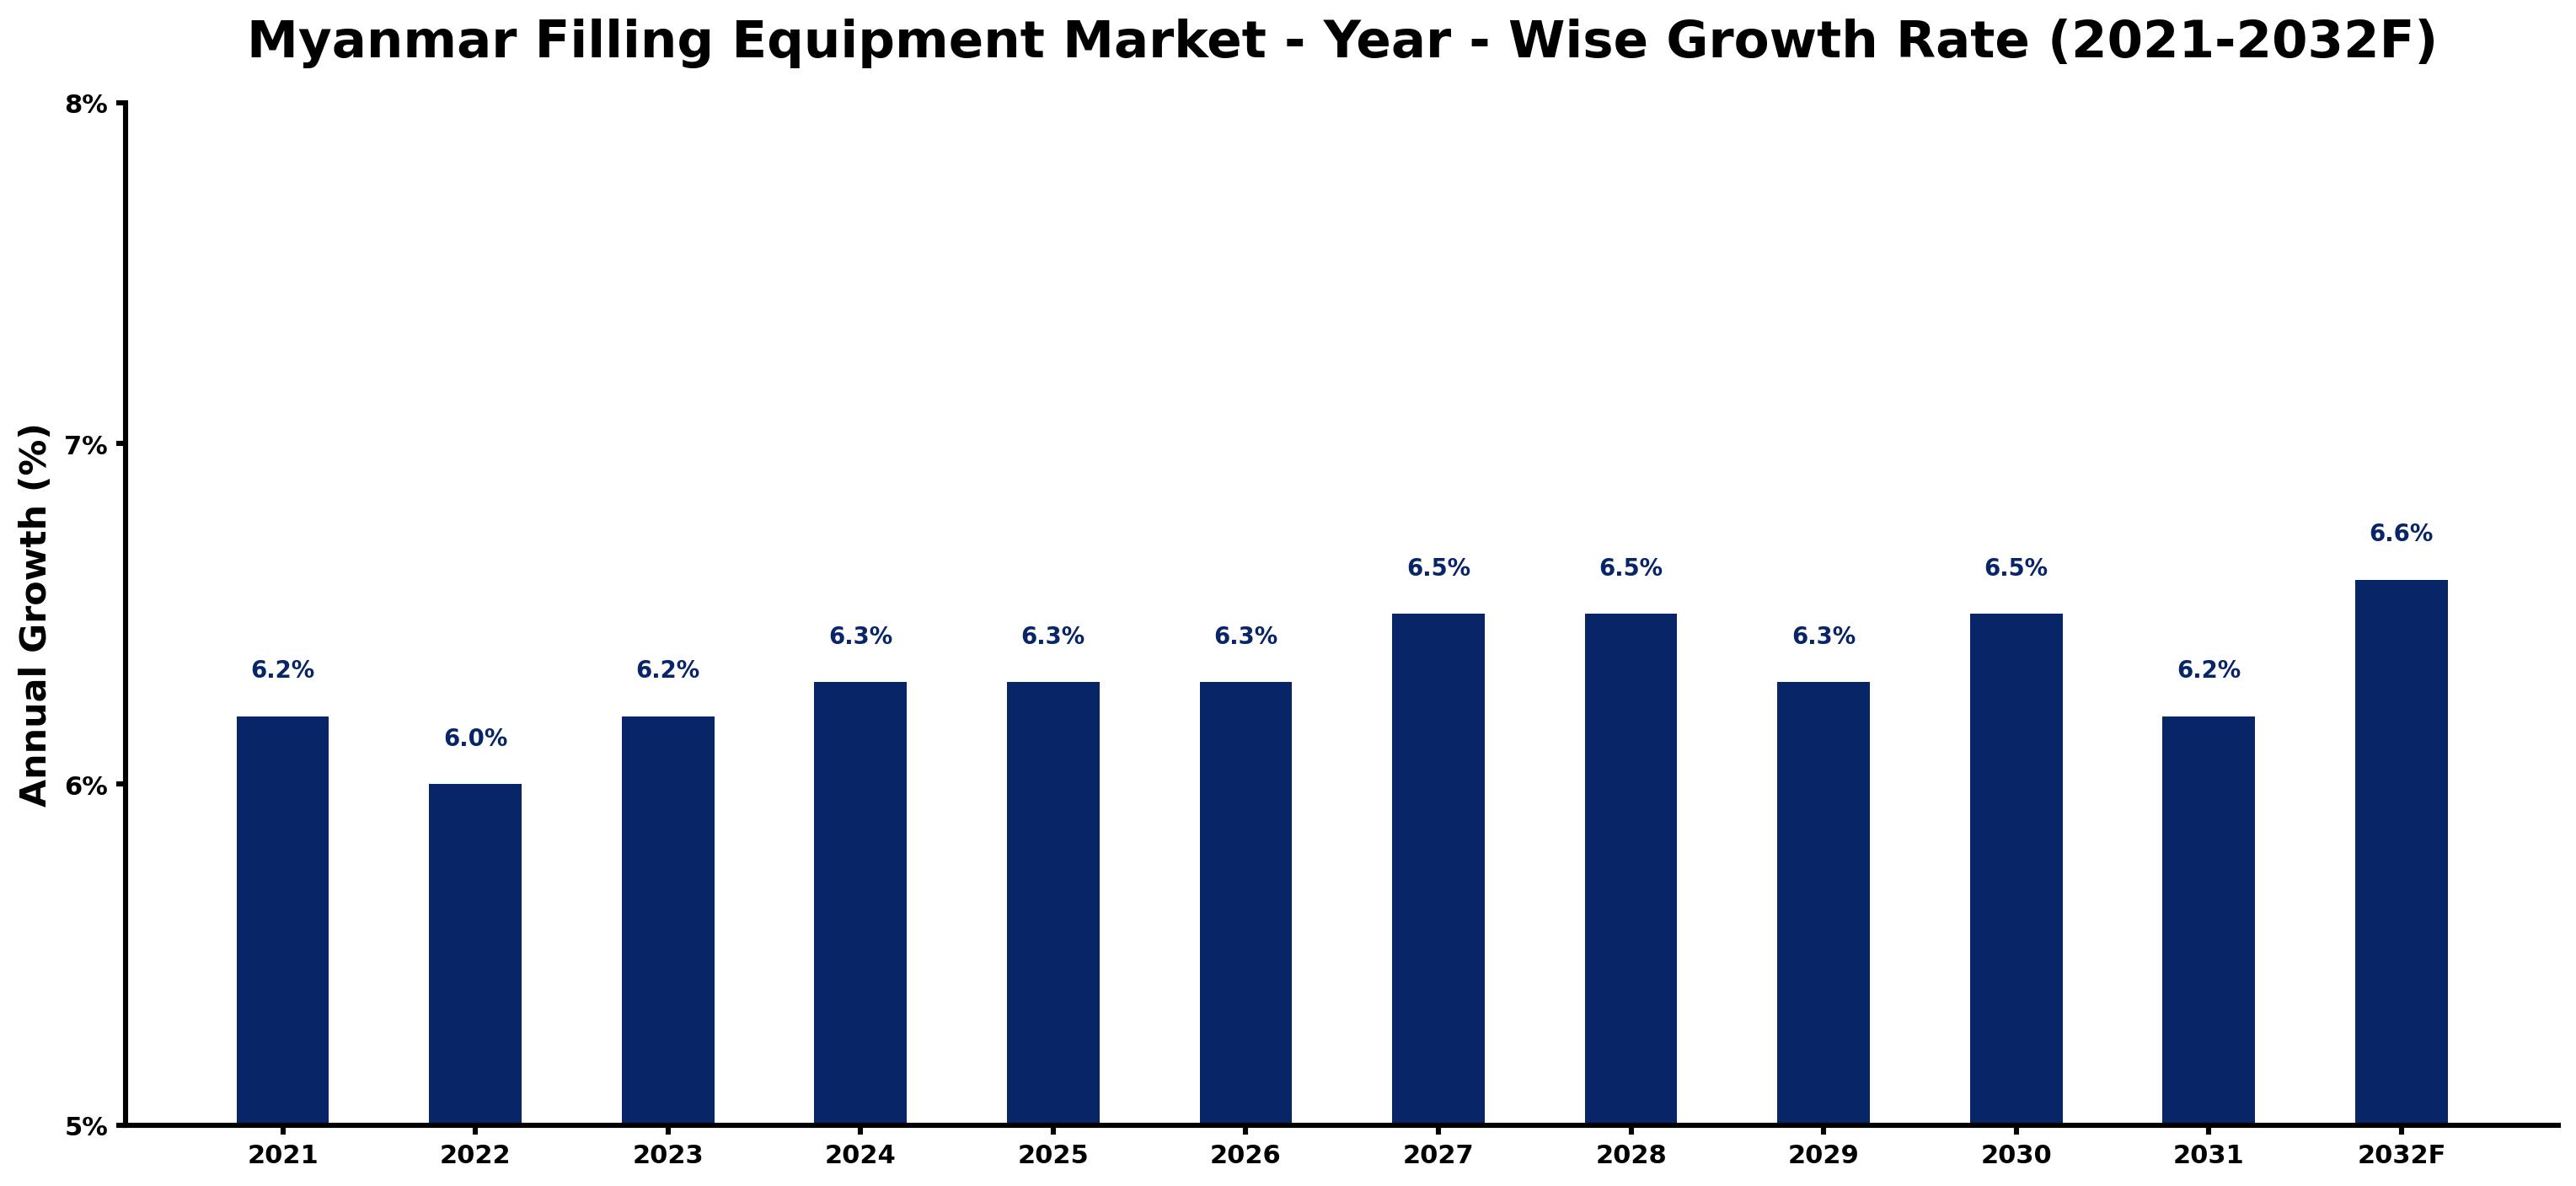
The table below presents the year‑wise growth rates along with the key drivers influencing the market
| Year | Growth Rate | Major Drivers |
| 2021 | 6.2% | Expansion of transportation and logistics networks |
| 2022 | 6.0% | Growing urbanization and commercial development |
| 2023 | 6.2% | Increasing adoption of advanced technologies |
| 2024 | 6.3% | Growing renewable energy integration projects |
| 2025 | 6.3% | Rising electricity demand across industries |
| 2026 | 6.3% | Expansion of transportation and logistics networks |
| 2027 | 6.5% | Expansion of transportation and logistics networks |
| 2028 | 6.5% | Growing urbanization and commercial development |
| 2029 | 6.3% | Rising electricity demand across industries |
| 2030 | 6.5% | Increasing adoption of advanced technologies |
| 2031 | 6.2% | Increasing smart city development projects |
| 2032 | 6.6% | Increasing adoption of advanced technologies |
Note - Market size estimations and growth projections presented in this report are based on 6Wresearch’s advanced forecasting approach, validated with industry datasets as of June 2026.
Myanmar Filling Equipment Market Synopsis
The rise in consumer preference for packaged goods is creating substantial demand for efficient filling solutions in Myanmar. As local industries strive to meet the evolving consumer habits, the necessity for high-quality, innovative filling equipment is becoming increasingly evident.
The market is also characterized by a surge in automation initiatives aimed at improving operational productivity. This shift towards advanced filling technologies is not only enhancing manufacturing capabilities but is also supporting local players in aligning with global standards for quality and safety.
Myanmar Filling Equipment Market Key Takeaways
- The market is benefiting from rising investments in the food and beverage sector.
- Automation and smart technologies are becoming critical components of filling operations.
- Local and international manufacturers are introducing innovative solutions to address market needs.
- Government policies are fostering an environment conducive to industrial growth.
- There is a growing emphasis on sustainable and eco-friendly filling solutions.
Evaluation of Restraints in Myanmar Filling Equipment Market
The Myanmar filling equipment market faces several constraints that could impede its growth. Outdated machinery remains a significant barrier, as many local manufacturers struggle with inefficient processes. This technological lag, combined with a limited pool of skilled labor, hinders efforts to modernize production capabilities. Furthermore, infrastructure challenges, including inconsistent power supply, complicate operational reliability. Compliance with regulatory requirements also demands careful navigation, as these can add layers of complexity for businesses aiming to innovate and expand.
Myanmar Filling Equipment Market Trends
The market is increasingly influenced by the demand for automated and semi-automated filling equipment, driven by the need for enhanced efficiency. There’s a notable trend towards flexible equipment capable of handling various container sizes and materials, allowing manufacturers to adapt to diverse product lines. Additionally, the integration of IoT and Industry 4.0 principles is emerging, enabling real-time monitoring and data analytics that support smarter operational decisions.
Myanmar Filling Equipment Market Opportunities
Investors have ample opportunity to engage in the Myanmar filling equipment market, particularly given the rise in consumer purchasing power and modern retail formats. The demand for innovative filling solutions to efficiently meet production demands across beverages, pharmaceuticals, and cosmetics offers fertile ground for investment. Customized solutions, coupled with strong after-sales service offerings, will be key in building long-term partnerships with local manufacturers seeking to enhance their production capabilities.
Government Initiatives in the Myanmar Filling Equipment Market
The Myanmar government is actively promoting industrial development through various policies aimed at improving product quality and safety standards in the filling equipment market. These regulations ensure that equipment adheres to international certifications, thereby enhancing consumer safety and maintaining fair trade practices. By establishing a conducive environment for foreign investment, the government is keen on bolstering local industries while ensuring compliance with global market requirements.
Future Insights of the Myanmar Filling Equipment Market
As we look ahead to 2026-2032, the Myanmar filling equipment market is set to benefit from favorable economic conditions, increased investments, and ongoing infrastructure improvements. The growing focus on automation and innovative technologies will drive demand for advanced filling solutions. However, businesses must be prepared to navigate the landscape of high initial investment costs and the need for technological upgrades. Overall, the outlook remains optimistic as the market continues to adapt to evolving industrial needs.
Myanmar Filling Equipment Market Latest Developments (May 2025 - June 2026)
Recently, the Myanmar filling equipment market has seen a shift towards integrating smart technologies that enhance operational efficiency and data analytics. Manufacturers are increasingly focused on developing eco-friendly filling solutions to meet both regulatory standards and consumer preferences. Additionally, there is a concerted effort among local players to upgrade their machinery to align with international best practices, thereby improving their competitive positioning in the market.
Myanmar Filling Equipment Market - Key Attractiveness of the Report
- 10 Years of Market Numbers
- Historical Data Starting from 2022 to 2025
- Base Year: 2025
- Forecast Data until 2032
- Key Performance Indicators Impacting the Market
- Major Upcoming Developments and Projects
Key Highlights of the Report:
- Myanmar Filling Equipment Market Outlook
- Market Size of Myanmar Filling Equipment Market, 2025
- Forecast of Myanmar Filling Equipment Market, 2032
- Historical Data and Forecast of Myanmar Filling Equipment Revenues & Volume for the Period 2022-2032F
- Myanmar Filling Equipment Market Trend Evolution
- Myanmar Filling Equipment Market Drivers and Challenges
- Myanmar Filling Equipment Price Trends
- Myanmar Filling Equipment Porter's Five Forces
- Myanmar Filling Equipment Industry Life Cycle
- Historical Data and Forecast of Myanmar Filling Equipment Market Revenues & Volume By Type for the Period 2022-2032F
- Historical Data and Forecast of Myanmar Filling Equipment Market Revenues & Volume By Rotary Fillers for the Period 2022-2032F
- Historical Data and Forecast of Myanmar Filling Equipment Market Revenues & Volume By Volumetric Fillers for the Period 2022-2032F
- Historical Data and Forecast of Myanmar Filling Equipment Market Revenues & Volume By Aseptic Fillers for the Period 2022-2032F
- Historical Data and Forecast of Myanmar Filling Equipment Market Revenues & Volume By Net Weight Fillers for the Period 2022-2032F
- Historical Data and Forecast of Myanmar Filling Equipment Market Revenues & Volume By Other for the Period 2022-2032F
- Historical Data and Forecast of Myanmar Filling Equipment Market Revenues & Volume By Process for the Period 2022-2032F
- Historical Data and Forecast of Myanmar Filling Equipment Market Revenues & Volume By Manual for the Period 2022-2032F
- Historical Data and Forecast of Myanmar Filling Equipment Market Revenues & Volume By Semi-Automatic for the Period 2022-2032F
- Historical Data and Forecast of Myanmar Filling Equipment Market Revenues & Volume By Automatic for the Period 2022-2032F
- Historical Data and Forecast of Myanmar Filling Equipment Market Revenues & Volume By Applications for the Period 2022-2032F
- Historical Data and Forecast of Myanmar Filling Equipment Market Revenues & Volume By Food & Beverage for the Period 2022-2032F
- Historical Data and Forecast of Myanmar Filling Equipment Market Revenues & Volume By Pharmaceutical for the Period 2022-2032F
- Historical Data and Forecast of Myanmar Filling Equipment Market Revenues & Volume By Cosmetic for the Period 2022-2032F
- Historical Data and Forecast of Myanmar Filling Equipment Market Revenues & Volume By Others for the Period 2022-2032F
- Myanmar Filling Equipment Import Export Trade Statistics
- Market Opportunity Assessment By Type
- Market Opportunity Assessment By Process
- Market Opportunity Assessment By Applications
- Myanmar Filling Equipment Top Companies Market Share
- Myanmar Filling Equipment Competitive Benchmarking By Technical and Operational Parameters
- Myanmar Filling Equipment Company Profiles
- Myanmar Filling Equipment Key Strategic Recommendations
Myanmar Filling Equipment Market - Frequently Asked Questions
The Myanmar Filling Equipment Market is projected to reach USD 547 Million by 2032, growing at a CAGR of 5.4% from an estimated USD 379 Million in 2025.
Automation is significantly enhancing operational efficiency, allowing manufacturers to optimize their production processes while addressing the rising demand for packaged goods.
Many local manufacturers contend with outdated machinery, limited access to skilled labor, and inadequate infrastructure, which hinder their competitiveness in the market.
Government policies are promoting safety and quality standards while encouraging foreign investments, which bolster local industries and align them with global practices.
Key trends include a focus on automation, the development of flexible filling equipment, and the integration of smart technologies such as IoT for enhanced operational insights.
6Wresearch actively monitors the Myanmar Filling Equipment Market and publishes its comprehensive annual report, highlighting emerging trends, growth drivers, revenue analysis, and forecast outlook. Our insights help businesses to make data-backed strategic decisions with ongoing market dynamics. Our analysts track relevent industries related to the Myanmar Filling Equipment Market, allowing our clients with actionable intelligence and reliable forecasts tailored to emerging regional needs.
Yes, we provide customisation as per your requirements. To learn more, feel free to contact us on sales@6wresearch.com
1 Executive Summary |
2 Introduction |
2.1 Key Highlights of the Report |
2.2 Report Description |
2.3 Market Scope & Segmentation |
2.4 Research Methodology |
2.5 Assumptions |
3 Myanmar Filling Equipment Market Overview |
3.1 Myanmar Country Macro Economic Indicators |
3.2 Myanmar Filling Equipment Market Revenues & Volume, 2022 & 2032F |
3.3 Myanmar Filling Equipment Market - Industry Life Cycle |
3.4 Myanmar Filling Equipment Market - Porter's Five Forces |
3.5 Myanmar Filling Equipment Market Revenues & Volume Share, By Type, 2022 & 2032F |
3.6 Myanmar Filling Equipment Market Revenues & Volume Share, By Process, 2022 & 2032F |
3.7 Myanmar Filling Equipment Market Revenues & Volume Share, By Applications, 2022 & 2032F |
4 Myanmar Filling Equipment Market Dynamics |
4.1 Impact Analysis |
4.2 Market Drivers |
4.3 Market Restraints |
5 Myanmar Filling Equipment Market Trends |
6 Myanmar Filling Equipment Market, By Types |
6.1 Myanmar Filling Equipment Market, By Type |
6.1.1 Overview and Analysis |
6.1.2 Myanmar Filling Equipment Market Revenues & Volume, By Type, 2022-2032F |
6.1.3 Myanmar Filling Equipment Market Revenues & Volume, By Rotary Fillers, 2022-2032F |
6.1.4 Myanmar Filling Equipment Market Revenues & Volume, By Volumetric Fillers, 2022-2032F |
6.1.5 Myanmar Filling Equipment Market Revenues & Volume, By Aseptic Fillers, 2022-2032F |
6.1.6 Myanmar Filling Equipment Market Revenues & Volume, By Net Weight Fillers, 2022-2032F |
6.1.7 Myanmar Filling Equipment Market Revenues & Volume, By Other, 2022-2032F |
6.2 Myanmar Filling Equipment Market, By Process |
6.2.1 Overview and Analysis |
6.2.2 Myanmar Filling Equipment Market Revenues & Volume, By Manual, 2022-2032F |
6.2.3 Myanmar Filling Equipment Market Revenues & Volume, By Semi-Automatic, 2022-2032F |
6.2.4 Myanmar Filling Equipment Market Revenues & Volume, By Automatic, 2022-2032F |
6.3 Myanmar Filling Equipment Market, By Applications |
6.3.1 Overview and Analysis |
6.3.2 Myanmar Filling Equipment Market Revenues & Volume, By Food & Beverage, 2022-2032F |
6.3.3 Myanmar Filling Equipment Market Revenues & Volume, By Pharmaceutical, 2022-2032F |
6.3.4 Myanmar Filling Equipment Market Revenues & Volume, By Cosmetic, 2022-2032F |
6.3.5 Myanmar Filling Equipment Market Revenues & Volume, By Others, 2022-2032F |
7 Myanmar Filling Equipment Market Import-Export Trade Statistics |
7.1 Myanmar Filling Equipment Market Export to Major Countries |
7.2 Myanmar Filling Equipment Market Imports from Major Countries |
8 Myanmar Filling Equipment Market Key Performance Indicators |
9 Myanmar Filling Equipment Market - Opportunity Assessment |
9.1 Myanmar Filling Equipment Market Opportunity Assessment, By Type, 2022 & 2032F |
9.2 Myanmar Filling Equipment Market Opportunity Assessment, By Process, 2022 & 2032F |
9.3 Myanmar Filling Equipment Market Opportunity Assessment, By Applications, 2022 & 2032F |
10 Myanmar Filling Equipment Market - Competitive Landscape |
10.1 Myanmar Filling Equipment Market Revenue Share, By Companies, 2025 |
10.2 Myanmar Filling Equipment Market Competitive Benchmarking, By Operating and Technical Parameters |
11 Company Profiles |
12 Recommendations |
13 Disclaimer |
Global Go To Market Strategy - 2030
Export potential enables firms to identify high-growth global markets with greater confidence by combining advanced trade intelligence with a structured quantitative methodology. The framework analyzes emerging demand trends and country-level import patterns while integrating macroeconomic and trade datasets such as GDP and population forecasts, bilateral import–export flows, tariff structures, elasticity differentials between developed and developing economies, geographic distance, and import demand projections. Using weighted trade values from 2020–2024 as the base period to project country-to-country export potential for 2030, these inputs are operationalized through calculated drivers such as gravity model parameters, tariff impact factors, and projected GDP per-capita growth. Through an analysis of hidden potentials, demand hotspots, and market conditions that are most favorable to success, this method enables firms to focus on target countries, maximize returns, and global expansion with data, backed by accuracy.
By factoring in the projected importer demand gap that is currently unmet and could be potential opportunity, it identifies the potential for the Exporter (Country) among 190 countries, against the general trade analysis, which identifies the biggest importer or exporter.
To discover high-growth global markets and optimize your business strategy:
Click Here
Pricing
- Single User License$ 1,995
- Department License$ 2,400
- Site License$ 3,120
- Global License$ 3,795

Leadership Perspectives from Industry Events
Search
Thought Leadership and Analyst Meet


Our Clients
6WResearch In News
- India Air Conditioner Market Set for Strong Rebound in 2026 After Weather-Led Correction and GST-Driven Recovery: 6Wresearch
- ADAS in India: How Automatic Emergency Braking, Blind Spot Detection & Driver Monitoring are Transforming Road Safety
- Doha a strategic location for EV manufacturing hub: IPA Qatar
- Demand for luxury TVs surging in the GCC, says Samsung
- Empowering Growth: The Thriving Journey of Bangladesh’s Cable Industry
- Demand for luxury TVs surging in the GCC, says Samsung
Latest Reports
- Nicaragua RPG Gaming Market (2026-2032)
- New Zealand RPG Gaming Market (2026-2032)
- Netherlands RPG Gaming Market (2026-2032)
- Nauru RPG Gaming Market (2026-2032)
- Namibia RPG Gaming Market (2026-2032)
- Mozambique RPG Gaming Market (2026-2032)
- Montenegro RPG Gaming Market (2026-2032)
- Mongolia RPG Gaming Market (2026-2032)
- Monaco RPG Gaming Market (2026-2032)
- Micronesia RPG Gaming Market (2026-2032)
Industry Events and Analyst Meet

EV India Expo 2026

HIMTEX 2026

India Refining Summit 2026

India EV Show 2026

EV tech India Expo 2026
Whitepaper
- Middle East & Africa Commercial Security Market Click here to view more.
- Middle East & Africa Fire Safety Systems & Equipment Market Click here to view more.
- GCC Drone Market Click here to view more.
- Middle East Lighting Fixture Market Click here to view more.
- GCC Physical & Perimeter Security Market Click here to view more.