Myanmar Glass Reinforced Plastic Market (2026-2032) Outlook | Value, Growth, Companies, Revenue, Size, Analysis, Industry, Forecast, Share & Trends
Market Forecast By Type (Epoxy, Polyester, Vinyl Ester, Polyurethane, Others), By Method (Moulding Method, Pultrusion Method, Layup, Others), By Application (Pipes and Tanks, Wind Power Turbines, Storage Containers, Roofs, Floor Gratings, Steps and Stairs, Switch Actuators, Others), By End-Use (Building and Construction, Transportation, Electrical and Electronics, Oil and Gas, Mining, Water and Wastewater, Others) And Competitive Landscape
| Product Code: ETC264094 | Publication Date: Aug 2022 | Updated Date: Jul 2026 | Product Type: Market Research Report | |
| Publisher: 6Wresearch | Author: Sumit Sagar | No. of Pages: 75 | No. of Figures: 35 | No. of Tables: 20 |
Myanmar Glass Reinforced Plastic Market Size, Share & Growth Rate
The Myanmar Glass Reinforced Plastic Market was estimated at USD 188 Million in 2025 and is projected to reach USD 262 Million by 2032, growing at a CAGR of 4.9% from 2026 to 2032. This growth trajectory is largely fueled by the country's ongoing infrastructure projects and rising demand for lightweight yet durable materials in the construction and automotive sectors. Additionally, the increasing adoption of sustainable practices further enhances the appeal of GRP products across various industries.
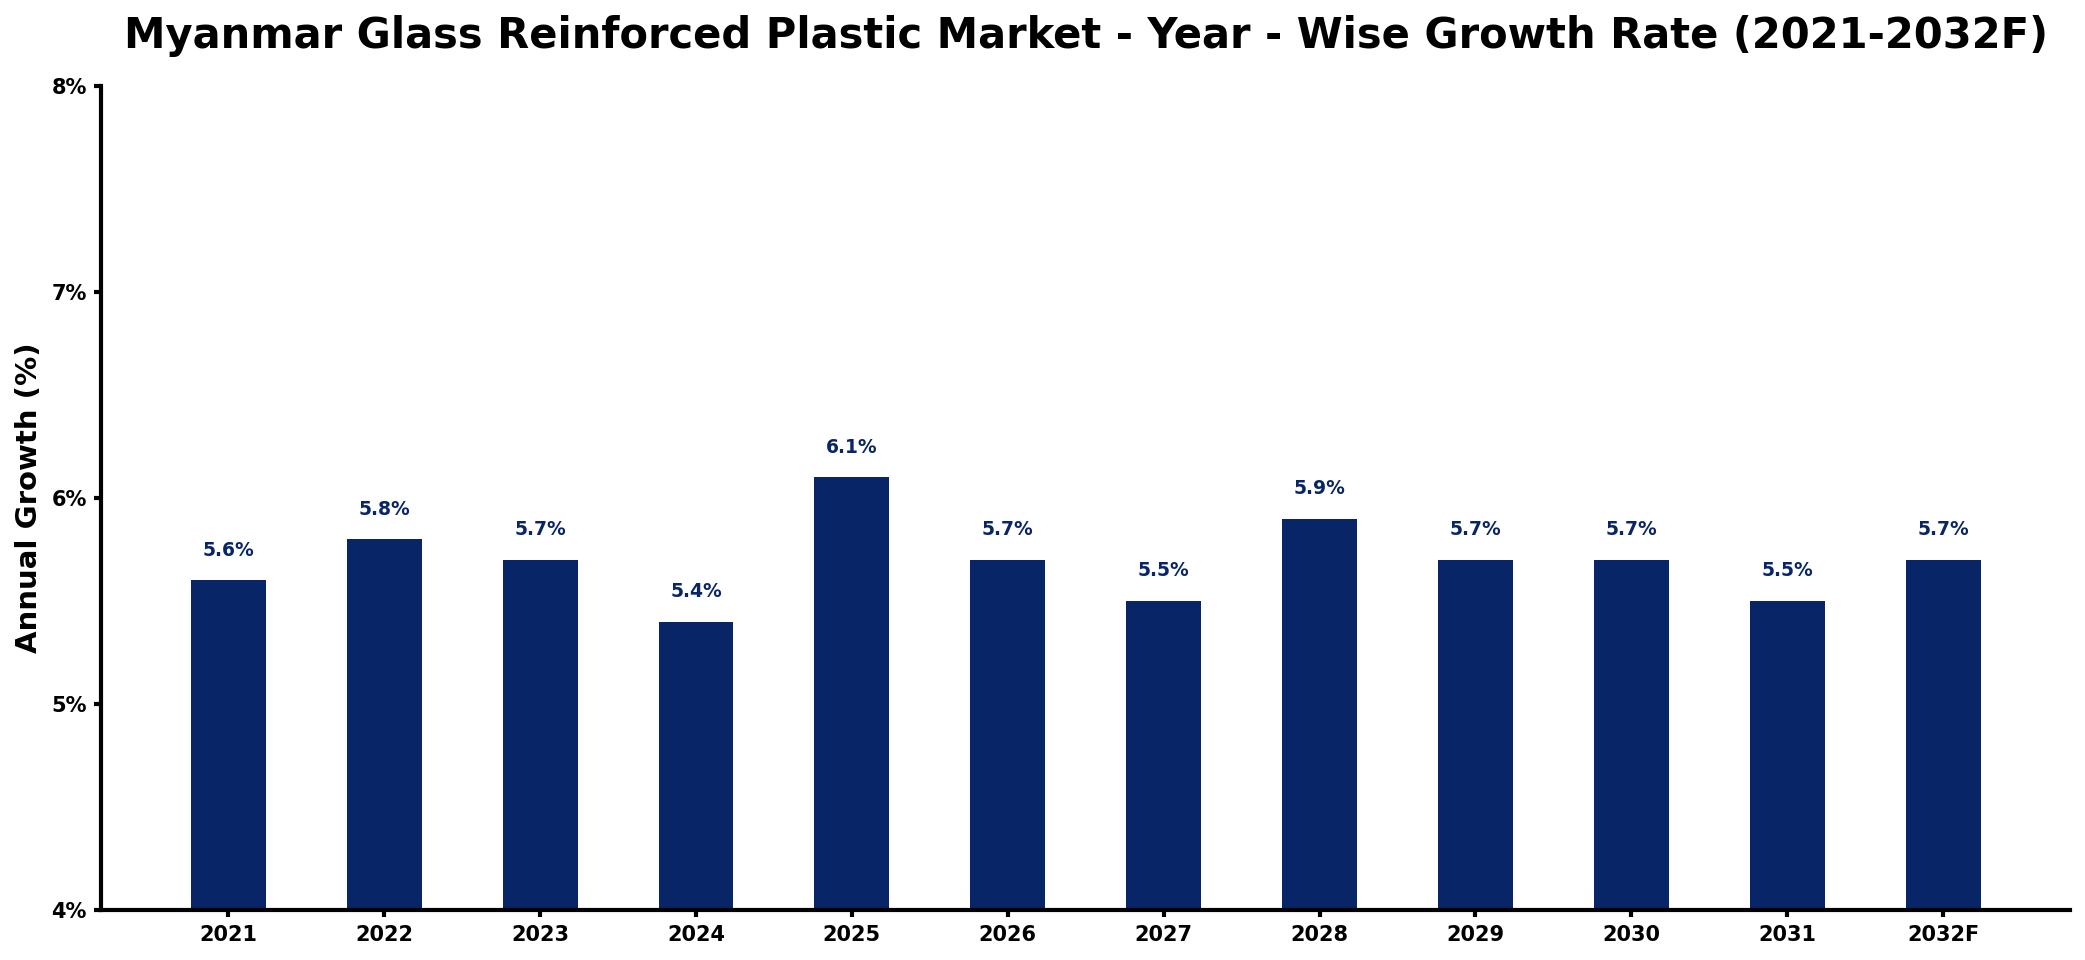
Myanmar Glass Reinforced Plastic Market Growth Rate Analysis (2021-2032)
The Myanmar Glass Reinforced Plastic market has exhibited a stable growth pattern over recent years, with minor fluctuations reflecting ongoing industrial developments. In 2021, the market grew by 5.6%, followed by a slight increase to 5.8% in 2022, aided by rising consumer demand for lightweight, durable materials across various sectors, including construction and automotive. Despite a dip to 5.4% in 2024, which can be attributed to global supply chain disruptions, the growth accelerated to 6.1% in 2025, bolstered by significant investments in local manufacturing infrastructure and an emphasis on energy transition technologies. This momentum is expected to continue, with annual growth rates stabilizing around 5.5% to 5.9% through 2032, driven by both policy support and digitalization trends.
Myanmar Glass Reinforced Plastic Market Year-wise Growth Rate and Key Drivers
This graph highlights how the Myanmar Glass Reinforced Plastic Market has steadily grown over the years, supported by major growth factors.
The table below presents the year‑wise growth rates along with the key drivers influencing the market
| Year | Growth Rate | Major Drivers |
| 2021 | 5.6% | Rising construction sector investments |
| 2022 | 5.8% | Increased demand from automotive industry |
| 2023 | 5.7% | Expansion of renewable energy projects |
| 2024 | 5.4% | Growing infrastructure development initiatives |
| 2025 | 6.1% | Surge in consumer goods production |
| 2026 | 5.7% | Higher demand from marine applications |
| 2027 | 5.5% | Investment in transportation upgrades |
| 2028 | 5.9% | Boom in industrial manufacturing activities |
| 2029 | 5.7% | growing regional consumption patterns |
| 2030 | 5.7% | Growth in electrical equipment usage |
| 2031 | 5.5% | Increased focus on sustainable solutions |
| 2032 | 5.7% | Rising demand for innovative packaging |
Note: Market size estimations and growth projections presented in this report are based on 6Wresearch's proprietary forecasting methodology, utilizing the latest available industry data, government publications, and primary research inputs.
Myanmar Glass Reinforced Plastic Market Synopsis
The Myanmar Glass Reinforced Plastic market is on a promising growth path, characterized by its unique properties, including high strength and corrosion resistance, which are vital for the country's diverse applications. As industries look for efficient and sustainable solutions, GRP is becoming a go-to material, particularly in construction and transportation.
Despite the tremendous potential, the market still faces hurdles, particularly in awareness and education around GRP benefits. Nonetheless, the sector is witnessing active efforts toward product innovation and expanded distribution channels aimed at tapping into this burgeoning demand.
Myanmar Glass Reinforced Plastic Market Key Takeaways
- Significant growth anticipated due to rising infrastructure developments.
- GRP's lightweight and durable properties attract various industries.
- Sustainability trends are pushing manufacturers towards eco-friendly practices.
- Investment in R&D is leading to innovative product offerings.
- Awareness and education are critical for overcoming market limitations.
Evaluation of Restraints in Myanmar Glass Reinforced Plastic Market
While the Myanmar Glass Reinforced Plastic market holds immense potential, several restraints are evident. A primary challenge is the limited awareness of GRP products among both consumers and businesses, which hampers widespread adoption. Furthermore, inconsistencies in quality standards raise concerns regarding reliability and durability. Access to raw materials can also be problematic due to ongoing economic restrictions, making it difficult for manufacturers to meet growing demand effectively.
Myanmar Glass Reinforced Plastic Market Trends
Several current trends are shaping the Myanmar Glass Reinforced Plastic market. The emphasis on sustainability has led manufacturers to explore eco-friendly materials and production methods. Technological advancements are fostering innovative GRP products that enhance performance characteristics, making them even more attractive for use in construction and automotive applications. Additionally, the push towards sustainable practices is likely to maintain momentum as industries increasingly recognize the long-term benefits of utilizing GRP materials.
Myanmar Glass Reinforced Plastic Market Opportunities
The Myanmar Glass Reinforced Plastic market is ripe with investment opportunities. With a growing inclination towards durable and lightweight materials, sectors such as construction, automotive, and marine present lucrative avenues for investors. Collaborating with local industries or engaging in governmental infrastructure projects can yield long-term growth potential. Investors should focus on product development and establishing a strong distribution network to capitalize on the increasing demand.
Government Initiatives in the Myanmar Glass Reinforced Plastic Market
The government of Myanmar has adopted policies to enhance the manufacturing sector, including incentives for foreign investment in GRP production. By promoting technological advancements and sustainable development practices, these initiatives aim to stimulate economic growth, create job opportunities, and attract both local and international investors to the GRP market, thereby supporting its expansion.
Future Insights of the Myanmar Glass Reinforced Plastic Market
Looking ahead to the period from 2026 to 2032, the Myanmar Glass Reinforced Plastic market is positioned for substantial growth. Continuous advancements in technology, combined with the government's supportive policies, will likely drive further adoption of GRP across multiple sectors. The burgeoning construction and infrastructure developments in Myanmar are expected to significantly contribute to the market's expansion, as industries increasingly recognize the advantages of GRP solutions in meeting their specific needs.
Myanmar Glass Reinforced Plastic Market Latest Developments (2025 - 2026)
Recent developments in the Myanmar Glass Reinforced Plastic market indicate a surge in innovation, with manufacturers focusing on enhancing product performance and durability. There is an increased interest in collaboration between local companies and foreign investors, aimed at sharing expertise and advancing production technologies. Additionally, discussions around regulatory improvements are gaining traction, promising a more conducive environment for GRP adoption across various applications.
Myanmar Glass Reinforced Plastic Market - Key Attractiveness of the Report
- 10 Years of Market Numbers
- Historical Data Starting from 2022 to 2025
- Base Year: 2025
- Forecast Data until 2032
- Key Performance Indicators Impacting the Market
- Major Upcoming Developments and Projects
Key Highlights of the Report:
- Myanmar Glass Reinforced Plastic Market Outlook
- Market Size of Myanmar Glass Reinforced Plastic Market, 2025
- Forecast of Myanmar Glass Reinforced Plastic Market, 2032
- Historical Data and Forecast of Myanmar Glass Reinforced Plastic Revenues & Volume for the Period 2022-2032F
- Myanmar Glass Reinforced Plastic Market Trend Evolution
- Myanmar Glass Reinforced Plastic Market Drivers and Challenges
- Myanmar Glass Reinforced Plastic Price Trends
- Myanmar Glass Reinforced Plastic Porter's Five Forces
- Myanmar Glass Reinforced Plastic Industry Life Cycle
- Historical Data and Forecast of Myanmar Glass Reinforced Plastic Market Revenues & Volume By Type for the Period 2022-2032F
- Historical Data and Forecast of Myanmar Glass Reinforced Plastic Market Revenues & Volume By Epoxy for the Period 2022-2032F
- Historical Data and Forecast of Myanmar Glass Reinforced Plastic Market Revenues & Volume By Polyester for the Period 2022-2032F
- Historical Data and Forecast of Myanmar Glass Reinforced Plastic Market Revenues & Volume By Vinyl Ester for the Period 2022-2032F
- Historical Data and Forecast of Myanmar Glass Reinforced Plastic Market Revenues & Volume By Polyurethane for the Period 2022-2032F
- Historical Data and Forecast of Myanmar Glass Reinforced Plastic Market Revenues & Volume By Others for the Period 2022-2032F
- Historical Data and Forecast of Myanmar Glass Reinforced Plastic Market Revenues & Volume By Method for the Period 2022-2032F
- Historical Data and Forecast of Myanmar Glass Reinforced Plastic Market Revenues & Volume By Moulding Method for the Period 2022-2032F
- Historical Data and Forecast of Myanmar Glass Reinforced Plastic Market Revenues & Volume By Pultrusion Method for the Period 2022-2032F
- Historical Data and Forecast of Myanmar Glass Reinforced Plastic Market Revenues & Volume By Layup for the Period 2022-2032F
- Historical Data and Forecast of Myanmar Glass Reinforced Plastic Market Revenues & Volume By Others for the Period 2022-2032F
- Historical Data and Forecast of Myanmar Glass Reinforced Plastic Market Revenues & Volume By Application for the Period 2022-2032F
- Historical Data and Forecast of Myanmar Glass Reinforced Plastic Market Revenues & Volume By Pipes and Tanks for the Period 2022-2032F
- Historical Data and Forecast of Myanmar Glass Reinforced Plastic Market Revenues & Volume By Wind Power Turbines for the Period 2022-2032F
- Historical Data and Forecast of Myanmar Glass Reinforced Plastic Market Revenues & Volume By Storage Containers for the Period 2022-2032F
- Historical Data and Forecast of Myanmar Glass Reinforced Plastic Market Revenues & Volume By Roofs for the Period 2022-2032F
- Historical Data and Forecast of Myanmar Glass Reinforced Plastic Market Revenues & Volume By Floor Gratings for the Period 2022-2032F
- Historical Data and Forecast of Myanmar Glass Reinforced Plastic Market Revenues & Volume By Steps and Stairs for the Period 2022-2032F
- Historical Data and Forecast of Myanmar Glass Reinforced Plastic Market Revenues & Volume By Switch Actuators for the Period 2022-2032F
- Historical Data and Forecast of Myanmar Glass Reinforced Plastic Market Revenues & Volume By Others for the Period 2022-2032F
- Historical Data and Forecast of Myanmar Glass Reinforced Plastic Market Revenues & Volume By End-Use for the Period 2022-2032F
- Historical Data and Forecast of Myanmar Glass Reinforced Plastic Market Revenues & Volume By Building and Construction for the Period 2022-2032F
- Historical Data and Forecast of Myanmar Glass Reinforced Plastic Market Revenues & Volume By Transportation for the Period 2022-2032F
- Historical Data and Forecast of Myanmar Glass Reinforced Plastic Market Revenues & Volume By Electrical and Electronics for the Period 2022-2032F
- Historical Data and Forecast of Myanmar Glass Reinforced Plastic Market Revenues & Volume By Oil and Gas for the Period 2022-2032F
- Historical Data and Forecast of Myanmar Glass Reinforced Plastic Market Revenues & Volume By Mining for the Period 2022-2032F
- Historical Data and Forecast of Myanmar Glass Reinforced Plastic Market Revenues & Volume By Water and Wastewater for the Period 2022-2032F
- Historical Data and Forecast of Myanmar Glass Reinforced Plastic Market Revenues & Volume By Others for the Period 2022-2032F
- Myanmar Glass Reinforced Plastic Import Export Trade Statistics
- Market Opportunity Assessment By Type
- Market Opportunity Assessment By Method
- Market Opportunity Assessment By Application
- Market Opportunity Assessment By End-Use
- Myanmar Glass Reinforced Plastic Top Companies Market Share
- Myanmar Glass Reinforced Plastic Competitive Benchmarking By Technical and Operational Parameters
- Myanmar Glass Reinforced Plastic Company Profiles
- Myanmar Glass Reinforced Plastic Key Strategic Recommendations
Frequently Asked Questions About the Market Study (FAQs):
The Myanmar Glass Reinforced Plastic market is estimated at USD 188 Million in 2025 and is expected to grow to USD 262 Million by 2032, reflecting a CAGR of 4.9% from 2026 to 2032.
The growing focus on sustainability is encouraging manufacturers in Myanmar to adopt eco-friendly materials and practices in GRP production, enhancing the attractiveness of these products across various sectors.
Key sectors such as construction, automotive, and transportation are significantly driving demand for GRP due to its lightweight, strength, and resistance to corrosion.
The increasing demand for GRP in infrastructure and construction projects presents lucrative investment opportunities, particularly for companies focusing on innovative product development and sustainable practices.
Yes, the market faces challenges such as limited consumer awareness, fluctuating raw material prices, and quality inconsistency that need to be addressed for sustained growth.
The Myanmar government is actively promoting foreign investment and sustainable practices in the GRP market, providing incentives and developing policies to support economic growth and industrial development.
6Wresearch actively monitors the Myanmar Glass Reinforced Plastic Market and publishes its comprehensive annual report, highlighting emerging trends, growth drivers, revenue analysis, and forecast outlook. Our insights help businesses to make data-backed strategic decisions with ongoing market dynamics. Our analysts track relevent industries related to the Myanmar Glass Reinforced Plastic Market, allowing our clients with actionable intelligence and reliable forecasts tailored to emerging regional needs.
Yes, we provide customisation as per your requirements. To learn more, feel free to contact us on sales@6wresearch.com
1 Executive Summary |
2 Introduction |
2.1 Key Highlights of the Report |
2.2 Report Description |
2.3 Market Scope & Segmentation |
2.4 Research Methodology |
2.5 Assumptions |
3 Myanmar Glass Reinforced Plastic Market Overview |
3.1 Myanmar Country Macro Economic Indicators |
3.2 Myanmar Glass Reinforced Plastic Market Revenues & Volume, 2022 & 2032F |
3.3 Myanmar Glass Reinforced Plastic Market - Industry Life Cycle |
3.4 Myanmar Glass Reinforced Plastic Market - Porter's Five Forces |
3.5 Myanmar Glass Reinforced Plastic Market Revenues & Volume Share, By Type, 2022 & 2032F |
3.6 Myanmar Glass Reinforced Plastic Market Revenues & Volume Share, By Method, 2022 & 2032F |
3.7 Myanmar Glass Reinforced Plastic Market Revenues & Volume Share, By Application, 2022 & 2032F |
3.8 Myanmar Glass Reinforced Plastic Market Revenues & Volume Share, By End-Use, 2022 & 2032F |
4 Myanmar Glass Reinforced Plastic Market Dynamics |
4.1 Impact Analysis |
4.2 Market Drivers |
4.2.1 Growing infrastructure development projects in Myanmar leading to increased demand for glass reinforced plastic (GRP) products. |
4.2.2 Rising awareness about the benefits of GRP such as durability, corrosion resistance, and lightweight properties. |
4.2.3 Government initiatives and investments in sectors like construction, automotive, and aerospace utilizing GRP materials. |
4.3 Market Restraints |
4.3.1 Lack of skilled labor for GRP manufacturing and installation. |
4.3.2 Fluctuating raw material prices impacting production costs. |
4.3.3 Limited technological advancements and innovation in the Myanmar GRP market. |
5 Myanmar Glass Reinforced Plastic Market Trends |
6 Myanmar Glass Reinforced Plastic Market, By Types |
6.1 Myanmar Glass Reinforced Plastic Market, By Type |
6.1.1 Overview and Analysis |
6.1.2 Myanmar Glass Reinforced Plastic Market Revenues & Volume, By Type, 2022-2032F |
6.1.3 Myanmar Glass Reinforced Plastic Market Revenues & Volume, By Epoxy, 2022-2032F |
6.1.4 Myanmar Glass Reinforced Plastic Market Revenues & Volume, By Polyester, 2022-2032F |
6.1.5 Myanmar Glass Reinforced Plastic Market Revenues & Volume, By Vinyl Ester, 2022-2032F |
6.1.6 Myanmar Glass Reinforced Plastic Market Revenues & Volume, By Polyurethane, 2022-2032F |
6.1.7 Myanmar Glass Reinforced Plastic Market Revenues & Volume, By Others, 2022-2032F |
6.2 Myanmar Glass Reinforced Plastic Market, By Method |
6.2.1 Overview and Analysis |
6.2.2 Myanmar Glass Reinforced Plastic Market Revenues & Volume, By Moulding Method, 2022-2032F |
6.2.3 Myanmar Glass Reinforced Plastic Market Revenues & Volume, By Pultrusion Method, 2022-2032F |
6.2.4 Myanmar Glass Reinforced Plastic Market Revenues & Volume, By Layup, 2022-2032F |
6.2.5 Myanmar Glass Reinforced Plastic Market Revenues & Volume, By Others, 2022-2032F |
6.3 Myanmar Glass Reinforced Plastic Market, By Application |
6.3.1 Overview and Analysis |
6.3.2 Myanmar Glass Reinforced Plastic Market Revenues & Volume, By Pipes and Tanks, 2022-2032F |
6.3.3 Myanmar Glass Reinforced Plastic Market Revenues & Volume, By Wind Power Turbines, 2022-2032F |
6.3.4 Myanmar Glass Reinforced Plastic Market Revenues & Volume, By Storage Containers, 2022-2032F |
6.3.5 Myanmar Glass Reinforced Plastic Market Revenues & Volume, By Roofs, 2022-2032F |
6.3.6 Myanmar Glass Reinforced Plastic Market Revenues & Volume, By Floor Gratings, 2022-2032F |
6.3.7 Myanmar Glass Reinforced Plastic Market Revenues & Volume, By Steps and Stairs, 2022-2032F |
6.3.8 Myanmar Glass Reinforced Plastic Market Revenues & Volume, By Others, 2022-2032F |
6.3.9 Myanmar Glass Reinforced Plastic Market Revenues & Volume, By Others, 2022-2032F |
6.4 Myanmar Glass Reinforced Plastic Market, By End-Use |
6.4.1 Overview and Analysis |
6.4.2 Myanmar Glass Reinforced Plastic Market Revenues & Volume, By Building and Construction, 2022-2032F |
6.4.3 Myanmar Glass Reinforced Plastic Market Revenues & Volume, By Transportation, 2022-2032F |
6.4.4 Myanmar Glass Reinforced Plastic Market Revenues & Volume, By Electrical and Electronics, 2022-2032F |
6.4.5 Myanmar Glass Reinforced Plastic Market Revenues & Volume, By Oil and Gas, 2022-2032F |
6.4.6 Myanmar Glass Reinforced Plastic Market Revenues & Volume, By Mining, 2022-2032F |
6.4.7 Myanmar Glass Reinforced Plastic Market Revenues & Volume, By Water and Wastewater, 2022-2032F |
7 Myanmar Glass Reinforced Plastic Market Import-Export Trade Statistics |
7.1 Myanmar Glass Reinforced Plastic Market Export to Major Countries |
7.2 Myanmar Glass Reinforced Plastic Market Imports from Major Countries |
8 Myanmar Glass Reinforced Plastic Market Key Performance Indicators |
8.1 Number of infrastructure projects incorporating GRP materials. |
8.2 Adoption rate of GRP solutions in key industries. |
8.3 Percentage of companies investing in research and development for GRP product enhancements. |
9 Myanmar Glass Reinforced Plastic Market - Opportunity Assessment |
9.1 Myanmar Glass Reinforced Plastic Market Opportunity Assessment, By Type, 2022 & 2032F |
9.2 Myanmar Glass Reinforced Plastic Market Opportunity Assessment, By Method, 2022 & 2032F |
9.3 Myanmar Glass Reinforced Plastic Market Opportunity Assessment, By Application, 2022 & 2032F |
9.4 Myanmar Glass Reinforced Plastic Market Opportunity Assessment, By End-Use, 2022 & 2032F |
10 Myanmar Glass Reinforced Plastic Market - Competitive Landscape |
10.1 Myanmar Glass Reinforced Plastic Market Revenue Share, By Companies, 2025 |
10.2 Myanmar Glass Reinforced Plastic Market Competitive Benchmarking, By Operating and Technical Parameters |
11 Company Profiles |
12 Recommendations |
13 Disclaimer |
Global Go To Market Strategy - 2030
Export potential enables firms to identify high-growth global markets with greater confidence by combining advanced trade intelligence with a structured quantitative methodology. The framework analyzes emerging demand trends and country-level import patterns while integrating macroeconomic and trade datasets such as GDP and population forecasts, bilateral import–export flows, tariff structures, elasticity differentials between developed and developing economies, geographic distance, and import demand projections. Using weighted trade values from 2020–2024 as the base period to project country-to-country export potential for 2030, these inputs are operationalized through calculated drivers such as gravity model parameters, tariff impact factors, and projected GDP per-capita growth. Through an analysis of hidden potentials, demand hotspots, and market conditions that are most favorable to success, this method enables firms to focus on target countries, maximize returns, and global expansion with data, backed by accuracy.
By factoring in the projected importer demand gap that is currently unmet and could be potential opportunity, it identifies the potential for the Exporter (Country) among 190 countries, against the general trade analysis, which identifies the biggest importer or exporter.
To discover high-growth global markets and optimize your business strategy:
Click Here
Pricing
- Single User License$ 1,995
- Department License$ 2,400
- Site License$ 3,120
- Global License$ 3,795

Leadership Perspectives from Industry Events
Search
Thought Leadership and Analyst Meet


Our Clients
6WResearch In News
- India Air Conditioner Market Set for Strong Rebound in 2026 After Weather-Led Correction and GST-Driven Recovery: 6Wresearch
- ADAS in India: How Automatic Emergency Braking, Blind Spot Detection & Driver Monitoring are Transforming Road Safety
- Doha a strategic location for EV manufacturing hub: IPA Qatar
- Demand for luxury TVs surging in the GCC, says Samsung
- Empowering Growth: The Thriving Journey of Bangladesh’s Cable Industry
- Demand for luxury TVs surging in the GCC, says Samsung
Latest Reports
- Nicaragua RPG Gaming Market (2026-2032)
- New Zealand RPG Gaming Market (2026-2032)
- Netherlands RPG Gaming Market (2026-2032)
- Nauru RPG Gaming Market (2026-2032)
- Namibia RPG Gaming Market (2026-2032)
- Mozambique RPG Gaming Market (2026-2032)
- Montenegro RPG Gaming Market (2026-2032)
- Mongolia RPG Gaming Market (2026-2032)
- Monaco RPG Gaming Market (2026-2032)
- Micronesia RPG Gaming Market (2026-2032)
Industry Events and Analyst Meet

HIMTEX 2026

India Refining Summit 2026

India EV Show 2026

EV tech India Expo 2026

Auto Tech Asia 2026
Whitepaper
- Middle East & Africa Commercial Security Market Click here to view more.
- Middle East & Africa Fire Safety Systems & Equipment Market Click here to view more.
- GCC Drone Market Click here to view more.
- Middle East Lighting Fixture Market Click here to view more.
- GCC Physical & Perimeter Security Market Click here to view more.