Myanmar Inorganic Pigments Market (2026-2032) Outlook | Share, Revenue, Trends, Size, Companies, Analysis, Value, Growth, Forecast & Industry
Market Forecast By Type (Titanium Dioxide, Iron Oxide, Cadmium, Carbon Blank, Lead Chromate, Chromium Oxide, Others), By Colour (Red, Yellow, Orange, Green, Blue, Black, White, Others), By Chemistry (Oxide, Silicate, Carbonate, Sulphate, Sulphide, Others), By Grade (Food Grade, Pharmaceutical Grade, Industrial Grade, Others), By Form (Powder, Liquid), By Application (Plastics, Paints & Coatings, Printing Inks, Glass & Ceramics, Cosmetics, Paper Industry, Food Industry, Others) And Competitive Landscape
| Product Code: ETC190546 | Publication Date: May 2022 | Updated Date: Jun 2026 | Product Type: Market Research Report | |
| Publisher: 6Wresearch | Author: Ravi Bhandari | No. of Pages: 60 | No. of Figures: 40 | No. of Tables: 7 |
Myanmar Inorganic Pigments Market Size, Share & Growth Rate
The Myanmar Inorganic Pigments Market was estimated at USD 759 Million in 2025 and is projected to reach USD 1076 Million by 2032, growing at a CAGR of 5.1% from 2026 to 2032. This upward trajectory is primarily driven by the rapid expansion of the construction and automotive sectors, coupled with a growing demand for high-quality coatings. As these industries continue to flourish, the need for stable and durable inorganic pigments in paints and coatings further cements the market’s robust growth outlook.
Myanmar Inorganic Pigments Market Year-wise Growth Rate and Key Drivers
This graph highlights how the Myanmar Inorganic Pigments Market has steadily grown over the years, supported by major growth factors.
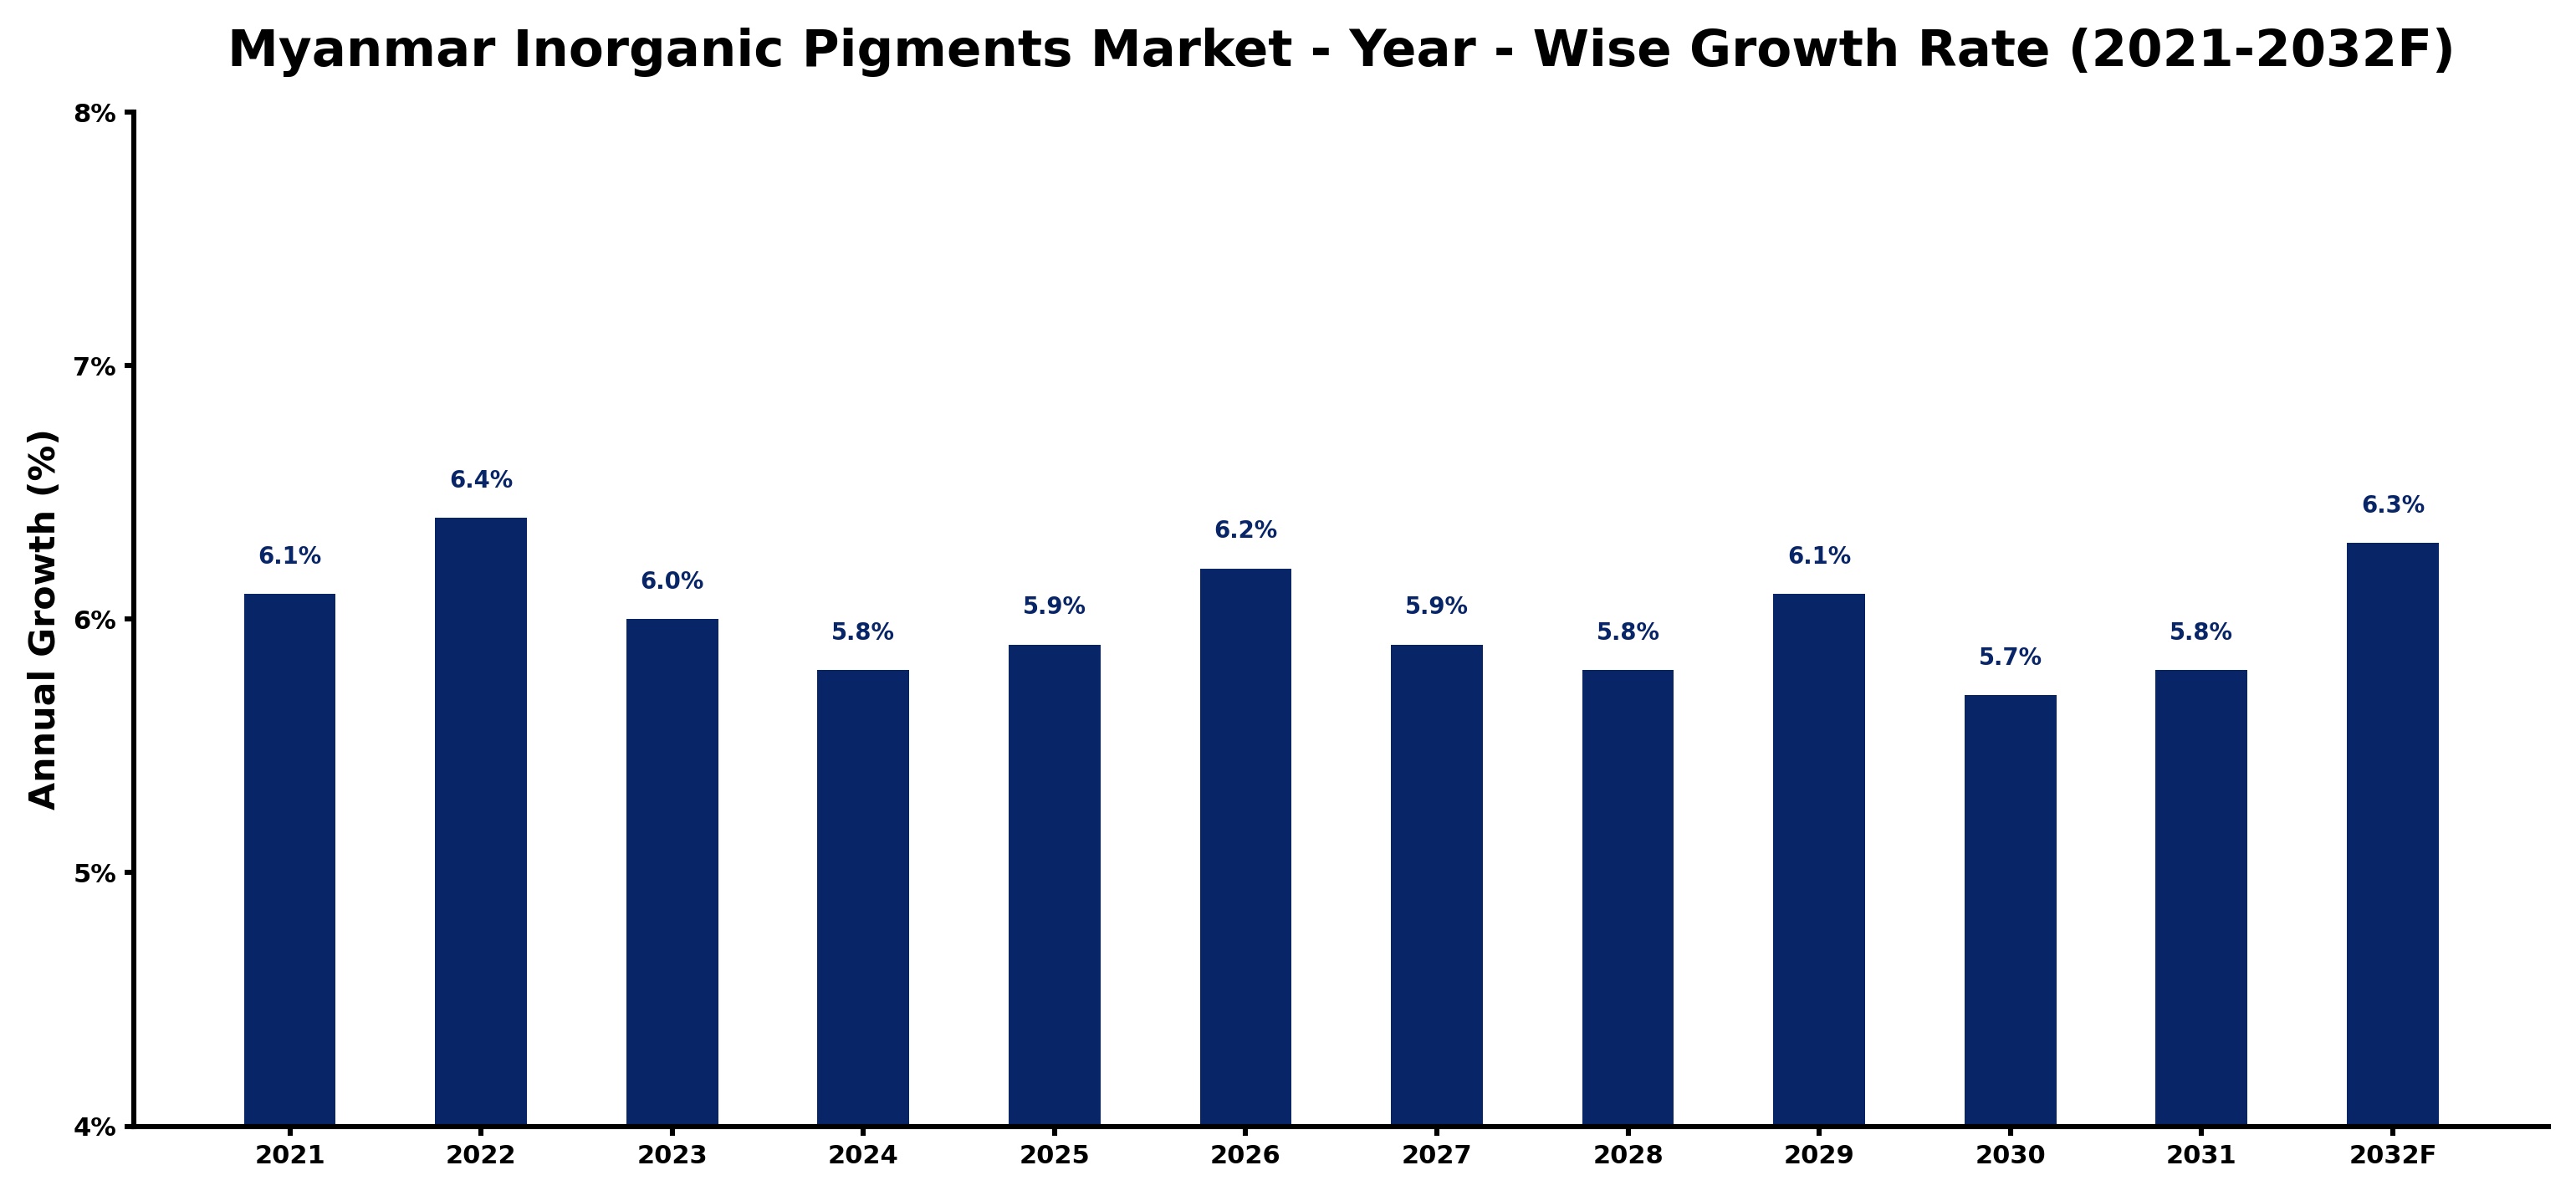
The table below presents the year‑wise growth rates along with the key drivers influencing the market
| Year | Growth Rate | Major Drivers |
| 2021 | 6.1% | Construction sector demand increased |
| 2022 | 6.4% | Automotive industry growth accelerated |
| 2023 | 6.0% | Paint and coatings market expanded |
| 2024 | 5.8% | Plastic manufacturing adoption increased |
| 2025 | 5.9% | Textile industry growth continued |
| 2026 | 6.2% | Electronics sector demand surged |
| 2027 | 5.9% | Cosmetics market expansion continued |
| 2028 | 5.8% | Agricultural applications gained traction |
| 2029 | 6.1% | Renewable energy projects boosted demand |
| 2030 | 5.7% | Infrastructure development projects increased |
| 2031 | 5.8% | Packaging industry growth persisted |
| 2032 | 6.3% | Export opportunities enhanced market access |
Note - Market size estimations and growth projections presented in this report are based on 6Wresearch’s advanced forecasting approach, validated with industry datasets as of June 2026.
Myanmar Inorganic Pigments Market Synopsis
The strongest force currently shaping the Myanmar Inorganic Pigments Market is the booming construction industry, which has a direct impact on demand for high-performance pigments. As infrastructure projects and residential developments increase, so too does the requirement for reliable and aesthetically pleasing coatings that utilize these pigments.
Additionally, there is a marked shift towards eco-friendly and non-toxic pigment formulations. Manufacturers are adapting to this change, driven by consumer awareness and regulatory pressures, and are increasingly focusing on sustainable production practices while maintaining product quality.
Myanmar Inorganic Pigments Market Key Takeaways
- The market is significantly influenced by the growth of construction and automotive sectors.
- High-performance and eco-friendly pigments are becoming key differentiators among manufacturers.
- Challenges in sourcing quality materials and compliance with sustainability regulations persist.
- Government policies are increasingly aimed at ensuring quality and environmental safety in pigment production.
- Technological advancements are paving the way for innovative pigment applications in various industries.
Evaluation of Restraints in Myanmar Inorganic Pigments Market
The Myanmar Inorganic Pigments Market faces several notable restraints that could hinder its full potential. One of the primary limitations is the inconsistent access to high-quality raw materials necessary for pigment production. This inconsistency leads to variability in product performance and can negatively affect market competitiveness. Furthermore, manufacturers are compelled to navigate complex regulatory environments concerning environmental sustainability, which may require substantial investments in alternative production methods. Lastly, fluctuations in global market prices and currency exchange rates can impact the profitability of manufacturers and distributors, creating a less stable market landscape.
Myanmar Inorganic Pigments Market Trends
Recent trends in the Myanmar Inorganic Pigments Market indicate a strong pivot towards the development of sustainable and eco-friendly pigment alternatives. Consumers are increasingly conscious of environmental impacts, pushing manufacturers to innovate. Additionally, the demand for specialized pigments that offer enhanced performance, such as increased opacity and UV resistance, is gaining traction. Digital advancements also allow for more efficient production processes, leading to cost reductions and better product quality.
Myanmar Inorganic Pigments Market Opportunities
There are substantial growth and investment opportunities within the Myanmar Inorganic Pigments Market. As the construction sector continues to expand, companies can capitalize on the rising demand for high-quality coatings and decorative applications. Furthermore, the increasing interest in non-toxic and eco-friendly pigments presents a chance for innovation and differentiation. With supportive government policies aiming to enhance product quality and sustainability, businesses can explore new production technologies and applications, thereby securing a competitive edge.
Government Initiatives in the Myanmar Inorganic Pigments Market
The Myanmar government is actively implementing initiatives that support the growth and regulation of the inorganic pigments market. These include establishing standards for pigment production, quality control, and environmental sustainability. Additionally, there are programs to promote research and development in innovative pigment technologies, which aim to boost industry competitiveness while ensuring that safety and environmental considerations are upheld.
Future Insights of the Myanmar Inorganic Pigments Market
Looking ahead to the period from 2026 to 2032, the Myanmar Inorganic Pigments Market is poised for notable growth. The anticipated increase in construction activities, coupled with the demand for advanced coating solutions, will likely drive further market expansion. As manufacturers increasingly focus on sustainability, the development of eco-friendly pigments will define market dynamics, creating opportunities for forward-thinking businesses. Moreover, continued advancements in production technologies are expected to enhance product offerings and efficiencies, setting the stage for a vibrant market landscape.
Myanmar Inorganic Pigments Market Latest Developments (May 2025 - June 2026)
Recent industry trends indicate a proactive movement towards incorporating sustainable practices in pigment production. Manufacturers are exploring innovative formulations that not only meet performance standards but also adhere to environmental regulations. Additionally, there is a growing emphasis on technological integration to improve operational efficiencies, which could reshape the competitive dynamics in the market over the coming years.
Myanmar Inorganic Pigments Market - Key Attractiveness of the Report
- 10 Years of Market Numbers
- Historical Data Starting from 2022 to 2025
- Base Year: 2025
- Forecast Data until 2032
- Key Performance Indicators Impacting the Market
- Major Upcoming Developments and Projects
Key Highlights of the Report:
- Myanmar Inorganic Pigments Market Outlook
- Market Size of Myanmar Inorganic Pigments Market, 2025
- Forecast of Myanmar Inorganic Pigments Market, 2032
- Historical Data and Forecast of Myanmar Inorganic Pigments Revenues & Volume for the Period 2022-2032F
- Myanmar Inorganic Pigments Market Trend Evolution
- Myanmar Inorganic Pigments Market Drivers and Challenges
- Myanmar Inorganic Pigments Price Trends
- Myanmar Inorganic Pigments Porter's Five Forces
- Myanmar Inorganic Pigments Industry Life Cycle
- Historical Data and Forecast of Myanmar Inorganic Pigments Market Revenues & Volume By Type for the Period 2022-2032F
- Historical Data and Forecast of Myanmar Inorganic Pigments Market Revenues & Volume By Titanium Dioxide for the Period 2022-2032F
- Historical Data and Forecast of Myanmar Inorganic Pigments Market Revenues & Volume By Iron Oxide, Cadmium for the Period 2022-2032F
- Historical Data and Forecast of Myanmar Inorganic Pigments Market Revenues & Volume By Carbon Blank for the Period 2022-2032F
- Historical Data and Forecast of Myanmar Inorganic Pigments Market Revenues & Volume By Lead Chromate for the Period 2022-2032F
- Historical Data and Forecast of Myanmar Inorganic Pigments Market Revenues & Volume By Chromium Oxide for the Period 2022-2032F
- Historical Data and Forecast of Myanmar Inorganic Pigments Market Revenues & Volume By Others for the Period 2022-2032F
- Historical Data and Forecast of Myanmar Inorganic Pigments Market Revenues & Volume By Colour for the Period 2022-2032F
- Historical Data and Forecast of Myanmar Inorganic Pigments Market Revenues & Volume By Red for the Period 2022-2032F
- Historical Data and Forecast of Myanmar Inorganic Pigments Market Revenues & Volume By Yellow for the Period 2022-2032F
- Historical Data and Forecast of Myanmar Inorganic Pigments Market Revenues & Volume By Orange for the Period 2022-2032F
- Historical Data and Forecast of Myanmar Inorganic Pigments Market Revenues & Volume By Green for the Period 2022-2032F
- Historical Data and Forecast of Myanmar Inorganic Pigments Market Revenues & Volume By Blue for the Period 2022-2032F
- Historical Data and Forecast of Myanmar Inorganic Pigments Market Revenues & Volume By Black for the Period 2022-2032F
- Historical Data and Forecast of Myanmar Inorganic Pigments Market Revenues & Volume By White for the Period 2022-2032F
- Historical Data and Forecast of Myanmar Inorganic Pigments Market Revenues & Volume By Others for the Period 2022-2032F
- Historical Data and Forecast of Myanmar Inorganic Pigments Market Revenues & Volume By Chemistry for the Period 2022-2032F
- Historical Data and Forecast of Myanmar Inorganic Pigments Market Revenues & Volume By Oxide for the Period 2022-2032F
- Historical Data and Forecast of Myanmar Inorganic Pigments Market Revenues & Volume By Silicate for the Period 2022-2032F
- Historical Data and Forecast of Myanmar Inorganic Pigments Market Revenues & Volume By Carbonate for the Period 2022-2032F
- Historical Data and Forecast of Myanmar Inorganic Pigments Market Revenues & Volume By Sulphate for the Period 2022-2032F
- Historical Data and Forecast of Myanmar Inorganic Pigments Market Revenues & Volume By Sulphide for the Period 2022-2032F
- Historical Data and Forecast of Myanmar Inorganic Pigments Market Revenues & Volume By Others for the Period 2022-2032F
- Historical Data and Forecast of Myanmar Inorganic Pigments Market Revenues & Volume By Grade for the Period 2022-2032F
- Historical Data and Forecast of Myanmar Inorganic Pigments Market Revenues & Volume By Food Grade for the Period 2022-2032F
- Historical Data and Forecast of Myanmar Inorganic Pigments Market Revenues & Volume By Pharmaceutical Grade for the Period 2022-2032F
- Historical Data and Forecast of Myanmar Inorganic Pigments Market Revenues & Volume By Industrial Grade for the Period 2022-2032F
- Historical Data and Forecast of Myanmar Inorganic Pigments Market Revenues & Volume By Others for the Period 2022-2032F
- Historical Data and Forecast of Myanmar Inorganic Pigments Market Revenues & Volume By Form for the Period 2022-2032F
- Historical Data and Forecast of Myanmar Inorganic Pigments Market Revenues & Volume By Powder for the Period 2022-2032F
- Historical Data and Forecast of Myanmar Inorganic Pigments Market Revenues & Volume By Liquid for the Period 2022-2032F
- Historical Data and Forecast of Myanmar Inorganic Pigments Market Revenues & Volume By Application for the Period 2022-2032F
- Historical Data and Forecast of Myanmar Inorganic Pigments Market Revenues & Volume By Plastics for the Period 2022-2032F
- Historical Data and Forecast of Myanmar Inorganic Pigments Market Revenues & Volume By Paints & Coatings for the Period 2022-2032F
- Historical Data and Forecast of Myanmar Inorganic Pigments Market Revenues & Volume By Printing Inks for the Period 2022-2032F
- Historical Data and Forecast of Myanmar Inorganic Pigments Market Revenues & Volume By Glass & Ceramics for the Period 2022-2032F
- Historical Data and Forecast of Myanmar Inorganic Pigments Market Revenues & Volume By Cosmetics for the Period 2022-2032F
- Historical Data and Forecast of Myanmar Inorganic Pigments Market Revenues & Volume By Paper Industry for the Period 2022-2032F
- Historical Data and Forecast of Myanmar Inorganic Pigments Market Revenues & Volume By Food Industry for the Period 2022-2032F
- Historical Data and Forecast of Myanmar Inorganic Pigments Market Revenues & Volume By Others for the Period 2022-2032F
- Myanmar Inorganic Pigments Import Export Trade Statistics
- Market Opportunity Assessment By Type
- Market Opportunity Assessment By Colour
- Market Opportunity Assessment By Chemistry
- Market Opportunity Assessment By Grade
- Market Opportunity Assessment By Form
- Market Opportunity Assessment By Application
- Myanmar Inorganic Pigments Top Companies Market Share
- Myanmar Inorganic Pigments Competitive Benchmarking By Technical and Operational Parameters
- Myanmar Inorganic Pigments Company Profiles
- Myanmar Inorganic Pigments Key Strategic Recommendations
Myanmar Inorganic Pigments Market - Frequently Asked Questions
As of 2025, the Myanmar Inorganic Pigments Market is valued at approximately USD 759 Million and is projected to grow to USD 1076 Million by 2032, with a CAGR of 5.1% from 2026 to 2032.
The key industries driving the demand for inorganic pigments in Myanmar include construction, automotive, and various coatings applications, where durability and performance are essential.
Increasing consumer awareness and regulatory pressures are pushing manufacturers toward developing eco-friendly and non-toxic pigment formulations, which is reshaping product offerings in the market.
Manufacturers contend with sourcing high-quality materials, meeting strict sustainability regulations, and navigating fluctuating market prices, which can affect their competitiveness.
Anticipated trends include a continued emphasis on sustainable practices, advancements in pigment technology, and an increase in demand for specialized pigments that enhance performance across various applications.
6Wresearch actively monitors the Myanmar Inorganic Pigments Market and publishes its comprehensive annual report, highlighting emerging trends, growth drivers, revenue analysis, and forecast outlook. Our insights help businesses to make data-backed strategic decisions with ongoing market dynamics. Our analysts track relevent industries related to the Myanmar Inorganic Pigments Market, allowing our clients with actionable intelligence and reliable forecasts tailored to emerging regional needs.
Yes, we provide customisation as per your requirements. To learn more, feel free to contact us on sales@6wresearch.com
1 Executive Summary |
2 Introduction |
2.1 Key Highlights of the Report |
2.2 Report Description |
2.3 Market Scope & Segmentation |
2.4 Research Methodology |
2.5 Assumptions |
3 Myanmar Inorganic Pigments Market Overview |
3.1 Myanmar Country Macro Economic Indicators |
3.2 Myanmar Inorganic Pigments Market Revenues & Volume, 2022 & 2032F |
3.3 Myanmar Inorganic Pigments Market - Industry Life Cycle |
3.4 Myanmar Inorganic Pigments Market - Porter's Five Forces |
3.5 Myanmar Inorganic Pigments Market Revenues & Volume Share, By Type, 2022 & 2032F |
3.6 Myanmar Inorganic Pigments Market Revenues & Volume Share, By Colour, 2022 & 2032F |
3.7 Myanmar Inorganic Pigments Market Revenues & Volume Share, By Chemistry, 2022 & 2032F |
3.8 Myanmar Inorganic Pigments Market Revenues & Volume Share, By Grade, 2022 & 2032F |
3.9 Myanmar Inorganic Pigments Market Revenues & Volume Share, By Form, 2022 & 2032F |
3.10 Myanmar Inorganic Pigments Market Revenues & Volume Share, By Application, 2022 & 2032F |
4 Myanmar Inorganic Pigments Market Dynamics |
4.1 Impact Analysis |
4.2 Market Drivers |
4.2.1 Growing demand from end-use industries such as construction, automotive, and packaging |
4.2.2 Increasing investments in infrastructure development projects in Myanmar |
4.2.3 Rising awareness about the benefits of inorganic pigments over organic pigments |
4.3 Market Restraints |
4.3.1 Fluctuating prices of raw materials impacting production costs |
4.3.2 Lack of technological advancements in the inorganic pigments market in Myanmar |
4.3.3 Stringent environmental regulations affecting production processes |
5 Myanmar Inorganic Pigments Market Trends |
6 Myanmar Inorganic Pigments Market, By Types |
6.1 Myanmar Inorganic Pigments Market, By Type |
6.1.1 Overview and Analysis |
6.1.2 Myanmar Inorganic Pigments Market Revenues & Volume, By Type, 2022-2032F |
6.1.3 Myanmar Inorganic Pigments Market Revenues & Volume, By Titanium Dioxide, 2022-2032F |
6.1.4 Myanmar Inorganic Pigments Market Revenues & Volume, By Iron Oxide, Cadmium, 2022-2032F |
6.1.5 Myanmar Inorganic Pigments Market Revenues & Volume, By Carbon Blank, 2022-2032F |
6.1.6 Myanmar Inorganic Pigments Market Revenues & Volume, By Lead Chromate, 2022-2032F |
6.1.7 Myanmar Inorganic Pigments Market Revenues & Volume, By Chromium Oxide, 2022-2032F |
6.1.8 Myanmar Inorganic Pigments Market Revenues & Volume, By Others, 2022-2032F |
6.2 Myanmar Inorganic Pigments Market, By Colour |
6.2.1 Overview and Analysis |
6.2.2 Myanmar Inorganic Pigments Market Revenues & Volume, By Red, 2022-2032F |
6.2.3 Myanmar Inorganic Pigments Market Revenues & Volume, By Yellow, 2022-2032F |
6.2.4 Myanmar Inorganic Pigments Market Revenues & Volume, By Orange, 2022-2032F |
6.2.5 Myanmar Inorganic Pigments Market Revenues & Volume, By Green, 2022-2032F |
6.2.6 Myanmar Inorganic Pigments Market Revenues & Volume, By Blue, 2022-2032F |
6.2.7 Myanmar Inorganic Pigments Market Revenues & Volume, By Black, 2022-2032F |
6.2.8 Myanmar Inorganic Pigments Market Revenues & Volume, By Others, 2022-2032F |
6.2.9 Myanmar Inorganic Pigments Market Revenues & Volume, By Others, 2022-2032F |
6.3 Myanmar Inorganic Pigments Market, By Chemistry |
6.3.1 Overview and Analysis |
6.3.2 Myanmar Inorganic Pigments Market Revenues & Volume, By Oxide, 2022-2032F |
6.3.3 Myanmar Inorganic Pigments Market Revenues & Volume, By Silicate, 2022-2032F |
6.3.4 Myanmar Inorganic Pigments Market Revenues & Volume, By Carbonate, 2022-2032F |
6.3.5 Myanmar Inorganic Pigments Market Revenues & Volume, By Sulphate, 2022-2032F |
6.3.6 Myanmar Inorganic Pigments Market Revenues & Volume, By Sulphide, 2022-2032F |
6.3.7 Myanmar Inorganic Pigments Market Revenues & Volume, By Others, 2022-2032F |
6.4 Myanmar Inorganic Pigments Market, By Grade |
6.4.1 Overview and Analysis |
6.4.2 Myanmar Inorganic Pigments Market Revenues & Volume, By Food Grade, 2022-2032F |
6.4.3 Myanmar Inorganic Pigments Market Revenues & Volume, By Pharmaceutical Grade, 2022-2032F |
6.4.4 Myanmar Inorganic Pigments Market Revenues & Volume, By Industrial Grade, 2022-2032F |
6.4.5 Myanmar Inorganic Pigments Market Revenues & Volume, By Others, 2022-2032F |
6.5 Myanmar Inorganic Pigments Market, By Form |
6.5.1 Overview and Analysis |
6.5.2 Myanmar Inorganic Pigments Market Revenues & Volume, By Powder, 2022-2032F |
6.5.3 Myanmar Inorganic Pigments Market Revenues & Volume, By Liquid, 2022-2032F |
6.6 Myanmar Inorganic Pigments Market, By Application |
6.6.1 Overview and Analysis |
6.6.2 Myanmar Inorganic Pigments Market Revenues & Volume, By Plastics, 2022-2032F |
6.6.3 Myanmar Inorganic Pigments Market Revenues & Volume, By Paints & Coatings, 2022-2032F |
6.6.4 Myanmar Inorganic Pigments Market Revenues & Volume, By Printing Inks, 2022-2032F |
6.6.5 Myanmar Inorganic Pigments Market Revenues & Volume, By Glass & Ceramics, 2022-2032F |
6.6.6 Myanmar Inorganic Pigments Market Revenues & Volume, By Cosmetics, 2022-2032F |
6.6.7 Myanmar Inorganic Pigments Market Revenues & Volume, By Paper Industry, 2022-2032F |
6.6.8 Myanmar Inorganic Pigments Market Revenues & Volume, By Others, 2022-2032F |
6.6.9 Myanmar Inorganic Pigments Market Revenues & Volume, By Others, 2022-2032F |
7 Myanmar Inorganic Pigments Market Import-Export Trade Statistics |
7.1 Myanmar Inorganic Pigments Market Export to Major Countries |
7.2 Myanmar Inorganic Pigments Market Imports from Major Countries |
8 Myanmar Inorganic Pigments Market Key Performance Indicators |
8.1 Percentage increase in the number of infrastructure projects utilizing inorganic pigments |
8.2 Adoption rate of inorganic pigments in new applications or industries |
8.3 Investment in research and development for innovative inorganic pigment formulations |
9 Myanmar Inorganic Pigments Market - Opportunity Assessment |
9.1 Myanmar Inorganic Pigments Market Opportunity Assessment, By Type, 2022 & 2032F |
9.2 Myanmar Inorganic Pigments Market Opportunity Assessment, By Colour, 2022 & 2032F |
9.3 Myanmar Inorganic Pigments Market Opportunity Assessment, By Chemistry, 2022 & 2032F |
9.4 Myanmar Inorganic Pigments Market Opportunity Assessment, By Grade, 2022 & 2032F |
9.5 Myanmar Inorganic Pigments Market Opportunity Assessment, By Form, 2022 & 2032F |
9.6 Myanmar Inorganic Pigments Market Opportunity Assessment, By Application, 2022 & 2032F |
10 Myanmar Inorganic Pigments Market - Competitive Landscape |
10.1 Myanmar Inorganic Pigments Market Revenue Share, By Companies, 2025 |
10.2 Myanmar Inorganic Pigments Market Competitive Benchmarking, By Operating and Technical Parameters |
11 Company Profiles |
12 Recommendations |
13 Disclaimer |
Global Go To Market Strategy - 2030
Export potential enables firms to identify high-growth global markets with greater confidence by combining advanced trade intelligence with a structured quantitative methodology. The framework analyzes emerging demand trends and country-level import patterns while integrating macroeconomic and trade datasets such as GDP and population forecasts, bilateral import–export flows, tariff structures, elasticity differentials between developed and developing economies, geographic distance, and import demand projections. Using weighted trade values from 2020–2024 as the base period to project country-to-country export potential for 2030, these inputs are operationalized through calculated drivers such as gravity model parameters, tariff impact factors, and projected GDP per-capita growth. Through an analysis of hidden potentials, demand hotspots, and market conditions that are most favorable to success, this method enables firms to focus on target countries, maximize returns, and global expansion with data, backed by accuracy.
By factoring in the projected importer demand gap that is currently unmet and could be potential opportunity, it identifies the potential for the Exporter (Country) among 190 countries, against the general trade analysis, which identifies the biggest importer or exporter.
To discover high-growth global markets and optimize your business strategy:
Click Here
Pricing
- Single User License$ 1,995
- Department License$ 2,400
- Site License$ 3,120
- Global License$ 3,795

Leadership Perspectives from Industry Events
Search
Thought Leadership and Analyst Meet


Our Clients
6WResearch In News
- India Air Conditioner Market Set for Strong Rebound in 2026 After Weather-Led Correction and GST-Driven Recovery: 6Wresearch
- ADAS in India: How Automatic Emergency Braking, Blind Spot Detection & Driver Monitoring are Transforming Road Safety
- Doha a strategic location for EV manufacturing hub: IPA Qatar
- Demand for luxury TVs surging in the GCC, says Samsung
- Empowering Growth: The Thriving Journey of Bangladesh’s Cable Industry
- Demand for luxury TVs surging in the GCC, says Samsung
Latest Reports
- Nicaragua RPG Gaming Market (2026-2032)
- New Zealand RPG Gaming Market (2026-2032)
- Netherlands RPG Gaming Market (2026-2032)
- Nauru RPG Gaming Market (2026-2032)
- Namibia RPG Gaming Market (2026-2032)
- Mozambique RPG Gaming Market (2026-2032)
- Montenegro RPG Gaming Market (2026-2032)
- Mongolia RPG Gaming Market (2026-2032)
- Monaco RPG Gaming Market (2026-2032)
- Micronesia RPG Gaming Market (2026-2032)
Industry Events and Analyst Meet

EV India Expo 2026

HIMTEX 2026

India Refining Summit 2026

India EV Show 2026

EV tech India Expo 2026
Whitepaper
- Middle East & Africa Commercial Security Market Click here to view more.
- Middle East & Africa Fire Safety Systems & Equipment Market Click here to view more.
- GCC Drone Market Click here to view more.
- Middle East Lighting Fixture Market Click here to view more.
- GCC Physical & Perimeter Security Market Click here to view more.