Myanmar Phosphoric Acid Market (2026-2032) Outlook | Forecast, Trends, Value, Analysis, Growth, Companies, Industry, Size, Revenue & Share
Market Forecast By Process Type (Wet Process, Thermal Process, Others), By Application (Home Cleaning Agents, Fertilizer Chemicals), By Fertilizer Type (Mono-Ammonium Phosphate (MAP), Diammonium Phosphate (DAP), Triple Superphosphate (TSP)), By End-Users (Electronics, Beverage, Medical, Food, Fertilizer, Others), By Grade (Food-Grade, Technical Grade) And Competitive Landscape
| Product Code: ETC129545 | Publication Date: Jun 2021 | Updated Date: Jun 2026 | Product Type: Report | |
| Publisher: 6Wresearch | Author: Ravi Bhandari | No. of Pages: 70 | No. of Figures: 35 | No. of Tables: 5 |
Myanmar Phosphoric Acid Market Size, Share & Growth Rate
The Myanmar Phosphoric Acid Market was estimated at USD 269 Million in 2025 and is projected to reach USD 372 Million by 2032, growing at a CAGR of 4.7% from 2026 to 2032. This growth trajectory is primarily fueled by the burgeoning agriculture sector, which serves as the backbone of Myanmar's economy. As the demand for fertilizers intensifies to support agricultural productivity, the reliance on phosphoric acid, a vital fertilizer ingredient, continues to rise.
Myanmar Phosphoric Acid Market Year-wise Growth Rate and Key Drivers
This graph highlights how the Myanmar Phosphoric Acid Market has steadily grown over the years, supported by major growth factors.
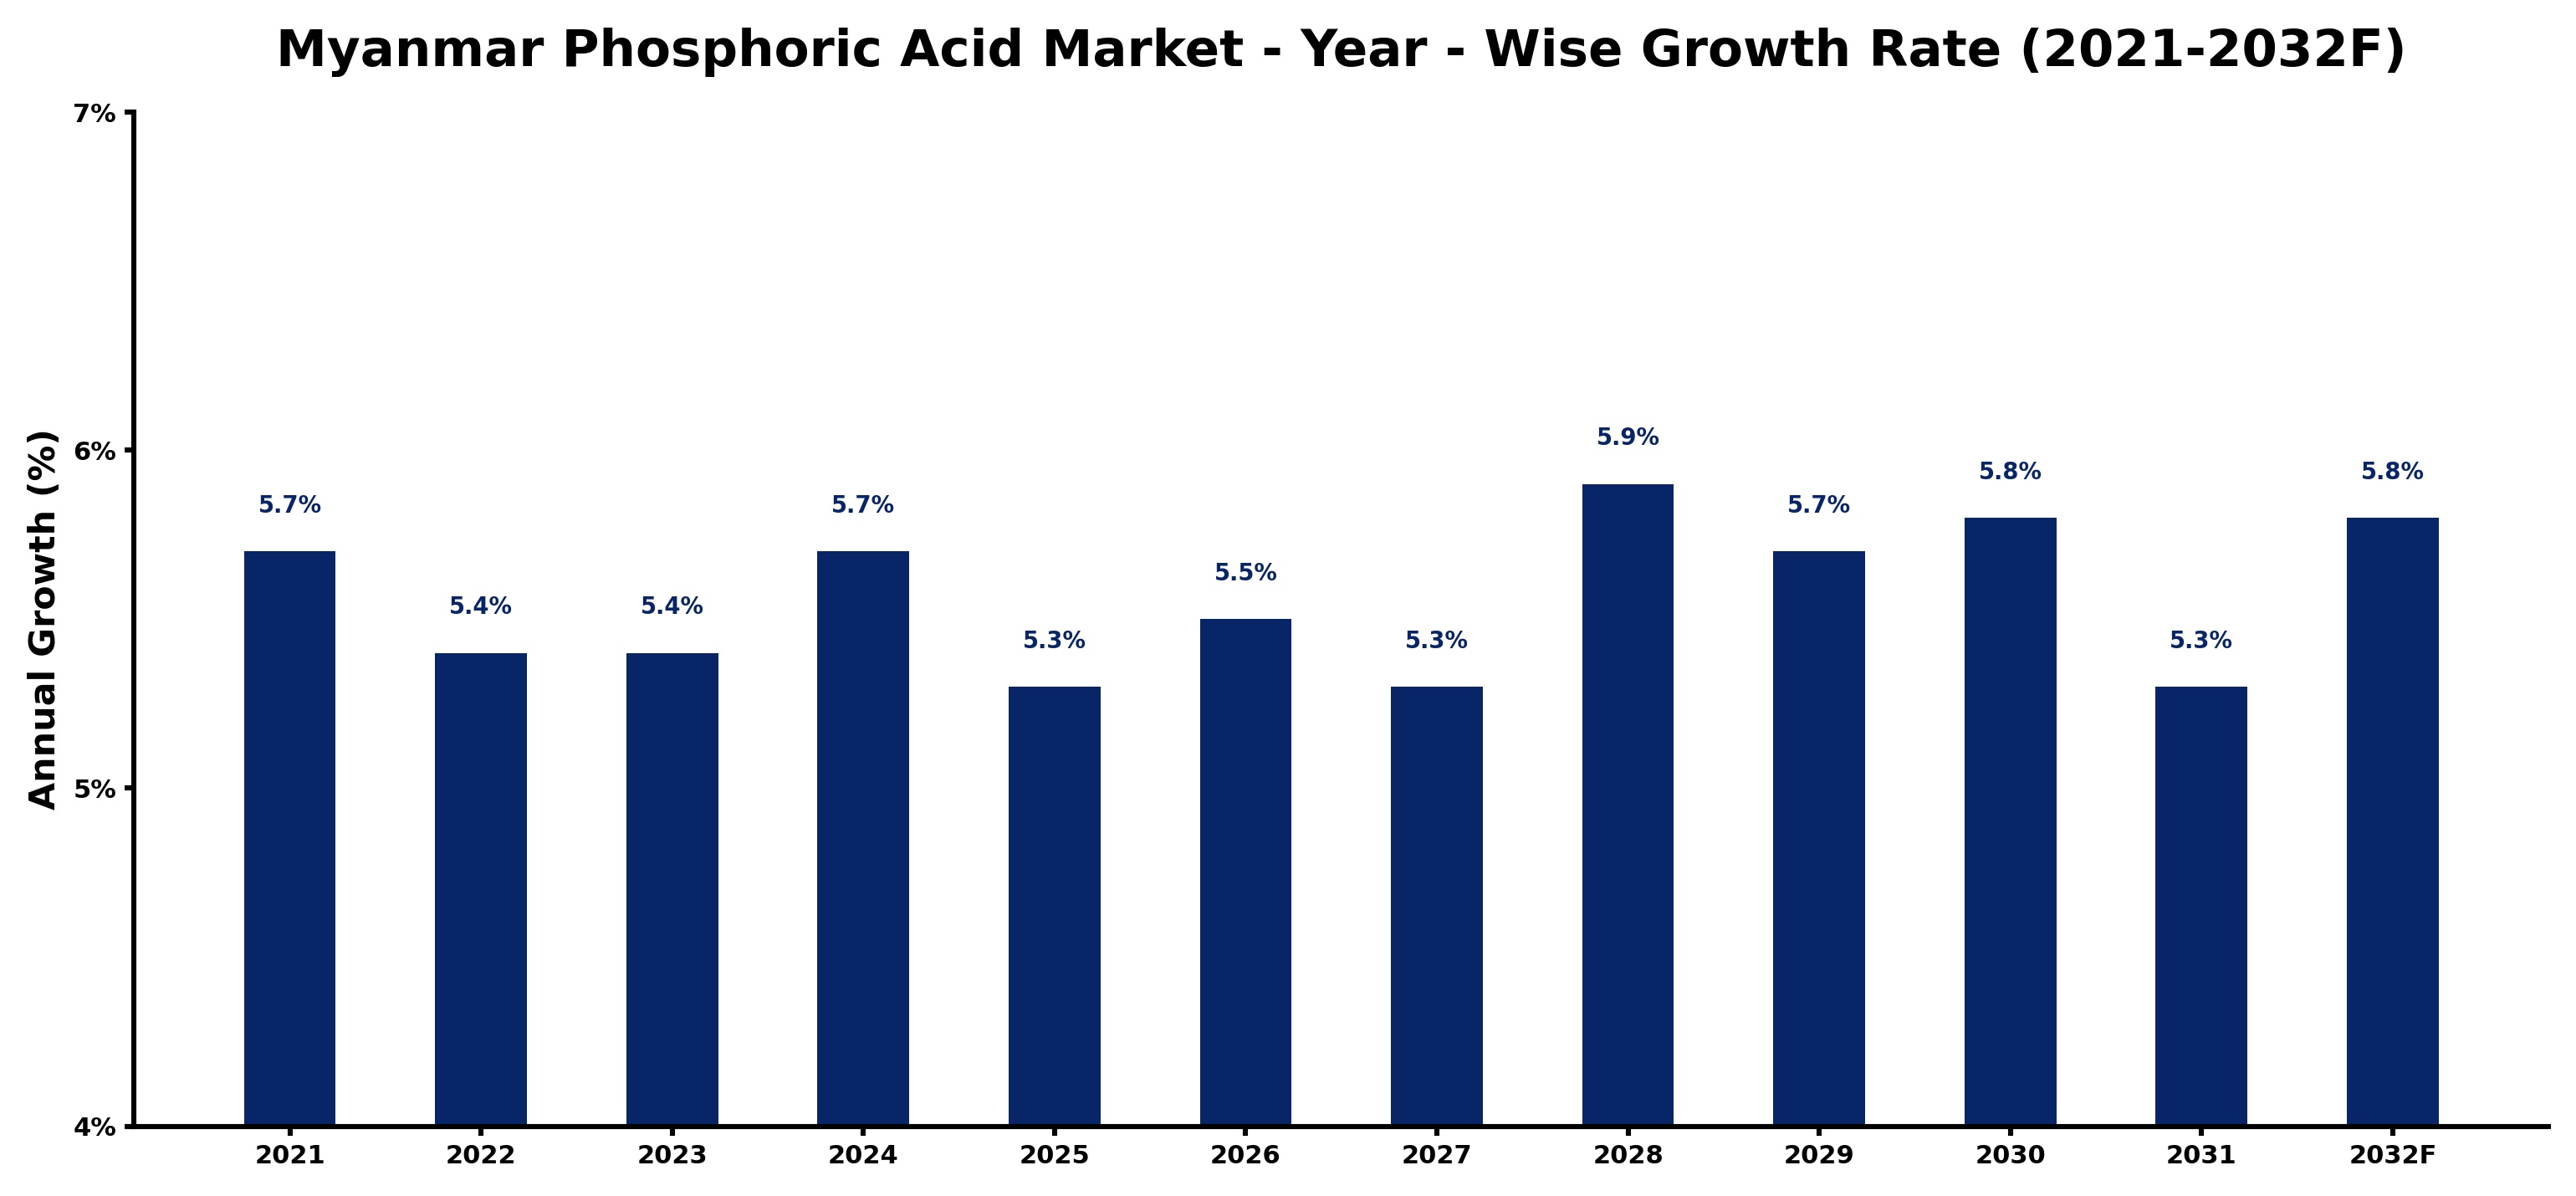
The table below presents the year‑wise growth rates along with the key drivers influencing the market
| Year | Growth Rate | Major Drivers |
| 2021 | 5.7% | Rapid growth in telecom and data center sectors |
| 2022 | 5.4% | Growing urbanization and commercial development |
| 2023 | 5.4% | Expansion of commercial construction activities |
| 2024 | 5.7% | Increasing adoption of advanced technologies |
| 2025 | 5.3% | Expansion of commercial construction activities |
| 2026 | 5.5% | Increasing adoption of advanced technologies |
| 2027 | 5.3% | Increasing industrial automation investments |
| 2028 | 5.9% | Expansion of transportation and logistics networks |
| 2029 | 5.7% | Increasing industrial infrastructure investments |
| 2030 | 5.8% | Growing renewable energy integration projects |
| 2031 | 5.3% | Rapid growth in telecom and data center sectors |
| 2032 | 5.8% | Expansion of commercial construction activities |
Note - Market size estimations and growth projections presented in this report are based on 6Wresearch’s advanced forecasting approach, validated with industry datasets as of June 2026.
Myanmar Phosphoric Acid Market Synopsis
In Myanmar, the phosphoric acid market is increasingly vital to meet the surging needs of the agricultural sector. As one of the main components of fertilizers, phosphoric acid is essential for enhancing crop yields, which aligns with the government’s push towards agricultural modernization and sustainability.
Domestic production of phosphoric acid remains limited, necessitating a significant dependence on imports to satisfy rising demand. Local distributors and international suppliers are competing to capture a share of this growing market, creating a dynamic landscape for stakeholders.
Myanmar Phosphoric Acid Market Key Takeaways
- The market is heavily influenced by agricultural demands, with a strong emphasis on fertilizers.
- Government initiatives are enhancing agricultural productivity, further propelling market growth.
- There is a notable shift towards eco-friendly production methods in response to environmental regulations.
- Investment in infrastructure and logistics is crucial to overcoming domestic production limitations.
- Emerging trends suggest a diversification of applications beyond traditional fertilizers.
Evaluation of Restraints in Myanmar Phosphoric Acid Market
Despite its growth potential, the Myanmar phosphoric acid market faces significant constraints. The limited domestic production capacity necessitates heavy reliance on imports, creating vulnerabilities in the supply chain. Additionally, fluctuations in global pricing can impact local market dynamics. Inadequate infrastructure hampers efficient production and distribution, while ongoing political and economic instability poses further risks to potential investors and market growth. These challenges call for strategic investments and infrastructural improvements to ensure a sustainable market environment.
Myanmar Phosphoric Acid Market Trends
Current trends in the Myanmar phosphoric acid market highlight a growing emphasis on sustainability and environmental responsibility. Producers are increasingly adopting eco-friendly methods for phosphoric acid production, aligning with global standards. Additionally, there is a concerted effort to enhance crop productivity through innovative fertilizer solutions, indicating a shift towards more advanced agricultural practices.
The rise of the food and beverage sector in Myanmar also contributes to an expanding demand for phosphoric acid in food additives and industrial applications. Companies are focusing on product innovation, thereby broadening the applicability of phosphoric acid across various industries.
Myanmar Phosphoric Acid Market Opportunities
Investment opportunities abound in the Myanmar phosphoric acid market, particularly as agricultural and industrial sectors expand. With the government prioritizing agricultural development, investing in local production facilities or distribution channels presents a profitable avenue for investors. Collaborative partnerships with local entities or technology transfer initiatives can also facilitate market entry and capitalize on the increasing demand for phosphoric acid as a crucial ingredient in diverse applications.
Government Initiatives in the Myanmar Phosphoric Acid Market
The Myanmar government is actively shaping the phosphoric acid market through a series of supportive policies. These include regulations aimed at promoting sustainable production practices and quality standards to ensure the safety of phosphoric acid products. Moreover, incentives for research and development are designed to enhance production methods. The government's commitment to reducing environmental impact through waste management guidelines further illustrates its dedication to balancing economic growth with environmental stewardship.
Future Insights of the Myanmar Phosphoric Acid Market
Looking ahead to 2026-2032, the Myanmar phosphoric acid market is positioned for substantial growth. The increasing focus on enhancing agricultural productivity to meet food demands will continue to drive the need for phosphoric acid fertilizers. Industrial growth coupled with infrastructure development is expected to broaden its applications, fostering demand in sectors such as food processing and chemicals. However, addressing environmental concerns and exploring alternative fertilizers will be crucial in shaping the market's trajectory.
Myanmar Phosphoric Acid Market Latest Developments (May 2025 - June 2026)
Recent developments indicate a shift towards more sustainable production practices within Myanmar's phosphoric acid market. As stakeholders emphasize eco-friendly methodologies, new partnerships and technology-sharing agreements are emerging. Additionally, governmental initiatives aimed at improving agricultural infrastructure are gaining momentum, setting the stage for a more robust market environment. The focus on enhancing domestic production capabilities is becoming a priority, as industry players seek to lessen import dependency.
Myanmar Phosphoric Acid Market - Key Attractiveness of the Report
- 10 Years of Market Numbers
- Historical Data Starting from 2022 to 2025
- Base Year: 2025
- Forecast Data until 2032
- Key Performance Indicators Impacting the Market
- Major Upcoming Developments and Projects
Key Highlights of the Report:
- Myanmar Phosphoric Acid Market Outlook
- Market Size of Myanmar Phosphoric Acid Market, 2025
- Forecast of Myanmar Phosphoric Acid Market, 2032
- Historical Data and Forecast of Myanmar Phosphoric Acid Revenues & Volume for the Period 2022-2032F
- Myanmar Phosphoric Acid Market Trend Evolution
- Myanmar Phosphoric Acid Market Drivers and Challenges
- Myanmar Phosphoric Acid Price Trends
- Myanmar Phosphoric Acid Porter's Five Forces
- Myanmar Phosphoric Acid Industry Life Cycle
- Historical Data and Forecast of Myanmar Phosphoric Acid Market Revenues & Volume By Process Type for the Period 2022-2032F
- Historical Data and Forecast of Myanmar Phosphoric Acid Market Revenues & Volume By Wet Process for the Period 2022-2032F
- Historical Data and Forecast of Myanmar Phosphoric Acid Market Revenues & Volume By Thermal Process for the Period 2022-2032F
- Historical Data and Forecast of Myanmar Phosphoric Acid Market Revenues & Volume By Others for the Period 2022-2032F
- Historical Data and Forecast of Myanmar Phosphoric Acid Market Revenues & Volume By Application for the Period 2022-2032F
- Historical Data and Forecast of Myanmar Phosphoric Acid Market Revenues & Volume By Home Cleaning Agents for the Period 2022-2032F
- Historical Data and Forecast of Myanmar Phosphoric Acid Market Revenues & Volume By Fertilizer Chemicals for the Period 2022-2032F
- Historical Data and Forecast of Myanmar Phosphoric Acid Market Revenues & Volume By Fertilizer Type for the Period 2022-2032F
- Historical Data and Forecast of Myanmar Phosphoric Acid Market Revenues & Volume By Mono-Ammonium Phosphate (MAP) for the Period 2022-2032F
- Historical Data and Forecast of Myanmar Phosphoric Acid Market Revenues & Volume By Diammonium Phosphate (DAP) for the Period 2022-2032F
- Historical Data and Forecast of Myanmar Phosphoric Acid Market Revenues & Volume By Triple Superphosphate (TSP) for the Period 2022-2032F
- Historical Data and Forecast of Myanmar Phosphoric Acid Market Revenues & Volume By End-Users for the Period 2022-2032F
- Historical Data and Forecast of Myanmar Phosphoric Acid Market Revenues & Volume By Electronics for the Period 2022-2032F
- Historical Data and Forecast of Myanmar Phosphoric Acid Market Revenues & Volume By Beverage for the Period 2022-2032F
- Historical Data and Forecast of Myanmar Phosphoric Acid Market Revenues & Volume By Medical for the Period 2022-2032F
- Historical Data and Forecast of Myanmar Phosphoric Acid Market Revenues & Volume By Food for the Period 2022-2032F
- Historical Data and Forecast of Myanmar Phosphoric Acid Market Revenues & Volume By Fertilizer for the Period 2022-2032F
- Historical Data and Forecast of Myanmar Phosphoric Acid Market Revenues & Volume By Others for the Period 2022-2032F
- Historical Data and Forecast of Myanmar Phosphoric Acid Market Revenues & Volume By Grade for the Period 2022-2032F
- Historical Data and Forecast of Myanmar Phosphoric Acid Market Revenues & Volume By Food-Grade for the Period 2022-2032F
- Historical Data and Forecast of Myanmar Phosphoric Acid Market Revenues & Volume By Technical Grade for the Period 2022-2032F
- Myanmar Phosphoric Acid Import Export Trade Statistics
- Market Opportunity Assessment By Process Type
- Market Opportunity Assessment By Application
- Market Opportunity Assessment By Fertilizer Type
- Market Opportunity Assessment By End-Users
- Market Opportunity Assessment By Grade
- Myanmar Phosphoric Acid Top Companies Market Share
- Myanmar Phosphoric Acid Competitive Benchmarking By Technical and Operational Parameters
- Myanmar Phosphoric Acid Company Profiles
- Myanmar Phosphoric Acid Key Strategic Recommendations
Myanmar Phosphoric Acid Market - Frequently Asked Questions
The market was estimated at USD 269 Million in 2025 and is anticipated to grow to USD 372 Million by 2032, at a CAGR of 4.7% from 2026 to 2032.
The agricultural sector is the primary consumer of phosphoric acid as a fertilizer ingredient, directly influencing the market's growth through its increasing demand for enhanced crop yields.
The Myanmar government implements policies to encourage sustainable production, regulates quality standards, and offers incentives for research, thus influencing market dynamics and promoting stability.
Key challenges include limited domestic production capacity, reliance on imports, and fluctuating global prices, all of which affect market stability and growth.
Companies are increasingly adopting eco-friendly production methods to comply with environmental regulations, focusing on sustainability to mitigate the environmental impacts of phosphate mining and production.
Opportunities include establishing local production facilities, forming partnerships with local players, and leveraging technology transfer agreements to meet the rising demand in agriculture and industrial sectors.
6Wresearch actively monitors the Myanmar Phosphoric Acid Market and publishes its comprehensive annual report, highlighting emerging trends, growth drivers, revenue analysis, and forecast outlook. Our insights help businesses to make data-backed strategic decisions with ongoing market dynamics. Our analysts track relevent industries related to the Myanmar Phosphoric Acid Market, allowing our clients with actionable intelligence and reliable forecasts tailored to emerging regional needs.
Yes, we provide customisation as per your requirements. To learn more, feel free to contact us on sales@6wresearch.com
Myanmar Phosphoric Acid |
1 Executive Summary |
2 Introduction |
2.1 Key Highlights of the Report |
2.2 Report Description |
2.3 Market Scope & Segmentation |
2.4 Research Methodology |
2.5 Assumptions |
3 Myanmar Phosphoric Acid Market Overview |
3.1 Myanmar Country Macro Economic Indicators |
3.2 Myanmar Phosphoric Acid Market Revenues & Volume, 2022 & 2032F |
3.3 Myanmar Phosphoric Acid Market - Industry Life Cycle |
3.4 Myanmar Phosphoric Acid Market - Porter's Five Forces |
3.5 Myanmar Phosphoric Acid Market Revenues & Volume Share, By Process Type, 2022 & 2032F |
3.6 Myanmar Phosphoric Acid Market Revenues & Volume Share, By Form, 2022 & 2032F |
3.7 Myanmar Phosphoric Acid Market Revenues & Volume Share, By Fertilizer Type, 2022 & 2032F |
3.8 Myanmar Phosphoric Acid Market Revenues & Volume Share, By End-Users, 2022 & 2032F |
3.9 Myanmar Phosphoric Acid Market Revenues & Volume Share, By Grade, 2022 & 2032F |
4 Myanmar Phosphoric Acid Market Dynamics |
4.1 Impact Analysis |
4.2 Market Drivers |
4.3 Market Restraints |
5 Myanmar Phosphoric Acid Market Trends |
6 Myanmar Phosphoric Acid Market, By Types |
6.1 Myanmar Phosphoric Acid Market, By Process Type |
6.1.1 Overview and Analysis |
6.1.2 Myanmar Phosphoric Acid Market Revenues & Volume, By Process Type, 2022-2032F |
6.1.3 Myanmar Phosphoric Acid Market Revenues & Volume, By Wet Process, 2022-2032F |
6.1.4 Myanmar Phosphoric Acid Market Revenues & Volume, By Thermal Process, 2022-2032F |
6.1.5 Myanmar Phosphoric Acid Market Revenues & Volume, By Others, 2022-2032F |
6.2 Myanmar Phosphoric Acid Market, By Application |
6.2.1 Overview and Analysis |
6.2.2 Myanmar Phosphoric Acid Market Revenues & Volume, By Home Cleaning Agents, 2022-2032F |
6.2.3 Myanmar Phosphoric Acid Market Revenues & Volume, By Fertilizer Chemicals, 2022-2032F |
6.3 Myanmar Phosphoric Acid Market, By Fertilizer Type |
6.3.1 Overview and Analysis |
6.3.2 Myanmar Phosphoric Acid Market Revenues & Volume, By Mono-Ammonium Phosphate (MAP), 2022-2032F |
6.3.3 Myanmar Phosphoric Acid Market Revenues & Volume, By Diammonium Phosphate (DAP), 2022-2032F |
6.3.4 Myanmar Phosphoric Acid Market Revenues & Volume, By Triple Superphosphate (TSP), 2022-2032F |
6.4 Myanmar Phosphoric Acid Market, By End-Users |
6.4.1 Overview and Analysis |
6.4.2 Myanmar Phosphoric Acid Market Revenues & Volume, By Electronics, 2022-2032F |
6.4.3 Myanmar Phosphoric Acid Market Revenues & Volume, By Beverage, 2022-2032F |
6.4.4 Myanmar Phosphoric Acid Market Revenues & Volume, By Medical, 2022-2032F |
6.4.5 Myanmar Phosphoric Acid Market Revenues & Volume, By Food, 2022-2032F |
6.4.6 Myanmar Phosphoric Acid Market Revenues & Volume, By Fertilizer, 2022-2032F |
6.4.7 Myanmar Phosphoric Acid Market Revenues & Volume, By Others, 2022-2032F |
6.5 Myanmar Phosphoric Acid Market, By Grade |
6.5.1 Overview and Analysis |
6.5.2 Myanmar Phosphoric Acid Market Revenues & Volume, By Food-Grade, 2022-2032F |
6.5.3 Myanmar Phosphoric Acid Market Revenues & Volume, By Technical Grade, 2022-2032F |
7 Myanmar Phosphoric Acid Market Import-Export Trade Statistics |
7.1 Myanmar Phosphoric Acid Market Export to Major Countries |
7.2 Myanmar Phosphoric Acid Market Imports from Major Countries |
8 Myanmar Phosphoric Acid Market Key Performance Indicators |
9 Myanmar Phosphoric Acid Market - Opportunity Assessment |
9.1 Myanmar Phosphoric Acid Market Opportunity Assessment, By Process Type, 2022 & 2032F |
9.2 Myanmar Phosphoric Acid Market Opportunity Assessment, By Application, 2022 & 2032F |
9.3 Myanmar Phosphoric Acid Market Opportunity Assessment, By Fertilizer Type, 2022 & 2032F |
9.4 Myanmar Phosphoric Acid Market Opportunity Assessment, By End-Users, 2022 & 2032F |
9.5 Myanmar Phosphoric Acid Market Opportunity Assessment, By Grade, 2022 & 2032F |
10 Myanmar Phosphoric Acid Market - Competitive Landscape |
10.1 Myanmar Phosphoric Acid Market Revenue Share, By Companies, 2025 |
10.2 Myanmar Phosphoric Acid Market Competitive Benchmarking, By Operating and Technical Parameters |
11 Company Profiles |
12 Recommendations |
13 Disclaimer |
Global Go To Market Strategy - 2030
Export potential enables firms to identify high-growth global markets with greater confidence by combining advanced trade intelligence with a structured quantitative methodology. The framework analyzes emerging demand trends and country-level import patterns while integrating macroeconomic and trade datasets such as GDP and population forecasts, bilateral import–export flows, tariff structures, elasticity differentials between developed and developing economies, geographic distance, and import demand projections. Using weighted trade values from 2020–2024 as the base period to project country-to-country export potential for 2030, these inputs are operationalized through calculated drivers such as gravity model parameters, tariff impact factors, and projected GDP per-capita growth. Through an analysis of hidden potentials, demand hotspots, and market conditions that are most favorable to success, this method enables firms to focus on target countries, maximize returns, and global expansion with data, backed by accuracy.
By factoring in the projected importer demand gap that is currently unmet and could be potential opportunity, it identifies the potential for the Exporter (Country) among 190 countries, against the general trade analysis, which identifies the biggest importer or exporter.
To discover high-growth global markets and optimize your business strategy:
Click Here
Pricing
- Single User License$ 1,995
- Department License$ 2,400
- Site License$ 3,120
- Global License$ 3,795

Leadership Perspectives from Industry Events
Search
Thought Leadership and Analyst Meet


Our Clients
6WResearch In News
- India Air Conditioner Market Set for Strong Rebound in 2026 After Weather-Led Correction and GST-Driven Recovery: 6Wresearch
- ADAS in India: How Automatic Emergency Braking, Blind Spot Detection & Driver Monitoring are Transforming Road Safety
- Doha a strategic location for EV manufacturing hub: IPA Qatar
- Demand for luxury TVs surging in the GCC, says Samsung
- Empowering Growth: The Thriving Journey of Bangladesh’s Cable Industry
- Demand for luxury TVs surging in the GCC, says Samsung
Latest Reports
- Nicaragua RPG Gaming Market (2026-2032)
- New Zealand RPG Gaming Market (2026-2032)
- Netherlands RPG Gaming Market (2026-2032)
- Nauru RPG Gaming Market (2026-2032)
- Namibia RPG Gaming Market (2026-2032)
- Mozambique RPG Gaming Market (2026-2032)
- Montenegro RPG Gaming Market (2026-2032)
- Mongolia RPG Gaming Market (2026-2032)
- Monaco RPG Gaming Market (2026-2032)
- Micronesia RPG Gaming Market (2026-2032)
Industry Events and Analyst Meet

EV India Expo 2026

HIMTEX 2026

India Refining Summit 2026

India EV Show 2026

EV tech India Expo 2026
Whitepaper
- Middle East & Africa Commercial Security Market Click here to view more.
- Middle East & Africa Fire Safety Systems & Equipment Market Click here to view more.
- GCC Drone Market Click here to view more.
- Middle East Lighting Fixture Market Click here to view more.
- GCC Physical & Perimeter Security Market Click here to view more.