Myanmar Physical Security Market Size & Growth Rate (2026-2032)
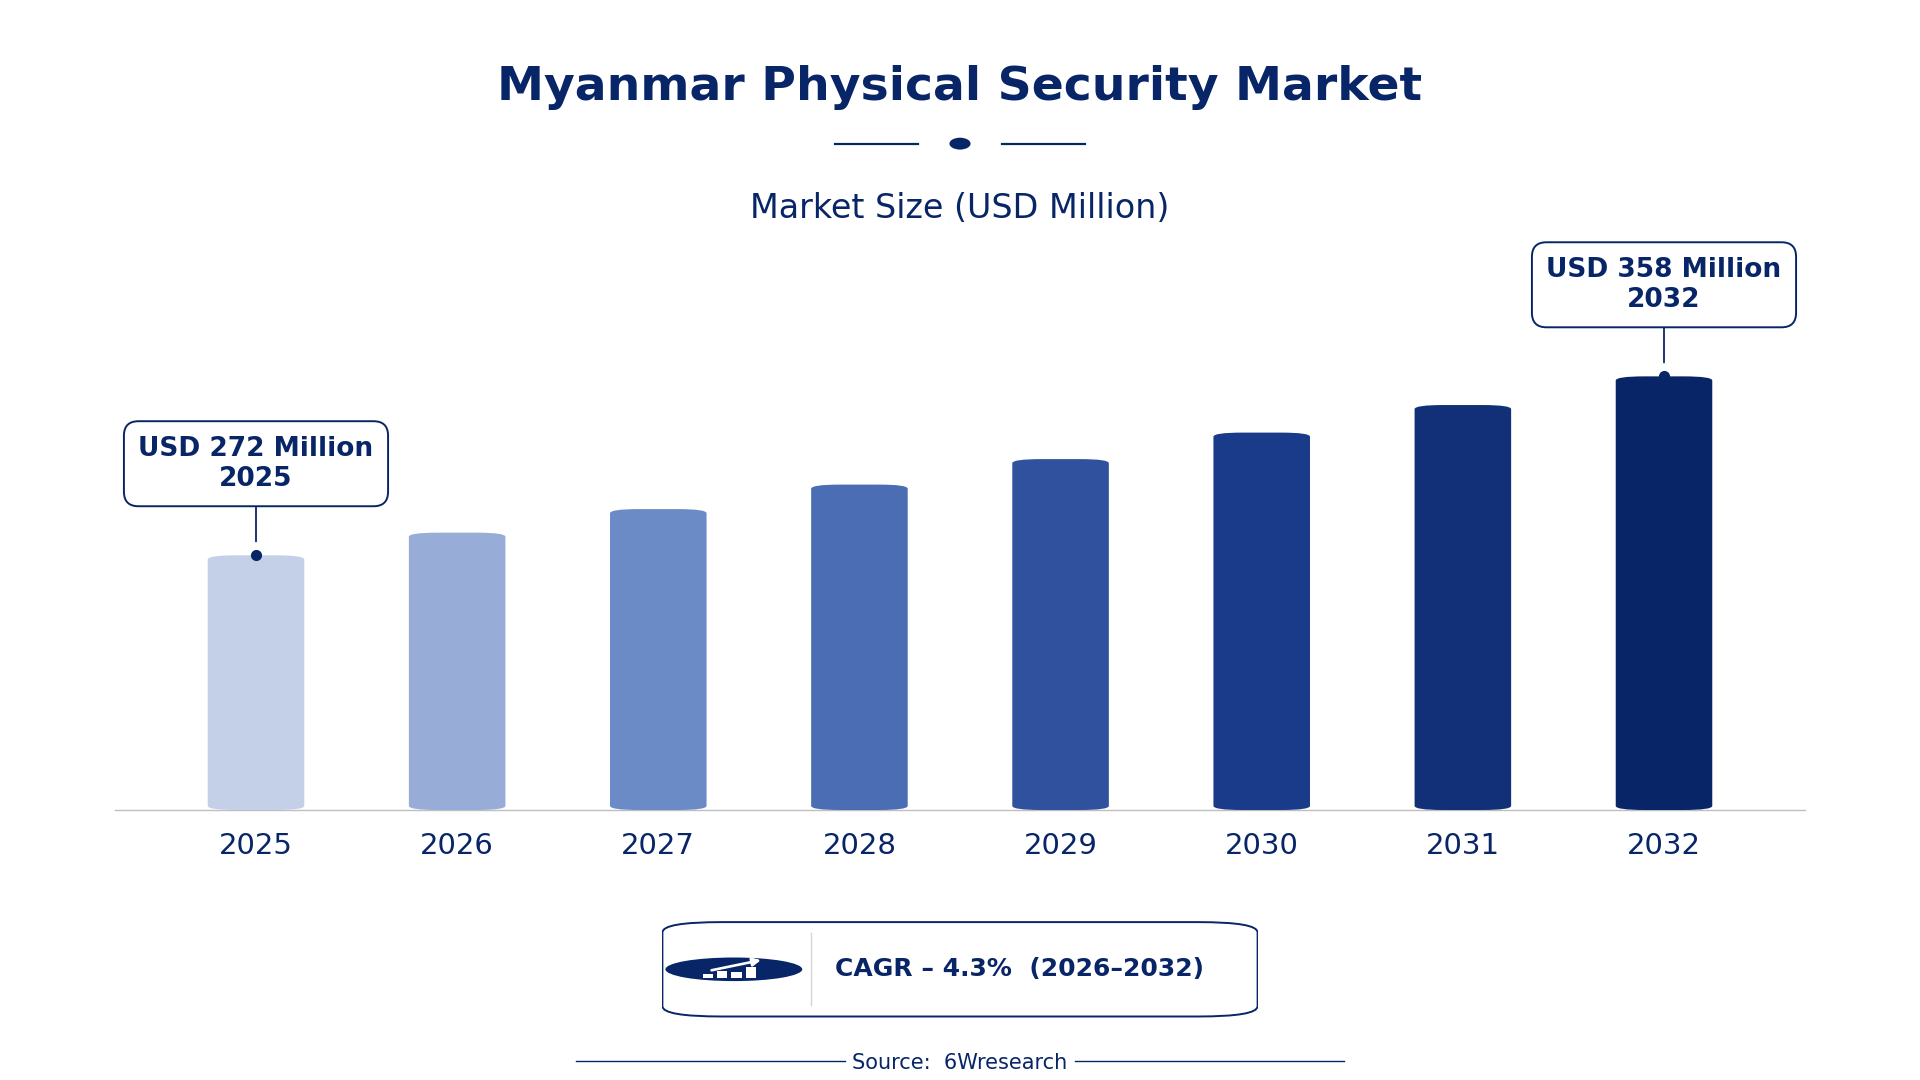
The Myanmar Physical Security Market was estimated at USD 272 Million in 2025 and is projected to reach USD 358 Million by 2032, growing at a CAGR of 4.3% from 2026 to 2032.
Myanmar Physical Security Market Synopsis
The demand for physical security solutions in Myanmar is witnessing a notable increase as businesses and institutions recognize the necessity of safeguarding assets and personnel. This awareness is driven by rising urbanization, infrastructure development, and the urgent need for enhanced safety protocols in various sectors, including residential, commercial, and governmental.
As the country grapples with security challenges, there’s a marked shift towards advanced security technologies. The integration of AI in surveillance systems and the growing preference for cloud-based solutions are transforming how security is implemented, catering to the evolving needs of the Myanmar market.
Myanmar Physical Security Market Year-wise Growth Rate and Key Drivers
This graph illustrates the annual growth rates of the Myanmar Physical Security Market from 2021 to 2032, highlighting a steady upward trajectory and projected expansion over the forecast period.
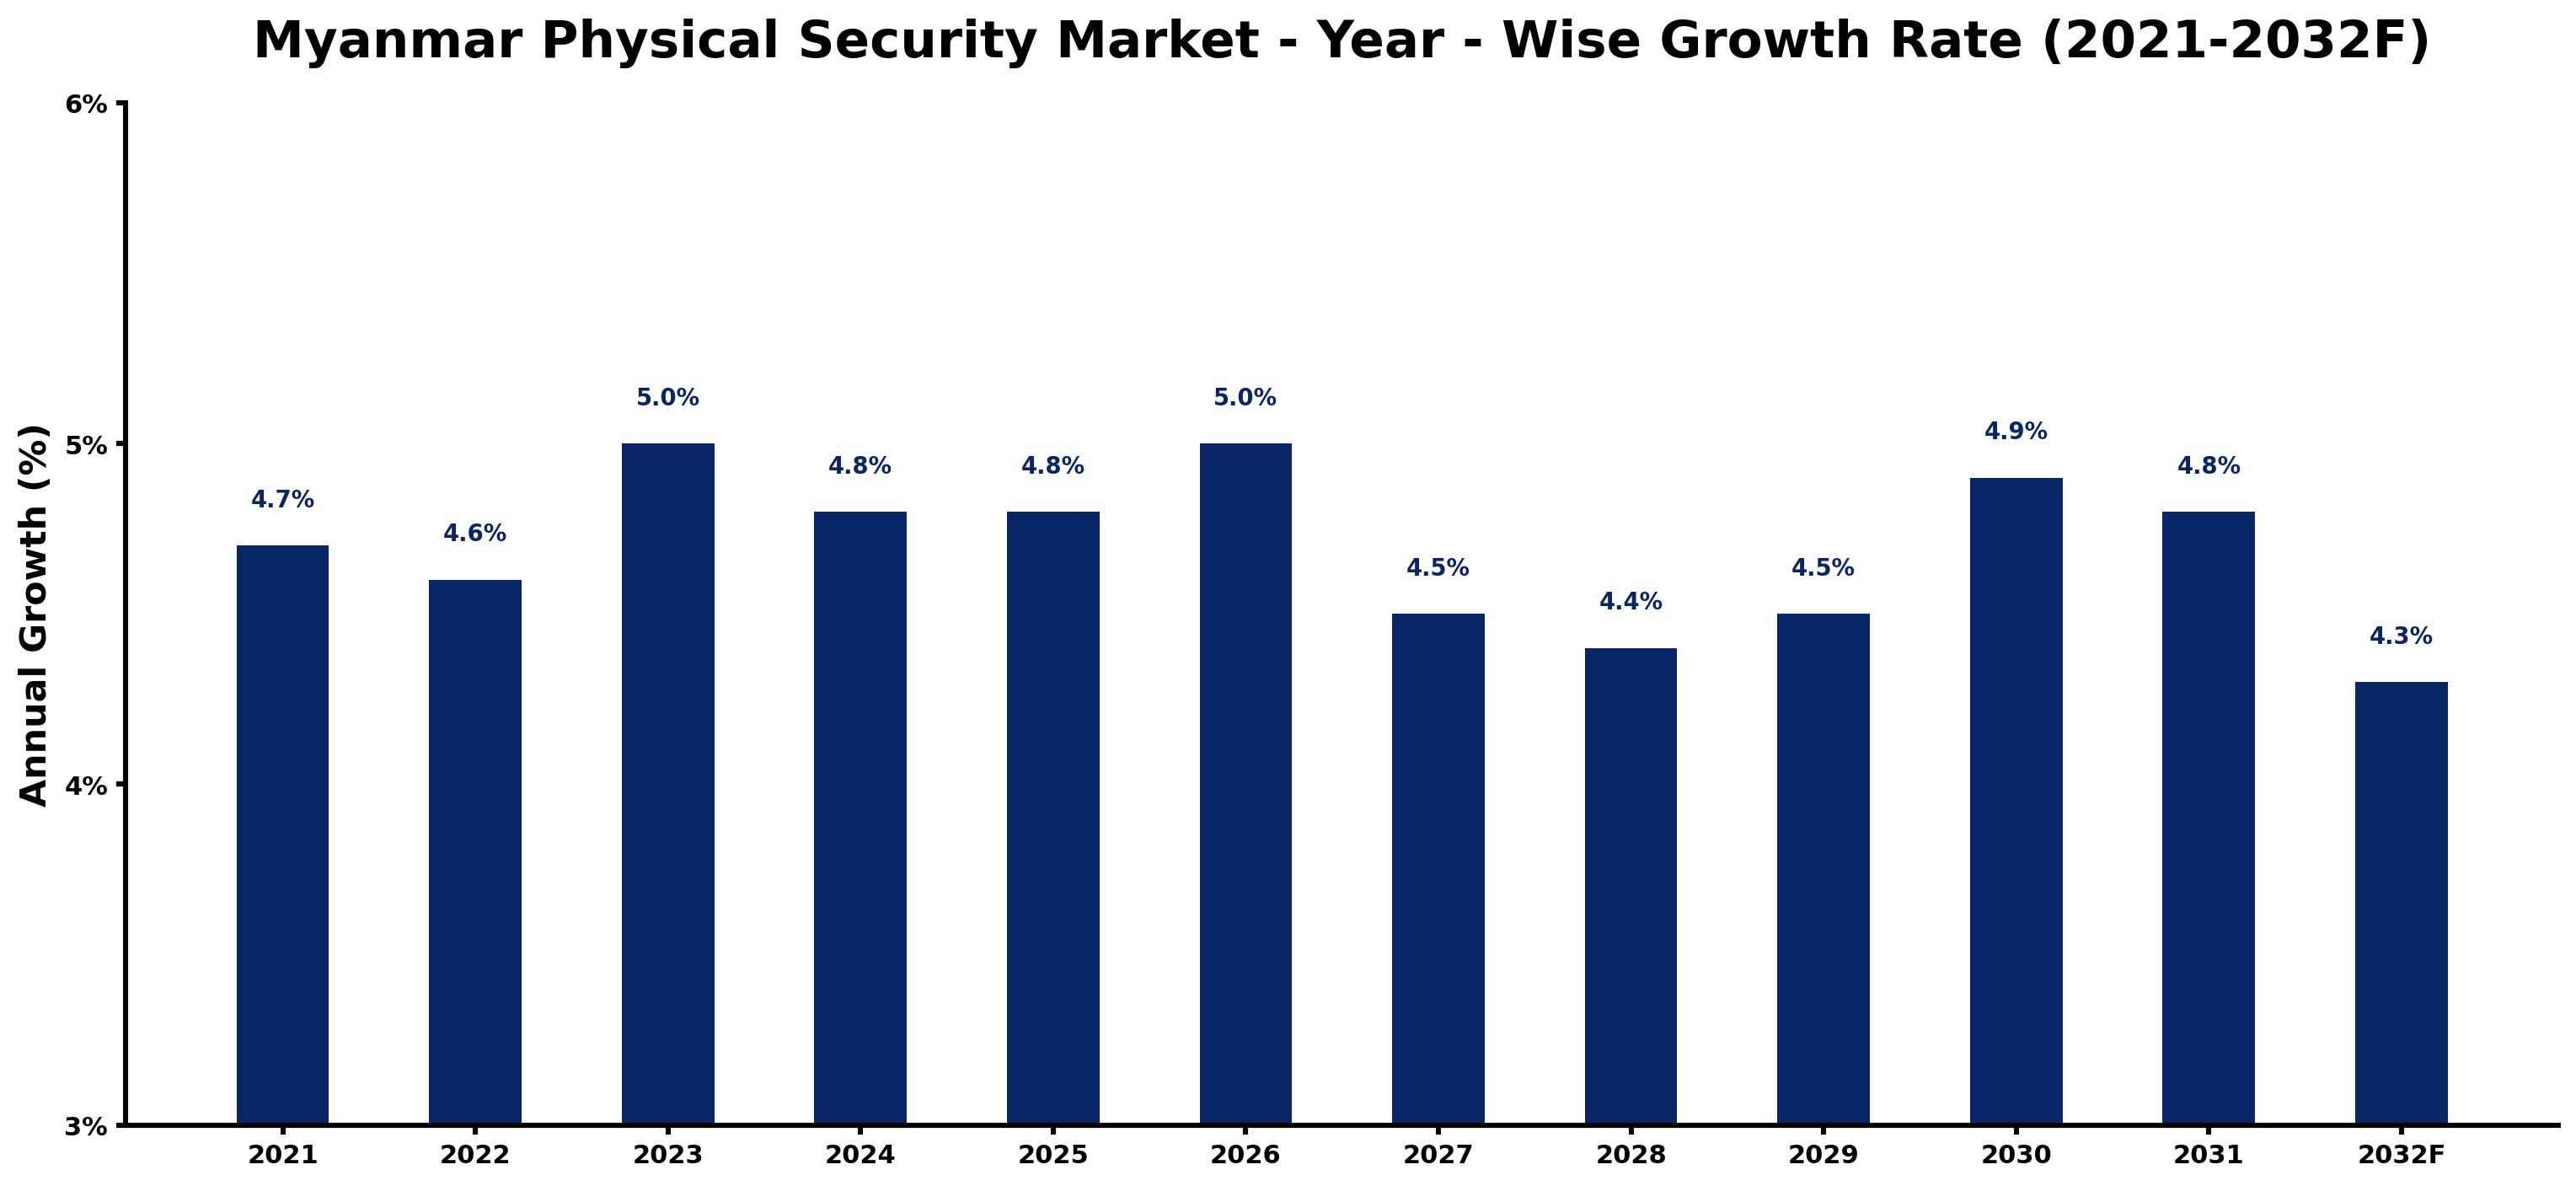
The table below presents the year‑wise growth rates along with the key drivers influencing the market
| Year | Growth Rate | Major Drivers |
| 2021 | 4.7% | Increased insurgent activity prompting heightened security investments. |
| 2022 | 4.6% | Government focus on foreign investments enhancing security protocols. |
| 2023 | 5.0% | Growing urbanization leading to heightened security service demand. |
| 2024 | 4.8% | Rising concerns over civil unrest driving security technology adoption. |
| 2025 | 4.8% | Government urban redevelopment projects necessitating advanced security measures. |
| 2026 | 5.0% | Strengthened regulations on security personnel training requirements. |
| 2027 | 4.5% | International events boosting demand for high-security venues. |
| 2028 | 4.4% | Increased cross-border trade demands better security infrastructure. |
| 2029 | 4.5% | Partnerships with global security firms enhancing local capabilities. |
| 2030 | 4.9% | Proliferation of digital payment methods creating security needs. |
| 2031 | 4.8% | Growing awareness of personal security urging market growth. |
| 2032 | 4.3% | Emerging local companies innovating affordable security solutions. |
Note: Market size estimations and growth projections presented in this report are based on 6Wresearch's proprietary forecasting methodology, utilizing the latest available industry data, government publications, and primary research inputs.
Myanmar Physical Security Market Key Takeaways
Below are some of the specific key takeaways from the market, including:
- The market is fueled by increasing urbanization and infrastructure investments, necessitating sophisticated security measures.
- There is a trend towards integrated security systems that combine various technologies for comprehensive protection.
- Government initiatives are enhancing regulatory frameworks, fostering public-private collaboration to elevate security standards.
- Emerging technologies, particularly biometric systems, are gaining traction as key tools for ensuring safety.
- Investment opportunities are abundant in video surveillance, access control, and cybersecurity technologies.
Evaluation of Restraints in Myanmar Physical Security Market
Several factors are constraining the growth of the Myanmar Physical Security Market. A prevalent lack of awareness about the significance of physical security often deters businesses from investing in necessary measures. on top of that, the country struggles with limited access to advanced technologies and an infrastructure that is not fully equipped to implement modern security solutions effectively. The regulatory environment also presents challenges, often complicating compliance for companies. Coupled with the ongoing political instability, these elements create a challenging backdrop for market participants seeking to establish a foothold in this developing sector.
Myanmar Physical Security Market Trends
The Myanmar Physical Security Market is witnessing a clear trend toward smarter and more interconnected security solutions. Integration of surveillance, access control, and intrusion detection systems is becoming common as businesses demand comprehensive protection from various security threats. Additionally, the adoption of biometric technologies, such as facial recognition, is on the rise, providing enhanced security capabilities. There is also a growing emphasis on cybersecurity, as companies recognize the importance of protecting digital assets alongside physical security measures.
Myanmar Physical Security Market Opportunities
Investors and businesses looking to enter the Myanmar Physical Security Market have several promising opportunities. The burgeoning demand for high-quality video surveillance systems and advanced access control solutions offers significant avenues for growth. Additionally, the government's focus on infrastructure development and urbanization projects creates a ripe environment for innovative security technologies that can safeguard public spaces and private assets. By collaborating with local firms and tailoring solutions to meet specific market needs, investors can capitalize on this emerging sector.
Government Initiatives in the Myanmar Physical Security Market
Government policies are playing a crucial role in shaping the Myanmar Physical Security Market. Recent regulatory frameworks focus on enhancing safety measures and ensuring public security through technology and collaboration. The government recognizes the necessity of improving security standards to attract foreign investment and foster a safe environment for businesses and residents alike.
- A new regulatory framework was introduced in 2025 to enhance the quality and installation of CCTV systems across urban centers.
- Currently ongoing is a public-private partnership initiative aimed at developing a nationwide surveillance system to bolster security in key infrastructure projects.
- There is a planned rollout of a national digital security upgrade program expected to begin in mid-2026, aimed at improving cybersecurity measures across sectors.
- A recently launched campaign promotes awareness about the importance of physical security, targeting small and medium-sized enterprises.
- Upcoming guidelines will standardize security equipment quality to ensure effectiveness and compliance with international standards.
Future Insights of the Myanmar Physical Security Market
Looking ahead to 2026-2032, the Myanmar Physical Security Market is set for continued growth as awareness and investments in security systems rise. The increasing focus on safety measures from both the government and private sectors will drive demand for sophisticated technologies. As urban areas expand and infrastructure projects unfold, the requirement for effective security solutions will only intensify. While challenges persist, particularly in regulatory compliance and market entry, the overall outlook remains positive for proactive stakeholders ready to innovate and adapt.
Myanmar Physical Security Market Latest Developments
The Myanmar Physical Security Market has seen several noteworthy developments over the past year. Key industry players are increasingly investing in advanced technology and innovative solutions to meet the growing demand for security. This activity reflects a commitment to enhancing safety measures across various sectors and adapting to the emerging needs of the market.
- A major technology vendor launched a new cloud-based surveillance solution in early 2025, designed to provide businesses with flexible and scalable security options.
- A partnership between two leading regional firms was established in Q3 2025 to develop integrated security systems that combine video monitoring with intrusion detection technologies.
- Ongoing initiatives to upgrade urban surveillance infrastructure began in early 2025, focusing on high-crime areas to enhance public safety.
- An upcoming launch of a biometric access control system is planned for late 2026, aiming to improve security in commercial spaces.
- A service upgrade to enhance the cybersecurity framework of existing physical security systems is currently underway and expected to complete by mid-2026.
Myanmar Physical Security Market - Key Attractiveness of the Report
- 10 Years of Market Numbers
- Historical Data Starting from 2022 to 2025
- Base Year: 2025
- Forecast Data until 2032
- Key Performance Indicators Impacting the Market
- Major Upcoming Developments and Projects
Key Highlights of the Report:
- Myanmar Physical Security Market Outlook
- Market Size of Myanmar Physical Security Market, 2025
- Forecast of Myanmar Physical Security Market, 2032
- Historical Data and Forecast of Myanmar Physical Security Revenues & Volume for the Period 2022-2032F
- Myanmar Physical Security Market Trend Evolution
- Myanmar Physical Security Market Drivers and Challenges
- Myanmar Physical Security Price Trends
- Myanmar Physical Security Porter's Five Forces
- Myanmar Physical Security Industry Life Cycle
- Historical Data and Forecast of Myanmar Physical Security Market Revenues & Volume By Component for the Period 2022-2032F
- Historical Data and Forecast of Myanmar Physical Security Market Revenues & Volume By Systems (PACS, PSIM, PIAM, Video Surveillance, Fire and Life Safety) for the Period 2022-2032F
- Historical Data and Forecast of Myanmar Physical Security Market Revenues & Volume By Services for the Period 2022-2032F
- Historical Data and Forecast of Myanmar Physical Security Market Revenues & Volume By Vertical for the Period 2022-2032F
- Historical Data and Forecast of Myanmar Physical Security Market Revenues & Volume By BFSI for the Period 2022-2032F
- Historical Data and Forecast of Myanmar Physical Security Market Revenues & Volume By Government for the Period 2022-2032F
- Historical Data and Forecast of Myanmar Physical Security Market Revenues & Volume By Retail for the Period 2022-2032F
- Historical Data and Forecast of Myanmar Physical Security Market Revenues & Volume By Transportation for the Period 2022-2032F
- Historical Data and Forecast of Myanmar Physical Security Market Revenues & Volume By Residential for the Period 2022-2032F
- Historical Data and Forecast of Myanmar Physical Security Market Revenues & Volume By Telecom and IT for the Period 2022-2032F
- Historical Data and Forecast of Myanmar Physical Security Market Revenues & Volume By Other Verticals (Healthcare, Manufacturing, Energy and Utilities, and Education). for the Period 2022-2032F
- Historical Data and Forecast of Myanmar Physical Security Market Revenues & Volume By Organization Size for the Period 2022-2032F
- Historical Data and Forecast of Myanmar Physical Security Market Revenues & Volume By SMEs for the Period 2022-2032F
- Historical Data and Forecast of Myanmar Physical Security Market Revenues & Volume By Large Enterprises for the Period 2022-2032F
- Myanmar Physical Security Import Export Trade Statistics
- Market Opportunity Assessment By Component
- Market Opportunity Assessment By Vertical
- Market Opportunity Assessment By Organization Size
- Myanmar Physical Security Top Companies Market Share
- Myanmar Physical Security Competitive Benchmarking By Technical and Operational Parameters
- Myanmar Physical Security Company Profiles
- Myanmar Physical Security Key Strategic Recommendations






































