Myanmar Silica Sand For Glass Making Market (2026-2032) Outlook | Trends, Share, Analysis, Size, Industry, Growth, Companies, Revenue, Value & Forecast
Market Forecast By Application (Flat Glass, Fiber Glass, Glass Containers, Special & Technical, Tableware Glass, Others), By Purity (High Purity, Ultra High Purity) And Competitive Landscape
| Product Code: ETC346594 | Publication Date: Aug 2022 | Updated Date: Jul 2026 | Product Type: Market Research Report | |
| Publisher: 6Wresearch | Author: Sumit Sagar | No. of Pages: 75 | No. of Figures: 35 | No. of Tables: 20 |
Myanmar Silica Sand For Glass Making Market Size, Share & Growth Rate
The Myanmar Silica Sand For Glass Making Market was estimated at USD 916 Million in 2025 and is projected to reach USD 1308 Million by 2032, growing at a CAGR of 5.2% from 2026 to 2032. This growth is primarily fueled by the robust demand from the construction and automotive sectors, which are increasingly incorporating glass products into their offerings. Additionally, infrastructure development projects across Myanmar are intensifying, creating a ripple effect in the silica sand market as builders seek reliable and quality materials for glass manufacturing.
Myanmar Silica Sand For Glass Making Market Year-wise Growth Rate and Key Drivers
This graph highlights how the Myanmar Silica Sand For Glass Making Market has steadily grown over the years, supported by major growth factors.
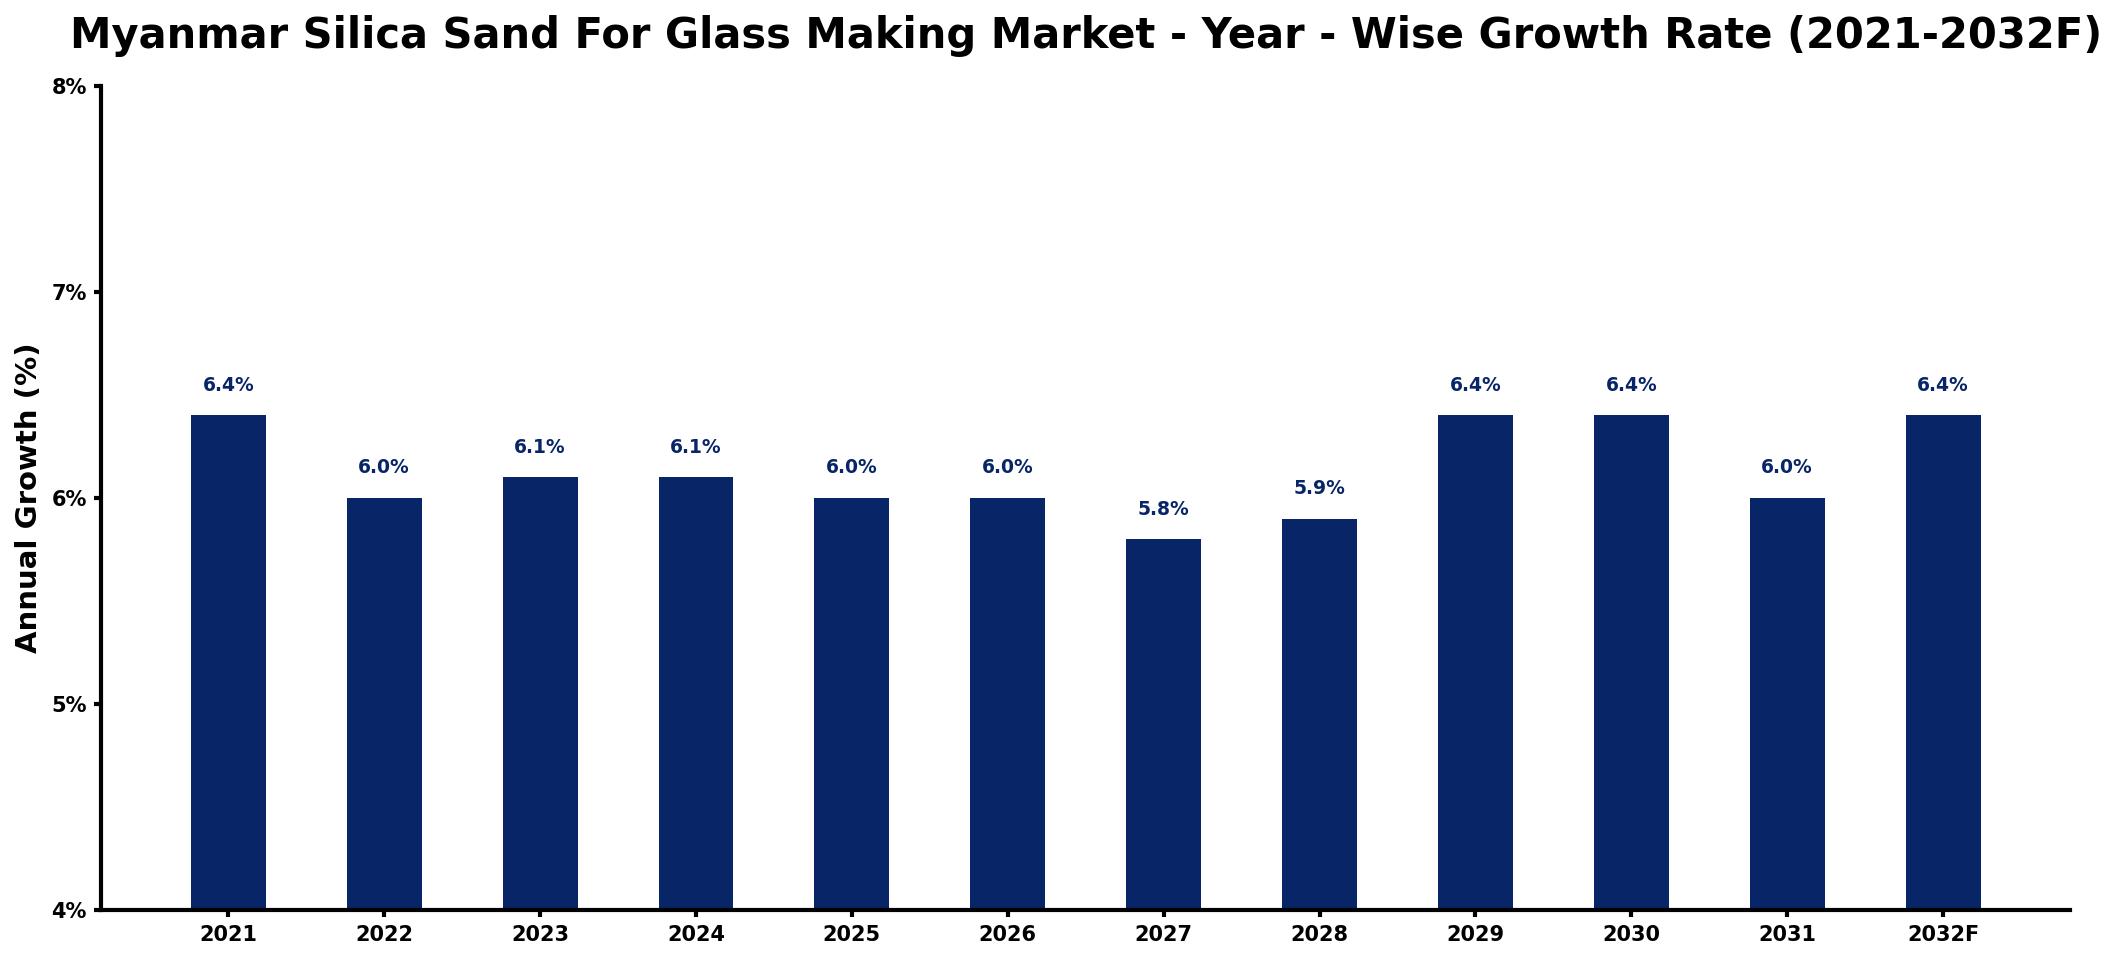
The table below presents the year‑wise growth rates along with the key drivers influencing the market
| Year | Growth Rate | Major Drivers |
| 2021 | 6.4% | Rising construction sector demand |
| 2022 | 6.0% | Increased infrastructure investment projects |
| 2023 | 6.1% | Growing export opportunities abroad |
| 2024 | 6.1% | Strengthened regional trade partnerships |
| 2025 | 6.0% | Surge in manufacturing activities |
| 2026 | 6.0% | Expansion of local industries |
| 2027 | 5.8% | Diversification into new applications |
| 2028 | 5.9% | Increased domestic consumption rates |
| 2029 | 6.4% | Emerging market potential recognized |
| 2030 | 6.4% | Technological advancements in production |
| 2031 | 6.0% | Boost in sector collaboration efforts |
| 2032 | 6.4% | Sustainable sourcing initiatives growing |
Note: Market size estimations and growth projections presented in this report are based on 6Wresearch's proprietary forecasting methodology, utilizing the latest available industry data, government publications, and primary research inputs.
Myanmar Silica Sand For Glass Making Market Synopsis
Myanmar's silica sand is distinguished by its exceptional purity and quality, making it a vital resource for glass manufacturers. The local industry is leveraging these natural advantages to cater to both domestic and international demands, thereby enhancing its competitive positioning in the global market.
As urbanization accelerates, the demand for sustainable glass products is rising. Manufacturers are shifting towards eco-friendly methods of silica sand extraction and processing, aligning with global trends in sustainability. This evolving landscape is expected to drive further innovation and investment in the Myanmar silica sand market.
Myanmar Silica Sand For Glass Making Market Key Takeaways
- Myanmar possesses abundant high-quality silica sand reserves ideal for glass production.
- The market is expanding, driven by rising demand from construction, automotive, and electronics industries.
- Sustainable extraction practices are gaining traction as environmental concerns become more pronounced.
- Increased investment in infrastructure projects is propelling market growth.
- Regulatory frameworks are being established to ensure responsible mining and production practices.
Evaluation of Restraints in Myanmar Silica Sand For Glass Making Market
While the Myanmar silica sand market shows promise, it faces significant constraints that could hamper growth. Limited infrastructure poses challenges for efficient extraction and transportation, while inconsistent quality control can undermine the suitability of silica sand for glass production. Environmental concerns, particularly regarding deforestation and water pollution associated with extraction activities, are pressing issues that demand immediate attention. Furthermore, regulatory ambiguities may lead to uncertainties for investors and stakeholders, potentially affecting market stability.
Myanmar Silica Sand For Glass Making Market Trends
The market is witnessing a shift towards greener practices, with companies increasingly adopting environmentally friendly extraction and processing methods. Technological advancements are also shaping the industry, allowing for improved extraction techniques that enhance product quality while minimizing environmental impact. Additionally, as consumer preferences evolve towards specialty glass used in advanced applications like solar panels and electronics, there is a growing demand for innovative glass solutions that utilize high-quality silica sand.
Myanmar Silica Sand For Glass Making Market Opportunities
Investment opportunities in the Myanmar silica sand for glass making market are promising, particularly in developing extraction and processing facilities. By capitalizing on the countrys high-quality silica deposits, investors can align with the burgeoning demand for glass products across various industries. Moreover, enhancing infrastructure for efficient transportation and collaborating with local stakeholders can pave the way for sustainable growth, ensuring long-term profitability and operational success.
Government Initiatives in the Myanmar Silica Sand For Glass Making Market
The Myanmar government is actively implementing regulations to promote sustainable extraction and processing of silica sand. Companies are required to secure permits for mining operations, adhering to strict guidelines concerning environmental impact assessments and reclamation efforts. These initiatives aim to mitigate environmental degradation while fostering local value addition in the silica sand industry, thereby aligning with broader sustainable development goals within the country.
Future Insights of the Myanmar Silica Sand For Glass Making Market
Looking ahead to 2026-2032, the Myanmar Silica Sand for Glass Making Market is poised for substantial growth driven by ongoing industrial development and rising glass product demand. The rich reserves of high-quality silica sand will be a key asset as local producers seek to establish a stronger foothold in global markets. Additionally, the increasing focus on sustainability and advancements in glass technology will likely spur new opportunities, allowing Myanmar to emerge as a prominent player in the silica sand sector.
Myanmar Silica Sand For Glass Making Market Latest Developments (2025 - 2026)
Recent developments in the Myanmar silica sand market indicate a growing emphasis on environmentally sustainable extraction practices. Industry stakeholders are increasingly collaborating with governmental bodies to navigate the regulatory landscape effectively. There has also been a noticeable uptick in investments aimed at modernizing processing facilities to enhance product quality and efficiency, reflecting a broader trend towards innovation in the region.
Myanmar Silica Sand For Glass Making Market - Key Attractiveness of the Report
- 10 Years of Market Numbers
- Historical Data Starting from 2022 to 2025
- Base Year: 2025
- Forecast Data until 2032
- Key Performance Indicators Impacting the Market
- Major Upcoming Developments and Projects
Key Highlights of the Report:
- Myanmar Silica Sand For Glass Making Market Outlook
- Market Size of Myanmar Silica Sand For Glass Making Market, 2025
- Forecast of Myanmar Silica Sand For Glass Making Market, 2032
- Historical Data and Forecast of Myanmar Silica Sand For Glass Making Revenues & Volume for the Period 2022-2032F
- Myanmar Silica Sand For Glass Making Market Trend Evolution
- Myanmar Silica Sand For Glass Making Market Drivers and Challenges
- Myanmar Silica Sand For Glass Making Price Trends
- Myanmar Silica Sand For Glass Making Porter's Five Forces
- Myanmar Silica Sand For Glass Making Industry Life Cycle
- Historical Data and Forecast of Myanmar Silica Sand For Glass Making Market Revenues & Volume By Application for the Period 2022-2032F
- Historical Data and Forecast of Myanmar Silica Sand For Glass Making Market Revenues & Volume By Flat Glass for the Period 2022-2032F
- Historical Data and Forecast of Myanmar Silica Sand For Glass Making Market Revenues & Volume By Fiber Glass for the Period 2022-2032F
- Historical Data and Forecast of Myanmar Silica Sand For Glass Making Market Revenues & Volume By Glass Containers for the Period 2022-2032F
- Historical Data and Forecast of Myanmar Silica Sand For Glass Making Market Revenues & Volume By Special & Technical for the Period 2022-2032F
- Historical Data and Forecast of Myanmar Silica Sand For Glass Making Market Revenues & Volume By Tableware Glass for the Period 2022-2032F
- Historical Data and Forecast of Myanmar Silica Sand For Glass Making Market Revenues & Volume By Others for the Period 2022-2032F
- Historical Data and Forecast of Myanmar Silica Sand For Glass Making Market Revenues & Volume By Purity for the Period 2022-2032F
- Historical Data and Forecast of Myanmar Silica Sand For Glass Making Market Revenues & Volume By High Purity for the Period 2022-2032F
- Historical Data and Forecast of Myanmar Silica Sand For Glass Making Market Revenues & Volume By Ultra High Purity for the Period 2022-2032F
- Myanmar Silica Sand For Glass Making Import Export Trade Statistics
- Market Opportunity Assessment By Application
- Market Opportunity Assessment By Purity
- Myanmar Silica Sand For Glass Making Top Companies Market Share
- Myanmar Silica Sand For Glass Making Competitive Benchmarking By Technical and Operational Parameters
- Myanmar Silica Sand For Glass Making Company Profiles
- Myanmar Silica Sand For Glass Making Key Strategic Recommendations
Frequently Asked Questions About the Market Study (FAQs):
The Myanmar Silica Sand For Glass Making Market was estimated at USD 916 Million in 2025 and is projected to reach USD 1308 Million by 2032, growing at a CAGR of 5.2% from 2026 to 2032.
The rapid pace of urbanization is significantly increasing the demand for construction materials, including glass products, thus driving the need for high-quality silica sand.
There is a growing focus on sustainable extraction methods, with companies adopting eco-friendly practices in silica sand processing to minimize environmental impact.
The construction, automotive, and electronics industries are the primary consumers of silica sand, utilizing it for various glass products.
The government requires companies to obtain permits for mining operations, enforcing guidelines that include environmental impact assessments and reclamation plans to ensure sustainable practices.
6Wresearch actively monitors the Myanmar Silica Sand For Glass Making Market and publishes its comprehensive annual report, highlighting emerging trends, growth drivers, revenue analysis, and forecast outlook. Our insights help businesses to make data-backed strategic decisions with ongoing market dynamics. Our analysts track relevent industries related to the Myanmar Silica Sand For Glass Making Market, allowing our clients with actionable intelligence and reliable forecasts tailored to emerging regional needs.
Yes, we provide customisation as per your requirements. To learn more, feel free to contact us on sales@6wresearch.com
1 Executive Summary |
2 Introduction |
2.1 Key Highlights of the Report |
2.2 Report Description |
2.3 Market Scope & Segmentation |
2.4 Research Methodology |
2.5 Assumptions |
3 Myanmar Silica Sand For Glass Making Market Overview |
3.1 Myanmar Country Macro Economic Indicators |
3.2 Myanmar Silica Sand For Glass Making Market Revenues & Volume, 2022 & 2032F |
3.3 Myanmar Silica Sand For Glass Making Market - Industry Life Cycle |
3.4 Myanmar Silica Sand For Glass Making Market - Porter's Five Forces |
3.5 Myanmar Silica Sand For Glass Making Market Revenues & Volume Share, By Application, 2022 & 2032F |
3.6 Myanmar Silica Sand For Glass Making Market Revenues & Volume Share, By Purity, 2022 & 2032F |
4 Myanmar Silica Sand For Glass Making Market Dynamics |
4.1 Impact Analysis |
4.2 Market Drivers |
4.2.1 Growing demand for glass products in various industries such as construction, automotive, and electronics. |
4.2.2 Increasing investments in infrastructure projects in Myanmar leading to higher demand for glass made from silica sand. |
4.2.3 Favorable properties of Myanmar silica sand such as high purity and quality, making it ideal for glass making. |
4.3 Market Restraints |
4.3.1 Environmental concerns related to silica sand mining and processing leading to regulatory hurdles. |
4.3.2 Fluctuations in raw material prices impacting the production costs of silica sand for glass making. |
4.3.3 Competition from alternative materials or substitute products affecting the market demand for Myanmar silica sand. |
5 Myanmar Silica Sand For Glass Making Market Trends |
6 Myanmar Silica Sand For Glass Making Market, By Types |
6.1 Myanmar Silica Sand For Glass Making Market, By Application |
6.1.1 Overview and Analysis |
6.1.2 Myanmar Silica Sand For Glass Making Market Revenues & Volume, By Application, 2022-2032F |
6.1.3 Myanmar Silica Sand For Glass Making Market Revenues & Volume, By Flat Glass, 2022-2032F |
6.1.4 Myanmar Silica Sand For Glass Making Market Revenues & Volume, By Fiber Glass, 2022-2032F |
6.1.5 Myanmar Silica Sand For Glass Making Market Revenues & Volume, By Glass Containers, 2022-2032F |
6.1.6 Myanmar Silica Sand For Glass Making Market Revenues & Volume, By Special & Technical, 2022-2032F |
6.1.7 Myanmar Silica Sand For Glass Making Market Revenues & Volume, By Tableware Glass, 2022-2032F |
6.1.8 Myanmar Silica Sand For Glass Making Market Revenues & Volume, By Others, 2022-2032F |
6.2 Myanmar Silica Sand For Glass Making Market, By Purity |
6.2.1 Overview and Analysis |
6.2.2 Myanmar Silica Sand For Glass Making Market Revenues & Volume, By High Purity, 2022-2032F |
6.2.3 Myanmar Silica Sand For Glass Making Market Revenues & Volume, By Ultra High Purity, 2022-2032F |
7 Myanmar Silica Sand For Glass Making Market Import-Export Trade Statistics |
7.1 Myanmar Silica Sand For Glass Making Market Export to Major Countries |
7.2 Myanmar Silica Sand For Glass Making Market Imports from Major Countries |
8 Myanmar Silica Sand For Glass Making Market Key Performance Indicators |
8.1 Average selling price of Myanmar silica sand in the market. |
8.2 Capacity utilization rate of silica sand processing plants in Myanmar. |
8.3 Percentage of silica sand extracted meeting quality standards for glass making. |
8.4 Research and development expenditure towards improving silica sand extraction and processing technologies. |
8.5 Number of new glass manufacturing facilities established in Myanmar using locally sourced silica sand. |
9 Myanmar Silica Sand For Glass Making Market - Opportunity Assessment |
9.1 Myanmar Silica Sand For Glass Making Market Opportunity Assessment, By Application, 2022 & 2032F |
9.2 Myanmar Silica Sand For Glass Making Market Opportunity Assessment, By Purity, 2022 & 2032F |
10 Myanmar Silica Sand For Glass Making Market - Competitive Landscape |
10.1 Myanmar Silica Sand For Glass Making Market Revenue Share, By Companies, 2025 |
10.2 Myanmar Silica Sand For Glass Making Market Competitive Benchmarking, By Operating and Technical Parameters |
11 Company Profiles |
12 Recommendations |
13 Disclaimer |
Global Go To Market Strategy - 2030
Export potential enables firms to identify high-growth global markets with greater confidence by combining advanced trade intelligence with a structured quantitative methodology. The framework analyzes emerging demand trends and country-level import patterns while integrating macroeconomic and trade datasets such as GDP and population forecasts, bilateral import–export flows, tariff structures, elasticity differentials between developed and developing economies, geographic distance, and import demand projections. Using weighted trade values from 2020–2024 as the base period to project country-to-country export potential for 2030, these inputs are operationalized through calculated drivers such as gravity model parameters, tariff impact factors, and projected GDP per-capita growth. Through an analysis of hidden potentials, demand hotspots, and market conditions that are most favorable to success, this method enables firms to focus on target countries, maximize returns, and global expansion with data, backed by accuracy.
By factoring in the projected importer demand gap that is currently unmet and could be potential opportunity, it identifies the potential for the Exporter (Country) among 190 countries, against the general trade analysis, which identifies the biggest importer or exporter.
To discover high-growth global markets and optimize your business strategy:
Click Here
Pricing
- Single User License$ 1,995
- Department License$ 2,400
- Site License$ 3,120
- Global License$ 3,795

Leadership Perspectives from Industry Events
Search
Thought Leadership and Analyst Meet


Our Clients
6WResearch In News
- India Air Conditioner Market Set for Strong Rebound in 2026 After Weather-Led Correction and GST-Driven Recovery: 6Wresearch
- ADAS in India: How Automatic Emergency Braking, Blind Spot Detection & Driver Monitoring are Transforming Road Safety
- Doha a strategic location for EV manufacturing hub: IPA Qatar
- Demand for luxury TVs surging in the GCC, says Samsung
- Empowering Growth: The Thriving Journey of Bangladesh’s Cable Industry
- Demand for luxury TVs surging in the GCC, says Samsung
Latest Reports
- Nicaragua RPG Gaming Market (2026-2032)
- New Zealand RPG Gaming Market (2026-2032)
- Netherlands RPG Gaming Market (2026-2032)
- Nauru RPG Gaming Market (2026-2032)
- Namibia RPG Gaming Market (2026-2032)
- Mozambique RPG Gaming Market (2026-2032)
- Montenegro RPG Gaming Market (2026-2032)
- Mongolia RPG Gaming Market (2026-2032)
- Monaco RPG Gaming Market (2026-2032)
- Micronesia RPG Gaming Market (2026-2032)
Industry Events and Analyst Meet

EV India Expo 2026

HIMTEX 2026

India Refining Summit 2026

India EV Show 2026

EV tech India Expo 2026
Whitepaper
- Middle East & Africa Commercial Security Market Click here to view more.
- Middle East & Africa Fire Safety Systems & Equipment Market Click here to view more.
- GCC Drone Market Click here to view more.
- Middle East Lighting Fixture Market Click here to view more.
- GCC Physical & Perimeter Security Market Click here to view more.