Myanmar Water & Wastewater Treatment Market (2026-2032) | Companies, Forecast, Size, Outlook, Analysis, Trends, Share, Revenue, Growth, Industry, Value
Market Forecast By Product Category (Treatment Technologies, Delivery Equipment, Treatment Chemicals, Instrumentation), By Applications (Municipal, Industrial ) And Competitive Landscape
| Product Code: ETC020634 | Publication Date: Oct 2020 | Updated Date: Jun 2026 | Product Type: Report | |
| Publisher: 6Wresearch | Author: Ravi Bhandari | No. of Pages: 70 | No. of Figures: 35 | No. of Tables: 5 |
Myanmar Water & Wastewater Treatment Market Summary
The myanmar water & wastewater treatment market was estimated at USD 899 Million in 2025 and is projected to reach USD 1303 Million by 2032, growing at a CAGR of 6.4% from 2026 to 2032.
Myanmar Water & Wastewater Treatment Market Year-wise Growth Rate and Key Drivers
This graph highlights how the Myanmar Water & Wastewater Treatment Market has steadily grown over the past five years, supported by major growth factors.
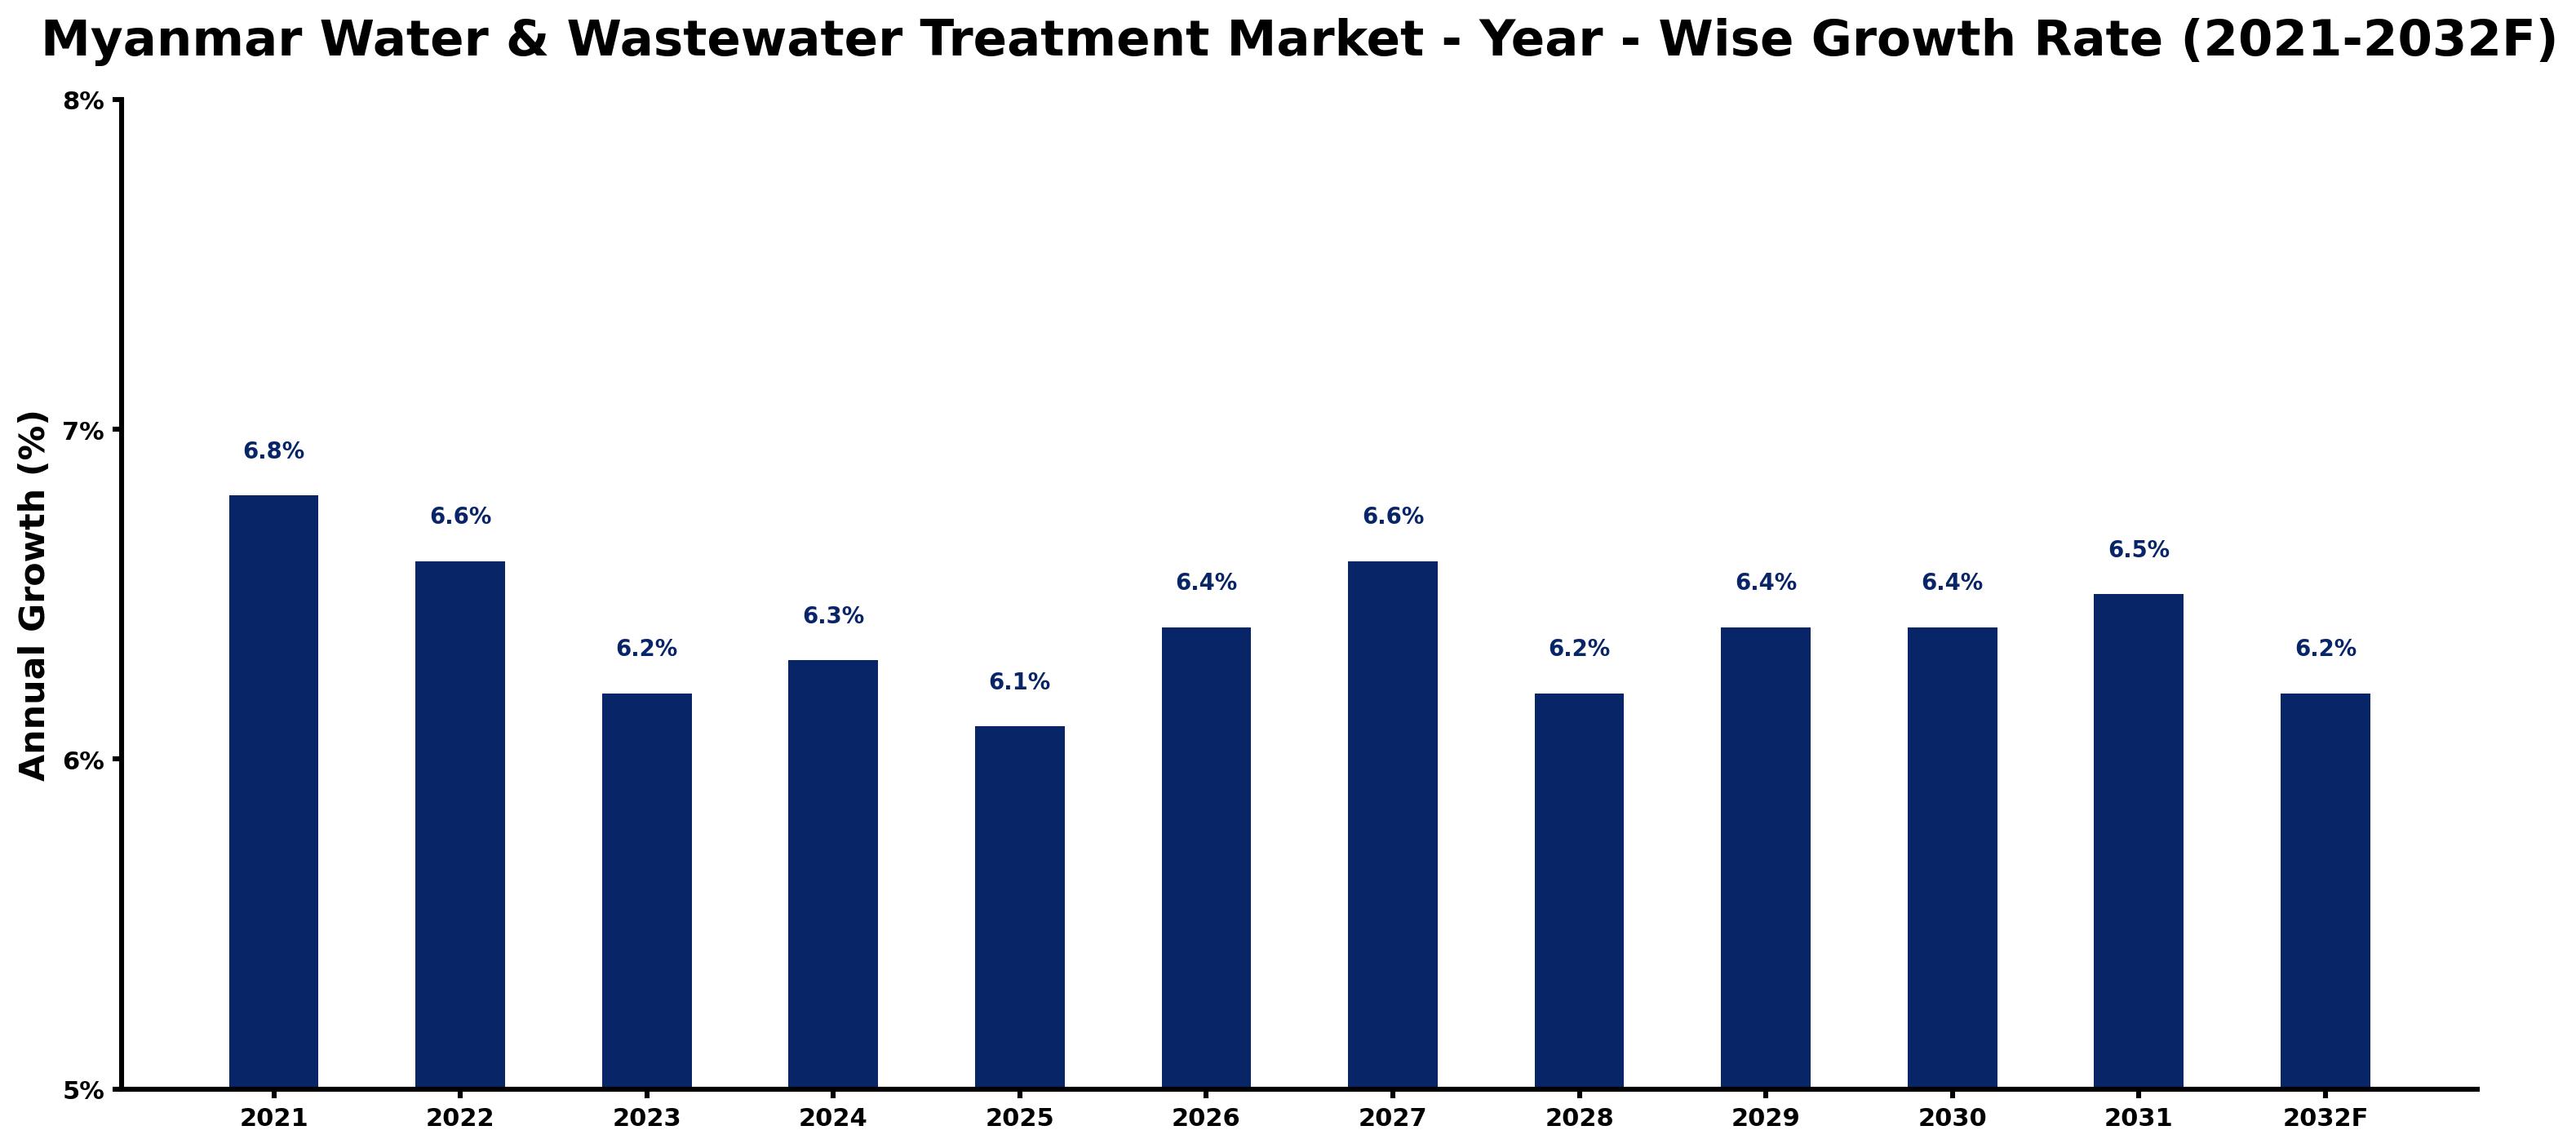
The table below presents the year wise growth rates along with the key drivers influencing the market
| Year | Growth Rate | Major Drivers |
| 2021 | 6.8% | Water scarcity issues prompted companies to enhance water treatment capabilities extensively. |
| 2022 | 6.6% | Investment in urban infrastructure modernization improved access to reliable water sources. |
| 2023 | 6.2% | Emerging technologies began transforming wastewater recycling into a viable business model. |
| 2024 | 6.3% | Public-private partnerships emerged to address chronic funding shortages in water projects. |
| 2025 | 6.1% | Global climate concerns influenced local policies enhancing sustainable water management practices. |
| 2026 | 6.4% | Technological advancements in filtration systems reduced operational costs for treatment facilities. |
| 2027 | 6.6% | International development agencies increased funding for community-focused water management initiatives. |
| 2028 | 6.2% | Local manufacturers began producing eco-friendly treatment solutions tailored to Myanmar's needs. |
| 2029 | 6.4% | Urban population growth intensified challenges, highlighting the necessity for efficient wastewater treatment. |
| 2030 | 6.4% | Consumer awareness about water quality issues spurred demand for advanced treatment technologies. |
| 2031 | 6.5% | Regulatory reforms streamlined the project approval process, encouraging new market entrants. |
| 2032 | 6.2% | Collaborative efforts among NGOs and local governments improved water access in rural areas. |
Note - Market size estimations and growth projections presented in this report are based on 6Wresearch's advanced forecasting approach, validated with industry datasets as of June 2026.
Myanmar Water & Wastewater Treatment Market Synopsis
The Myanmar Water Wastewater Treatment Market is projected to reach 6.4% and witness significant growth during the forecast period (2026-2032). This market is essential for addressing the critical need for safe drinking water and efficient wastewater management, driven by rapid urbanization, population growth, and industrialization across the country. The increasing demand for clean water and effective treatment solutions positions this sector as a pivotal element in Myanmar's sustainable development strategy.
Myanmar Water & Wastewater Treatment Market Growth Drivers
The Myanmar Water & Wastewater Treatment Market is primarily driven by several key factors:
- The rising population in urban areas significantly increases the demand for clean and safe water, leading to enhanced investment in water treatment technologies.
- Government initiatives aimed at improving water quality, accessibility, and sanitation facilities are fostering market growth through public investments and regulatory support.
- Advancements in treatment technologies, such as membrane filtration and biological treatment processes, are making wastewater management more efficient and cost-effective.
- Heightened public awareness regarding water conservation and environmental sustainability is driving demand for innovative treatment solutions.
- Industrial activities, particularly in sectors like agriculture, manufacturing, and energy, are increasing the necessity for effective wastewater management systems.
Myanmar Water & Wastewater Treatment Market Challenges and Restraints
Despite the promising outlook, the Myanmar Water & Wastewater Treatment Market faces significant challenges that could impede its growth:
- Inadequate infrastructure hampers the effective delivery of water treatment services, resulting in unreliable access to clean water in many regions.
- The high costs associated with establishing and maintaining treatment facilities pose financial barriers for many local operators.
- There is a marked deficiency in regulatory frameworks that can adequately support and enforce quality standards in water and wastewater treatment processes.
- Political and economic instability can affect investment levels and the implementation of necessary infrastructure projects.
- Limited public awareness and education about water treatment technologies may slow the adoption of advanced solutions necessary for addressing water quality issues.
Myanmar Water & Wastewater Treatment Market Government Investment and Initiatives
The government of Myanmar plays a crucial role in the development of the Water & Wastewater Treatment Market through a series of initiatives aimed at enhancing water accessibility and quality. Major government strategies include:
- Financial incentives for private sector participation in the development of water treatment facilities, fostering partnerships between the government and industry stakeholders.
- Investment in research and development focused on cutting-edge treatment technologies, which enhances the efficiency and sustainability of water management systems.
- Implementation of regulatory standards designed to ensure the safety and quality of both drinking water and treated wastewater, thereby promoting higher levels of public health.
- Collaboration with international organizations and NGOs to improve water and sanitation services, ensuring comprehensive support for public health initiatives.
- Strengthening public awareness campaigns to educate citizens on the importance of water conservation and responsible resource management.
Myanmar Water & Wastewater Treatment Market Latest Developments (May 2025 - June 2026)
Recent developments in the Myanmar Water & Wastewater Treatment Market from May 2025 to June 2026 indicate a dynamic industry landscape focused on overcoming existing challenges. During this period, the government has intensified its efforts to modernize aging infrastructure, launching initiatives aimed at enhancing water supply networks across urban areas.
Furthermore, advancements in treatment technologies have seen increased adoption, particularly in urban wastewater treatment facilities, which have begun to implement more efficient biological treatment methods.
Public-private partnerships are becoming more common, with the government encouraging private investment in water treatment projects to expand capacity and improve service delivery. Awareness campaigns targeting water conservation have gained traction, aiming to foster a culture of sustainability among consumers.
Myanmar Water & Wastewater Treatment Market - Key Attractiveness of the Report
- 10 Years of Market Numbers
- Historical Data Starting from 2022 to 2025
- Base Year: 2025
- Forecast Data until 2032
- Key Performance Indicators Impacting the Market
- Major Upcoming Developments and Projects
Key Highlights of the Report:
- Myanmar Water & Wastewater Treatment Market Outlook
- Market Size of Myanmar Water & Wastewater Treatment Market, 2025
- Forecast of Myanmar Water & Wastewater Treatment Market, 2032
- Historical Data and Forecast of Myanmar Water & Wastewater Treatment Revenues & Volume for the Period 2022-2032F
- Myanmar Water & Wastewater Treatment Market Trend Evolution
- Myanmar Water & Wastewater Treatment Market Drivers and Challenges
- Myanmar Water & Wastewater Treatment Price Trends
- Myanmar Water & Wastewater Treatment Porter's Five Forces
- Myanmar Water & Wastewater Treatment Industry Life Cycle
- Historical Data and Forecast of Myanmar Water & Wastewater Treatment Market Revenues & Volume By Product Category????????????? for the Period 2022-2032F
- Historical Data and Forecast of Myanmar Water & Wastewater Treatment Market Revenues & Volume By Treatment Technologies for the Period 2022-2032F
- Historical Data and Forecast of Myanmar Water & Wastewater Treatment Market Revenues & Volume By Delivery Equipment for the Period 2022-2032F
- Historical Data and Forecast of Myanmar Water & Wastewater Treatment Market Revenues & Volume By Treatment Chemicals for the Period 2022-2032F
- Historical Data and Forecast of Myanmar Water & Wastewater Treatment Market Revenues & Volume By Instrumentation for the Period 2022-2032F
- Historical Data and Forecast of Myanmar Water & Wastewater Treatment Market Revenues & Volume By Applications for the Period 2022-2032F
- Historical Data and Forecast of Myanmar Water & Wastewater Treatment Market Revenues & Volume By Municipal for the Period 2022-2032F
- Historical Data and Forecast of Myanmar Water & Wastewater Treatment Market Revenues & Volume By Industrial for the Period 2022-2032F
- Myanmar Water & Wastewater Treatment Import Export Trade Statistics
- Market Opportunity Assessment By Product Category?????????????
- Market Opportunity Assessment By Applications
- Myanmar Water & Wastewater Treatment Top Companies Market Share
- Myanmar Water & Wastewater Treatment Competitive Benchmarking By Technical and Operational Parameters
- Myanmar Water & Wastewater Treatment Company Profiles
- Myanmar Water & Wastewater Treatment Key Strategic Recommendations
Frequently Asked Questions About the Market Study (FAQs):
Major growth drivers include population growth, government initiatives, and advancements in treatment technologies.
Key challenges include inadequate infrastructure, high treatment facility costs, and limited regulatory frameworks.
The government is investing in water treatment facilities, providing financial incentives, and enhancing regulatory standards to ensure water quality.
Recent developments include modernization of infrastructure, increased adoption of advanced treatment technologies, and greater public-private partnerships.
6Wresearch actively monitors the Myanmar Water & Wastewater Treatment Market and publishes its comprehensive annual report, highlighting emerging trends, growth drivers, revenue analysis, and forecast outlook. Our insights help businesses to make data-backed strategic decisions with ongoing market dynamics. Our analysts track relevent industries related to the Myanmar Water & Wastewater Treatment Market, allowing our clients with actionable intelligence and reliable forecasts tailored to emerging regional needs.
Yes, we provide customisation as per your requirements. To learn more, feel free to contact us on sales@6wresearch.com
1 Executive Summary |
2 Introduction |
2.1 Key Highlights of the Report |
2.2 Report Description |
2.3 Market Scope & Segmentation |
2.4 Research Methodology |
2.5 Assumptions |
3 Myanmar Water & Wastewater Treatment Market Overview |
3.1 Myanmar Country Macro Economic Indicators |
3.2 Myanmar Water & Wastewater Treatment Market Revenues & Volume, 2022 & 2032F |
3.3 Myanmar Water & Wastewater Treatment Market - Industry Life Cycle |
3.4 Myanmar Water & Wastewater Treatment Market - Porter's Five Forces |
3.5 Myanmar Water & Wastewater Treatment Market Revenues & Volume Share, By Product Category , 2022 & 2032F |
3.6 Myanmar Water & Wastewater Treatment Market Revenues & Volume Share, By Applications, 2022 & 2032F |
4 Myanmar Water & Wastewater Treatment Market Dynamics |
4.1 Impact Analysis |
4.2 Market Drivers |
4.3 Market Restraints |
5 Myanmar Water & Wastewater Treatment Market Trends |
6 Myanmar Water & Wastewater Treatment Market, By Types |
6.1 Myanmar Water & Wastewater Treatment Market, By Product Category |
6.1.1 Overview and Analysis |
6.1.2 Myanmar Water & Wastewater Treatment Market Revenues & Volume, By Product Category , 2022-2032F |
6.1.3 Myanmar Water & Wastewater Treatment Market Revenues & Volume, By Treatment Technologies, 2022-2032F |
6.1.4 Myanmar Water & Wastewater Treatment Market Revenues & Volume, By Delivery Equipment, 2022-2032F |
6.1.5 Myanmar Water & Wastewater Treatment Market Revenues & Volume, By Treatment Chemicals, 2022-2032F |
6.1.6 Myanmar Water & Wastewater Treatment Market Revenues & Volume, By Instrumentation, 2022-2032F |
6.2 Myanmar Water & Wastewater Treatment Market, By Applications |
6.2.1 Overview and Analysis |
6.2.2 Myanmar Water & Wastewater Treatment Market Revenues & Volume, By Municipal, 2022-2032F |
6.2.3 Myanmar Water & Wastewater Treatment Market Revenues & Volume, By Industrial , 2022-2032F |
7 Myanmar Water & Wastewater Treatment Market Import-Export Trade Statistics |
7.1 Myanmar Water & Wastewater Treatment Market Export to Major Countries |
7.2 Myanmar Water & Wastewater Treatment Market Imports from Major Countries |
8 Myanmar Water & Wastewater Treatment Market Key Performance Indicators |
9 Myanmar Water & Wastewater Treatment Market - Opportunity Assessment |
9.1 Myanmar Water & Wastewater Treatment Market Opportunity Assessment, By Product Category , 2022 & 2032F |
9.2 Myanmar Water & Wastewater Treatment Market Opportunity Assessment, By Applications, 2022 & 2032F |
10 Myanmar Water & Wastewater Treatment Market - Competitive Landscape |
10.1 Myanmar Water & Wastewater Treatment Market Revenue Share, By Companies, 2025 |
10.2 Myanmar Water & Wastewater Treatment Market Competitive Benchmarking, By Operating and Technical Parameters |
11 Company Profiles |
12 Recommendations |
13 Disclaimer |
Global Go To Market Strategy - 2030
Export potential enables firms to identify high-growth global markets with greater confidence by combining advanced trade intelligence with a structured quantitative methodology. The framework analyzes emerging demand trends and country-level import patterns while integrating macroeconomic and trade datasets such as GDP and population forecasts, bilateral import–export flows, tariff structures, elasticity differentials between developed and developing economies, geographic distance, and import demand projections. Using weighted trade values from 2020–2024 as the base period to project country-to-country export potential for 2030, these inputs are operationalized through calculated drivers such as gravity model parameters, tariff impact factors, and projected GDP per-capita growth. Through an analysis of hidden potentials, demand hotspots, and market conditions that are most favorable to success, this method enables firms to focus on target countries, maximize returns, and global expansion with data, backed by accuracy.
By factoring in the projected importer demand gap that is currently unmet and could be potential opportunity, it identifies the potential for the Exporter (Country) among 190 countries, against the general trade analysis, which identifies the biggest importer or exporter.
To discover high-growth global markets and optimize your business strategy:
Click Here
Pricing
- Single User License$ 1,995
- Department License$ 2,400
- Site License$ 3,120
- Global License$ 3,795

Leadership Perspectives from Industry Events
Search
Thought Leadership and Analyst Meet


Our Clients
6WResearch In News
- India Air Conditioner Market Set for Strong Rebound in 2026 After Weather-Led Correction and GST-Driven Recovery: 6Wresearch
- ADAS in India: How Automatic Emergency Braking, Blind Spot Detection & Driver Monitoring are Transforming Road Safety
- Doha a strategic location for EV manufacturing hub: IPA Qatar
- Demand for luxury TVs surging in the GCC, says Samsung
- Empowering Growth: The Thriving Journey of Bangladesh’s Cable Industry
- Demand for luxury TVs surging in the GCC, says Samsung
Latest Reports
- Nicaragua RPG Gaming Market (2026-2032)
- New Zealand RPG Gaming Market (2026-2032)
- Netherlands RPG Gaming Market (2026-2032)
- Nauru RPG Gaming Market (2026-2032)
- Namibia RPG Gaming Market (2026-2032)
- Mozambique RPG Gaming Market (2026-2032)
- Montenegro RPG Gaming Market (2026-2032)
- Mongolia RPG Gaming Market (2026-2032)
- Monaco RPG Gaming Market (2026-2032)
- Micronesia RPG Gaming Market (2026-2032)
Industry Events and Analyst Meet

EV India Expo 2026

HIMTEX 2026

India Refining Summit 2026

India EV Show 2026

EV tech India Expo 2026
Whitepaper
- Middle East & Africa Commercial Security Market Click here to view more.
- Middle East & Africa Fire Safety Systems & Equipment Market Click here to view more.
- GCC Drone Market Click here to view more.
- Middle East Lighting Fixture Market Click here to view more.
- GCC Physical & Perimeter Security Market Click here to view more.