Myanmar Zinc Chemicals Market Outlook | Size, Companies, Analysis, Forecast, Share, Revenue, Industry, Trends, Growth, Value & COVID-19 IMPACT
Market Forecast By Type (Zinc Oxide, Zinc Sulfate, Zinc Carbonate, Zinc Chloride, Other), By End-user Industry (Agriculture, Chemicals and Petrochemicals, Ceramic, Pharmaceutical, Paints and Coatings, Rubber Processing, Other ) And Competitive Landscape
| Product Code: ETC190666 | Publication Date: May 2022 | Updated Date: Jun 2026 | Product Type: Market Research Report | |
| Publisher: 6Wresearch | Author: Ravi Bhandari | No. of Pages: 60 | No. of Figures: 40 | No. of Tables: 7 |
Myanmar Zinc Chemicals Market Size, Share & Growth Rate
The Myanmar Zinc Chemicals Market was estimated at USD 507 Million in 2025 and is projected to reach USD 738 Million by 2032, growing at a CAGR of 5.5% from 2026 to 2032. This upward trajectory is primarily driven by the increasing demand for zinc-based compounds across multiple sectors, including manufacturing and agriculture, which are seeing significant expansions in Myanmar. Moreover, advancements in chemical processing techniques are enhancing the efficiency and quality of zinc chemicals, catering to the evolving needs of industries.
Myanmar Zinc Chemicals Market Growth Rate Analysis (2021-2032)
The Myanmar Zinc Chemicals market has exhibited stable growth over recent years, with yearly growth rates averaging around 6.5% to 6.8%. In 2021, the market peaked at 6.8%, propelled by rising industrial demand and increased investments in infrastructure development. Although growth slightly declined to 6.5% in 2023, a resurgence to 6.6% is anticipated in 2024, driven by policy support for manufacturing and an emerging emphasis on sustainable practices. Factors such as energy transition initiatives and advancements in zinc processing technology bolster consumer demand, maintaining market resilience. As we move towards 2032, fluctuations appear manageable, with growth expected to stabilize around 6.6%, reflecting a robust yet adaptive industry landscape.
Myanmar Zinc Chemicals Market Year-wise Growth Rate and Key Drivers
This graph highlights how the Myanmar Zinc Chemicals Market has steadily grown over the past five years, supported by major growth factors.
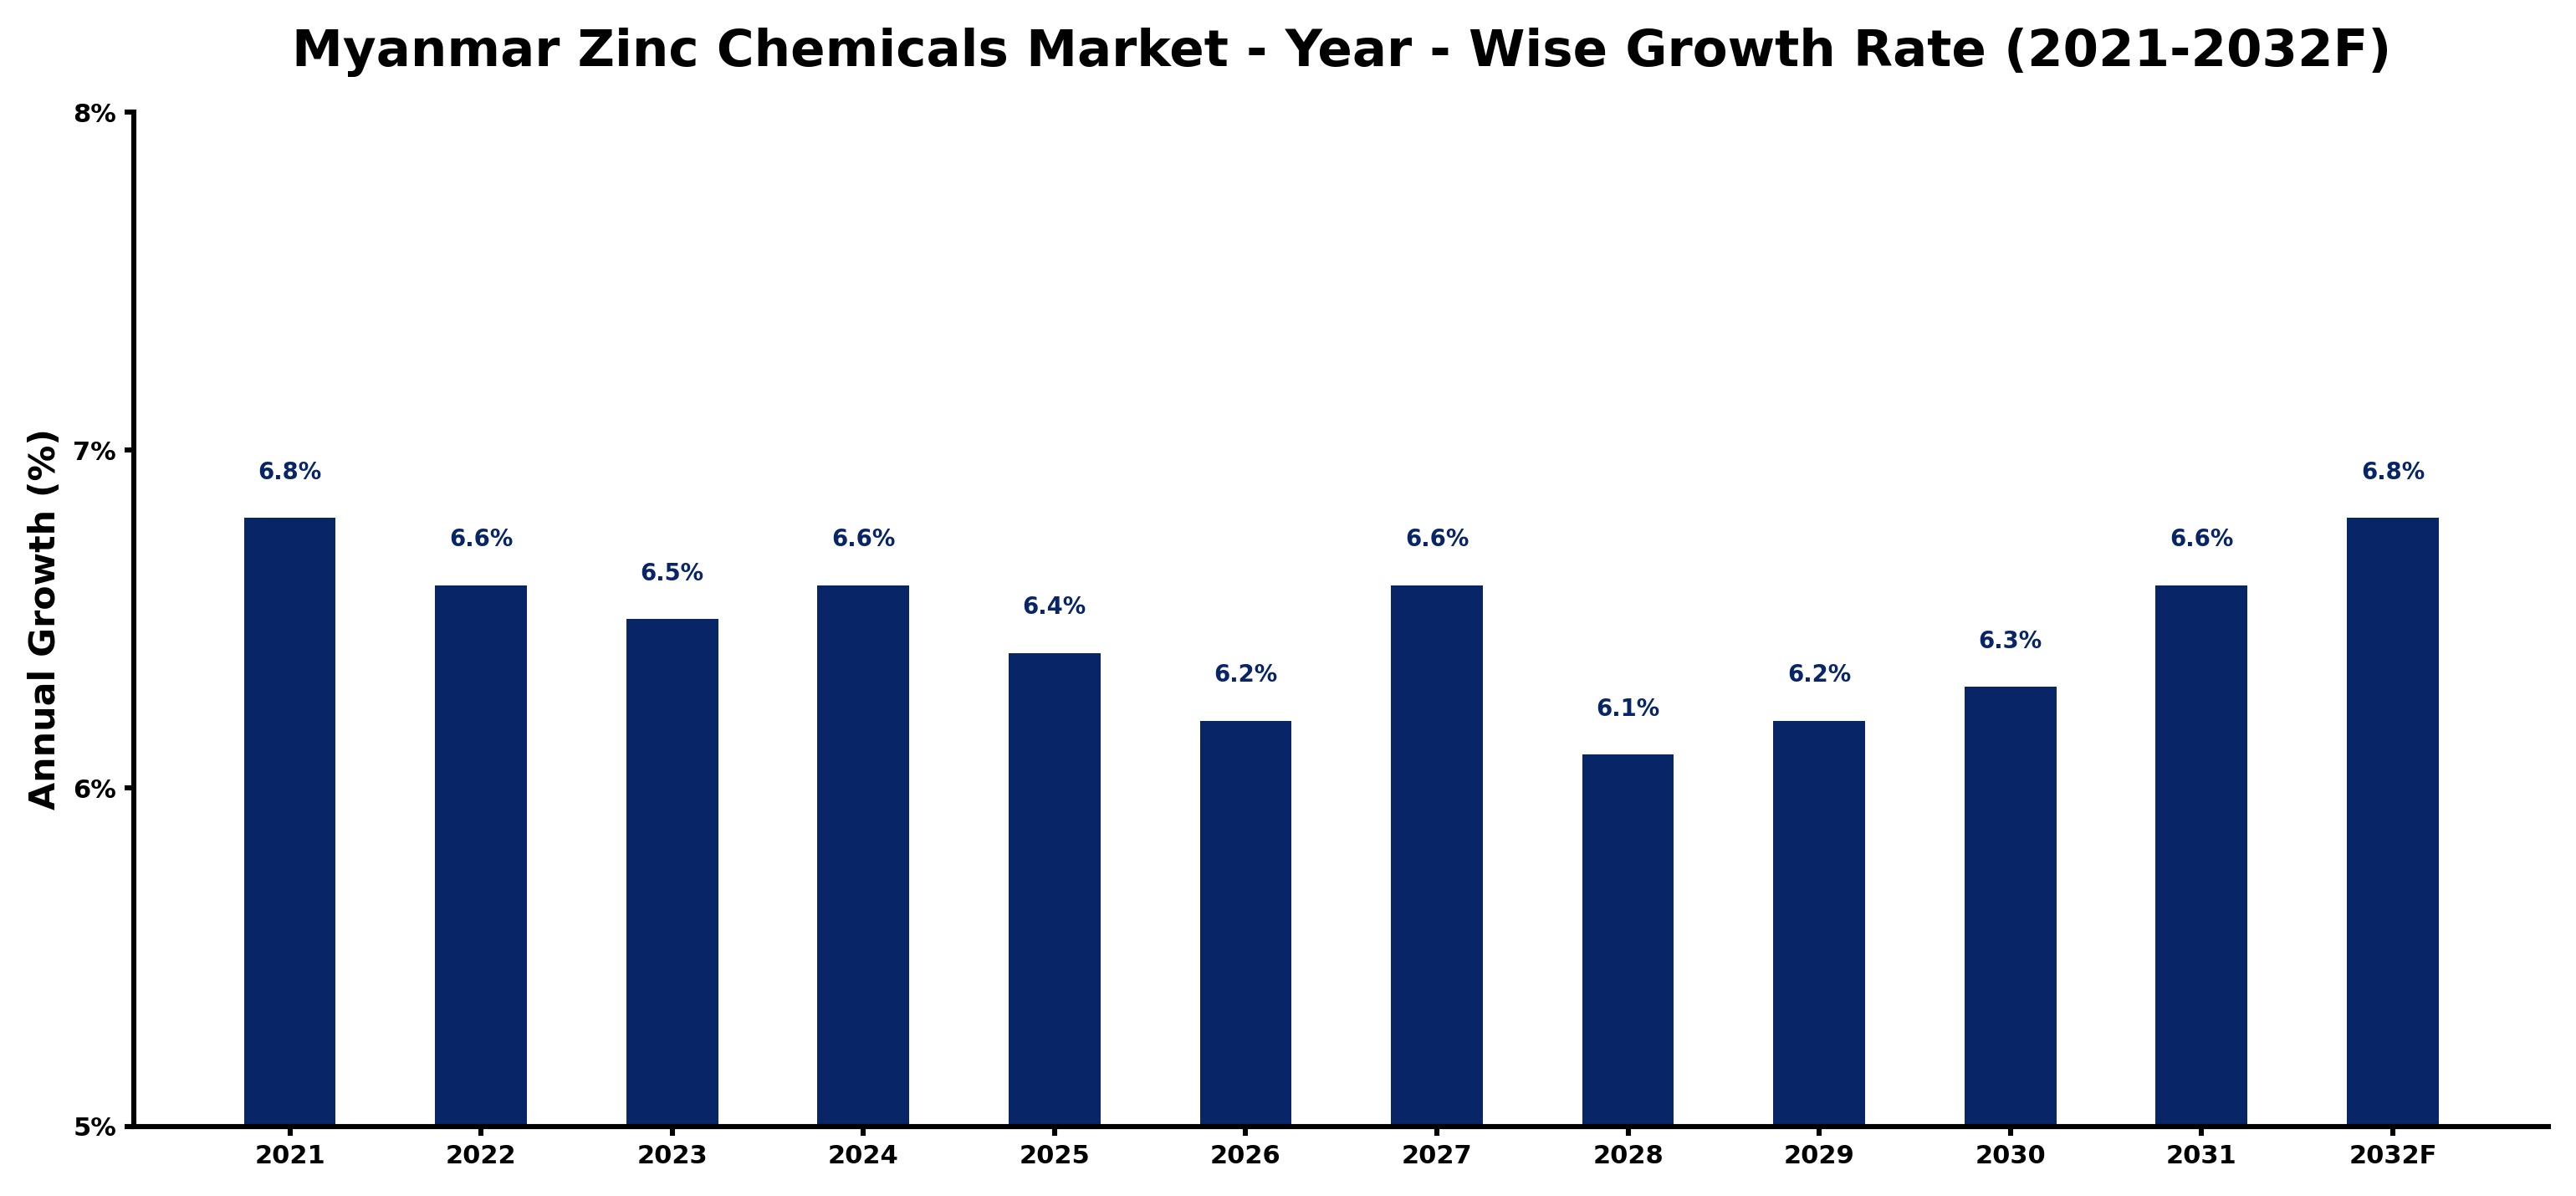
The table below presents the year‑wise growth rates along with the key drivers influencing the market
| Year | Growth Rate | Major Drivers |
| 2021 | 6.8% | Infrastructure development enhanced production |
| 2022 | 6.6% | Increased industrial applications expanded market |
| 2023 | 6.5% | Rising demand from construction sector |
| 2024 | 6.6% | Technological advancements improved efficiency |
| 2025 | 6.4% | Growing automotive industry drove consumption |
| 2026 | 6.2% | Export opportunities expanded significantly |
| 2027 | 6.6% | Rising environmental regulations boosted demand |
| 2028 | 6.1% | Consumer awareness of sustainability increased |
| 2029 | 6.2% | Investment in mining operations surged |
| 2030 | 6.3% | Government initiatives supported industry growth |
| 2031 | 6.6% | Collaboration with international firms expanded |
| 2032 | 6.8% | Research and development enhanced innovation |
Note - Market size estimations and growth projections presented in this report are based on 6Wresearch’s advanced forecasting approach, validated with industry datasets as of June 2026.
Myanmar Zinc Chemicals Market Synopsis
A notable characteristic of the Myanmar Zinc Chemicals Market is the rising use of zinc oxide in agriculture, particularly as a vital nutrient in fertilizers. This trend is propelled by the country's growing focus on enhancing agricultural yields and ensuring crop health, which significantly influences the demand for high-quality zinc chemicals.
Furthermore, the growing manufacturing sector is increasingly relying on zinc chemicals for applications in coatings and pigments. This reliance is a direct response to the need for durable and effective protective solutions that can withstand Myanmar's climatic conditions, thus driving the overall market growth.
Myanmar Zinc Chemicals Market Key Takeaways
- The market is anticipated to grow significantly due to increased applications in agriculture and manufacturing.
- Advancements in zinc chemical formulations are driving product innovation and efficiency.
- Policy support from the government is enhancing operational capabilities within the sector.
- Heightened awareness of zinc's antimicrobial properties is boosting its utilization in pharmaceuticals.
- Regional manufacturing expansions are creating new demand channels for zinc chemicals.
Evaluation of Restraints in Myanmar Zinc Chemicals Market
Despite promising growth, the Myanmar Zinc Chemicals Market is hindered by several limitations. The high cost of raw materials poses a significant challenge for manufacturers, impacting pricing strategies and profit margins. Additionally, there is a pressing need for advanced manufacturing techniques to enhance product quality and efficiency, which may require substantial investment. The market also faces competition from alternative chemical solutions that could deter potential growth. Compliance with regulatory standards and ensuring quality control can further complicate operational processes, creating additional barriers for stakeholders.
Myanmar Zinc Chemicals Market Trends
Emerging trends in the Myanmar Zinc Chemicals Market include an increased focus on sustainability and environmental responsibility in production processes. Manufacturers are exploring green alternatives and adopting eco-friendly practices to meet growing consumer and regulatory demands. Additionally, the ongoing integration of technology in chemical synthesis is facilitating the production of more sophisticated zinc compounds, which cater to diverse industrial applications.
Myanmar Zinc Chemicals Market Opportunities
Significant growth and investment opportunities lie in the enhancement of local manufacturing capabilities. As the government promotes the extraction and processing of zinc ores, businesses that invest in advanced technologies and sustainable practices stand to gain a competitive edge. Moreover, increasing agricultural productivity opens up avenues for innovative fertilizer applications, further expanding market potential.
Government Initiatives in the Myanmar Zinc Chemicals Market
The Myanmar government actively supports the Zinc Chemicals market through policies aimed at promoting mining activities and ensuring product quality. Regulatory frameworks facilitate the licensing and permit processes for chemical production facilities while also addressing environmental concerns associated with zinc manufacturing. These initiatives aim to strengthen local production capabilities and improve market access for domestically produced zinc chemicals across various industries.
Future Insights of the Myanmar Zinc Chemicals Market
Looking ahead to 2026-2032, the Myanmar Zinc Chemicals Market is poised for robust growth driven by the ongoing expansion of its manufacturing and agricultural sectors. As industries increasingly recognize the multifunctional benefits of zinc chemicals, the demand for high-quality, cost-effective solutions will likely continue to rise. Advances in technology and government support will further enhance operational efficiencies, positioning the market for long-term success.
Myanmar Zinc Chemicals Market Latest Developments (May 2025 - June 2026)
Recent developments in the Myanmar Zinc Chemicals Market indicate a shift towards more sustainable production methodologies. Manufacturers are increasingly adopting practices that align with global environmental standards, focusing on reducing waste and improving product lifecycle. Furthermore, partnerships between local businesses and international chemical firms are fostering knowledge transfer and enhancing operational capabilities within the sector.
Myanmar Zinc Chemicals Market - Key Attractiveness of the Report
- 10 Years of Market Numbers
- Historical Data Starting from 2022 to 2025
- Base Year: 2025
- Forecast Data until 2032
- Key Performance Indicators Impacting the Market
- Major Upcoming Developments and Projects
Key Highlights of the Report:
- Myanmar Zinc Chemicals Market Outlook
- Market Size of Myanmar Zinc Chemicals Market, 2025
- Forecast of Myanmar Zinc Chemicals Market, 2032
- Historical Data and Forecast of Myanmar Zinc Chemicals Revenues & Volume for the Period 2022-2032F
- Myanmar Zinc Chemicals Market Trend Evolution
- Myanmar Zinc Chemicals Market Drivers and Challenges
- Myanmar Zinc Chemicals Price Trends
- Myanmar Zinc Chemicals Porter's Five Forces
- Myanmar Zinc Chemicals Industry Life Cycle
- Historical Data and Forecast of Myanmar Zinc Chemicals Market Revenues & Volume By Type for the Period 2022-2032F
- Historical Data and Forecast of Myanmar Zinc Chemicals Market Revenues & Volume By Zinc Oxide for the Period 2022-2032F
- Historical Data and Forecast of Myanmar Zinc Chemicals Market Revenues & Volume By Zinc Sulfate for the Period 2022-2032F
- Historical Data and Forecast of Myanmar Zinc Chemicals Market Revenues & Volume By Zinc Carbonate for the Period 2022-2032F
- Historical Data and Forecast of Myanmar Zinc Chemicals Market Revenues & Volume By Zinc Chloride for the Period 2022-2032F
- Historical Data and Forecast of Myanmar Zinc Chemicals Market Revenues & Volume By Other for the Period 2022-2032F
- Historical Data and Forecast of Myanmar Zinc Chemicals Market Revenues & Volume By End-user Industry for the Period 2022-2032F
- Historical Data and Forecast of Myanmar Zinc Chemicals Market Revenues & Volume By Agriculture for the Period 2022-2032F
- Historical Data and Forecast of Myanmar Zinc Chemicals Market Revenues & Volume By Chemicals and Petrochemicals for the Period 2022-2032F
- Historical Data and Forecast of Myanmar Zinc Chemicals Market Revenues & Volume By Ceramic for the Period 2022-2032F
- Historical Data and Forecast of Myanmar Zinc Chemicals Market Revenues & Volume By Pharmaceutical for the Period 2022-2032F
- Historical Data and Forecast of Myanmar Zinc Chemicals Market Revenues & Volume By Paints and Coatings for the Period 2022-2032F
- Historical Data and Forecast of Myanmar Zinc Chemicals Market Revenues & Volume By Rubber Processing for the Period 2022-2032F
- Historical Data and Forecast of Myanmar Zinc Chemicals Market Revenues & Volume By Other for the Period 2022-2032F
- Myanmar Zinc Chemicals Import Export Trade Statistics
- Market Opportunity Assessment By Type
- Market Opportunity Assessment By End-user Industry
- Myanmar Zinc Chemicals Top Companies Market Share
- Myanmar Zinc Chemicals Competitive Benchmarking By Technical and Operational Parameters
- Myanmar Zinc Chemicals Company Profiles
- Myanmar Zinc Chemicals Key Strategic Recommendations
Myanmar Zinc Chemicals Market - Frequently Asked Questions
Zinc chemicals are widely utilized in coatings, fertilizers, and pharmaceutical formulations. Their diverse applications across multiple sectors underline their significance in supporting industry needs.
The market was estimated at USD 507 Million in 2025 and is projected to reach USD 738 Million by 2032, growing at a CAGR of 5.5% from 2026 to 2032, indicating robust growth potential.
Government policies are crucial in promoting zinc mining and chemical production. Regulations ensure product quality and environmental sustainability, creating a favorable environment for market growth.
Ongoing advancements in chemical synthesis technology are enhancing the efficiency and quality of zinc chemicals, which are increasingly being tailored to meet specific industrial applications.
The presence of alternative chemical solutions poses competitive challenges for the market, potentially limiting growth. However, the unique properties and benefits of zinc chemicals often keep them in demand.
6Wresearch actively monitors the Myanmar Zinc Chemicals Market and publishes its comprehensive annual report, highlighting emerging trends, growth drivers, revenue analysis, and forecast outlook. Our insights help businesses to make data-backed strategic decisions with ongoing market dynamics. Our analysts track relevent industries related to the Myanmar Zinc Chemicals Market, allowing our clients with actionable intelligence and reliable forecasts tailored to emerging regional needs.
Yes, we provide customisation as per your requirements. To learn more, feel free to contact us on sales@6wresearch.com
1 Executive Summary |
2 Introduction |
2.1 Key Highlights of the Report |
2.2 Report Description |
2.3 Market Scope & Segmentation |
2.4 Research Methodology |
2.5 Assumptions |
3 Myanmar Zinc Chemicals Market Overview |
3.1 Myanmar Country Macro Economic Indicators |
3.2 Myanmar Zinc Chemicals Market Revenues & Volume, 2022 & 2032F |
3.3 Myanmar Zinc Chemicals Market - Industry Life Cycle |
3.4 Myanmar Zinc Chemicals Market - Porter's Five Forces |
3.5 Myanmar Zinc Chemicals Market Revenues & Volume Share, By Type, 2022 & 2032F |
3.6 Myanmar Zinc Chemicals Market Revenues & Volume Share, By End-user Industry, 2022 & 2032F |
4 Myanmar Zinc Chemicals Market Dynamics |
4.1 Impact Analysis |
4.2 Market Drivers |
4.2.1 Growing industrial applications of zinc chemicals in Myanmar |
4.2.2 Increasing demand for zinc chemicals in the agriculture sector |
4.2.3 Rising investments in infrastructure development and construction projects in Myanmar |
4.3 Market Restraints |
4.3.1 Fluctuating prices of raw materials used in zinc chemical production |
4.3.2 Lack of awareness about the benefits of zinc chemicals among end-users in Myanmar |
4.3.3 Stringent regulations related to environmental and safety standards impacting production and distribution |
5 Myanmar Zinc Chemicals Market Trends |
6 Myanmar Zinc Chemicals Market, By Types |
6.1 Myanmar Zinc Chemicals Market, By Type |
6.1.1 Overview and Analysis |
6.1.2 Myanmar Zinc Chemicals Market Revenues & Volume, By Type, 2022-2032F |
6.1.3 Myanmar Zinc Chemicals Market Revenues & Volume, By Zinc Oxide, 2022-2032F |
6.1.4 Myanmar Zinc Chemicals Market Revenues & Volume, By Zinc Sulfate, 2022-2032F |
6.1.5 Myanmar Zinc Chemicals Market Revenues & Volume, By Zinc Carbonate, 2022-2032F |
6.1.6 Myanmar Zinc Chemicals Market Revenues & Volume, By Zinc Chloride, 2022-2032F |
6.1.7 Myanmar Zinc Chemicals Market Revenues & Volume, By Other, 2022-2032F |
6.2 Myanmar Zinc Chemicals Market, By End-user Industry |
6.2.1 Overview and Analysis |
6.2.2 Myanmar Zinc Chemicals Market Revenues & Volume, By Agriculture, 2022-2032F |
6.2.3 Myanmar Zinc Chemicals Market Revenues & Volume, By Chemicals and Petrochemicals, 2022-2032F |
6.2.4 Myanmar Zinc Chemicals Market Revenues & Volume, By Ceramic, 2022-2032F |
6.2.5 Myanmar Zinc Chemicals Market Revenues & Volume, By Pharmaceutical, 2022-2032F |
6.2.6 Myanmar Zinc Chemicals Market Revenues & Volume, By Paints and Coatings, 2022-2032F |
6.2.7 Myanmar Zinc Chemicals Market Revenues & Volume, By Rubber Processing, 2022-2032F |
7 Myanmar Zinc Chemicals Market Import-Export Trade Statistics |
7.1 Myanmar Zinc Chemicals Market Export to Major Countries |
7.2 Myanmar Zinc Chemicals Market Imports from Major Countries |
8 Myanmar Zinc Chemicals Market Key Performance Indicators |
8.1 Adoption rate of zinc chemicals in key industries in Myanmar |
8.2 Number of new product developments and innovations in the zinc chemical market |
8.3 Utilization rate of zinc chemical production capacity in Myanmar |
9 Myanmar Zinc Chemicals Market - Opportunity Assessment |
9.1 Myanmar Zinc Chemicals Market Opportunity Assessment, By Type, 2022 & 2032F |
9.2 Myanmar Zinc Chemicals Market Opportunity Assessment, By End-user Industry, 2022 & 2032F |
10 Myanmar Zinc Chemicals Market - Competitive Landscape |
10.1 Myanmar Zinc Chemicals Market Revenue Share, By Companies, 2025 |
10.2 Myanmar Zinc Chemicals Market Competitive Benchmarking, By Operating and Technical Parameters |
11 Company Profiles |
12 Recommendations |
13 Disclaimer |
Global Go To Market Strategy - 2030
Export potential enables firms to identify high-growth global markets with greater confidence by combining advanced trade intelligence with a structured quantitative methodology. The framework analyzes emerging demand trends and country-level import patterns while integrating macroeconomic and trade datasets such as GDP and population forecasts, bilateral import–export flows, tariff structures, elasticity differentials between developed and developing economies, geographic distance, and import demand projections. Using weighted trade values from 2020–2024 as the base period to project country-to-country export potential for 2030, these inputs are operationalized through calculated drivers such as gravity model parameters, tariff impact factors, and projected GDP per-capita growth. Through an analysis of hidden potentials, demand hotspots, and market conditions that are most favorable to success, this method enables firms to focus on target countries, maximize returns, and global expansion with data, backed by accuracy.
By factoring in the projected importer demand gap that is currently unmet and could be potential opportunity, it identifies the potential for the Exporter (Country) among 190 countries, against the general trade analysis, which identifies the biggest importer or exporter.
To discover high-growth global markets and optimize your business strategy:
Click Here
Pricing
- Single User License$ 1,995
- Department License$ 2,400
- Site License$ 3,120
- Global License$ 3,795

Leadership Perspectives from Industry Events
Search
Thought Leadership and Analyst Meet


Our Clients
6WResearch In News
- India Air Conditioner Market Set for Strong Rebound in 2026 After Weather-Led Correction and GST-Driven Recovery: 6Wresearch
- ADAS in India: How Automatic Emergency Braking, Blind Spot Detection & Driver Monitoring are Transforming Road Safety
- Doha a strategic location for EV manufacturing hub: IPA Qatar
- Demand for luxury TVs surging in the GCC, says Samsung
- Empowering Growth: The Thriving Journey of Bangladesh’s Cable Industry
- Demand for luxury TVs surging in the GCC, says Samsung
Latest Reports
- Nicaragua RPG Gaming Market (2026-2032)
- New Zealand RPG Gaming Market (2026-2032)
- Netherlands RPG Gaming Market (2026-2032)
- Nauru RPG Gaming Market (2026-2032)
- Namibia RPG Gaming Market (2026-2032)
- Mozambique RPG Gaming Market (2026-2032)
- Montenegro RPG Gaming Market (2026-2032)
- Mongolia RPG Gaming Market (2026-2032)
- Monaco RPG Gaming Market (2026-2032)
- Micronesia RPG Gaming Market (2026-2032)
Industry Events and Analyst Meet

EV India Expo 2026

HIMTEX 2026

India Refining Summit 2026

India EV Show 2026

EV tech India Expo 2026
Whitepaper
- Middle East & Africa Commercial Security Market Click here to view more.
- Middle East & Africa Fire Safety Systems & Equipment Market Click here to view more.
- GCC Drone Market Click here to view more.
- Middle East Lighting Fixture Market Click here to view more.
- GCC Physical & Perimeter Security Market Click here to view more.