Nepal Digital Photo Frame Market (2026-2032) | Industry, Trends, Share, Outlook, Forecast, Companies, Analysis, Value, Revenue, Size & Growth
Market Forecast By Product Type (Pan Touch Control Frame, Remote Control Frame), By Size (Standard Frame (4:3), Widescreen Frame (16:9)), By Inch (Up to 7, Between 7 to 15, Above 15), By Power Source (Electricity Power Source, Battery Power Source), By Application (Residential, Commercial) And Competitive Landscape
| Product Code: ETC012356 | Publication Date: Oct 2020 | Updated Date: Jun 2026 | Product Type: Report | |
| Publisher: 6Wresearch | Author: Bhawna Singh | No. of Pages: 70 | No. of Figures: 35 | No. of Tables: 5 |
Nepal Digital Photo Frame Market Summary
The nepal digital photo frame market was estimated at USD 369 Million in 2025 and is projected to reach USD 539 Million by 2032, growing at a CAGR of 6.7% from 2026 to 2032.
Nepal Digital Photo Frame Market Growth Rate Analysis (2021-2032)
The Nepal Digital Photo Frame market has exhibited steady growth, recording increases of 6.3% in 2021 and 6.5% in 2022, with a slight uptick to 6.6% in 2023. This trend appears sustainable as evolving consumer preferences favor innovative digital products that seamlessly integrate into personal and home decor. A stable growth rate of approximately 6.3% to 6.7% is expected through 2032, driven by rising disposable incomes and an increasing inclination toward digitalization. Additionally, investment in local infrastructure and technology improvements will likely bolster market accessibility and attract further investments. The demand for personalized digital gifting solutions is strengthening, fueling the market's resilience during forecasted fluctuations.
Nepal Digital Photo Frame Market Year-wise Growth Rate and Key Drivers
This graph highlights how the Nepal Digital Photo Frame Market has steadily grown over the past five years, supported by major growth factors.
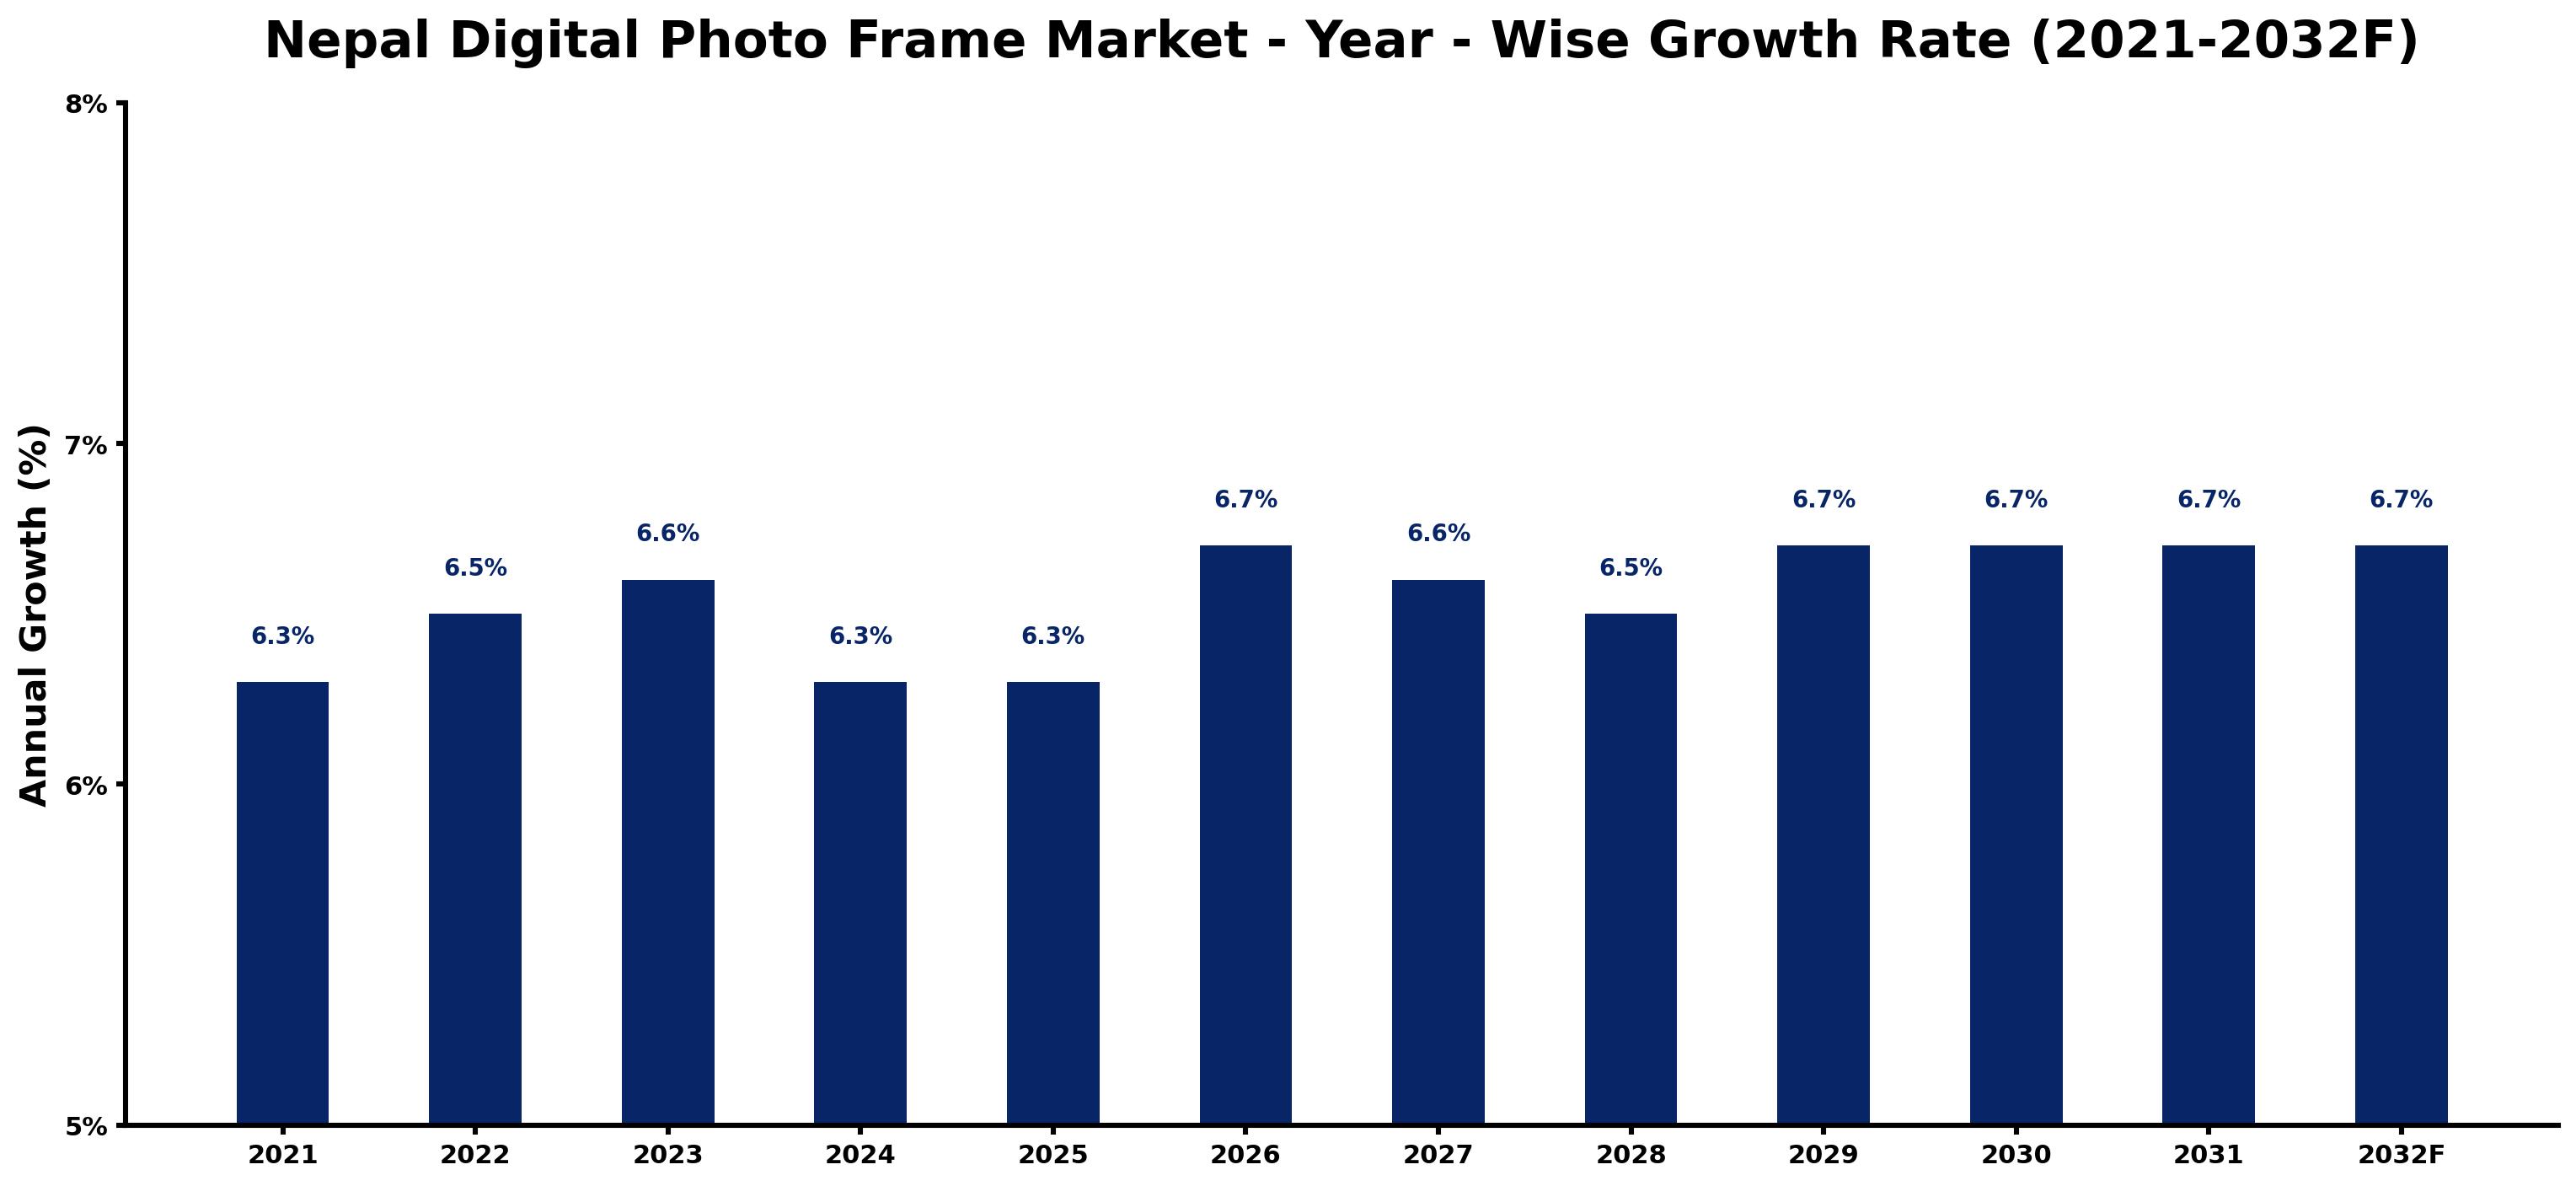
The table below presents the year wise growth rates along with the key drivers influencing the market
| Year | Growth Rate | Major Drivers |
| 2021 | 6.3% | Consumers increasingly seek personalized home decor solutions, enhancing market prospects for digital frames. |
| 2022 | 6.5% | Enhanced smartphone penetration leads to easier photo sharing and digital frame integration. |
| 2023 | 6.6% | Social media platforms flourish, creating a larger audience for digital photography and frame usage. |
| 2024 | 6.3% | Emerging e-commerce platforms simplify purchasing digital frames, expanding consumer accessibility nationwide. |
| 2025 | 6.3% | Local manufacturers focus on affordable options, catering to diverse income levels in Nepal. |
| 2026 | 6.7% | Increased interest in gifting trends promotes digital frames as unique and personal presents. |
| 2027 | 6.6% | Technological improvements enable higher resolution displays, attracting tech-savvy consumers to market. |
| 2028 | 6.5% | Rising disposable incomes lead households to invest in modern home entertainment technologies. |
| 2029 | 6.7% | Urbanization drives demand for space-efficient home decor, favoring compact digital photo frames. |
| 2030 | 6.7% | Innovative features like Wi-Fi connectivity and cloud storage enhance product appeal significantly. |
| 2031 | 6.7% | Partnerships between digital frame brands and local artists stimulate unique content offerings. |
| 2032 | 6.7% | Sustainable trends encourage eco-friendly manufacturing practices within the digital frame market. |
Note - Market size estimations and growth projections presented in this report are based on 6Wresearch's advanced forecasting approach, validated with industry datasets as of June 2026.
Nepal Digital Photo Frame Market Synopsis
The Nepal Digital Photo Frame Market is projected to reach 6.7% and witness significant growth during the forecast period (2026-2032). The rise in the adoption of digital technologies and growing consumer preference for innovative and personalized ways to display memories are pivotal factors driving this market. As individuals seek to enhance their home decor and create unique gifting experiences, digital photo frames have emerged as a modern solution that integrates functionality with aesthetics.
Nepal Digital Photo Frame Market Growth Drivers
Several factors contribute to the growth of the Nepal Digital Photo Frame Market. The increasing penetration of smartphones and digital photography has paved the way for the widespread appeal of digital photo frames. Moreover, consumers are demonstrating a strong inclination towards products that offer personalization and customization features, allowing them to showcase their memories in a distinctive manner.
- This market is witnessing an elevation in consumer awareness about the capabilities of digital photo frames, including features like high-definition displays and smart connectivity options.
- The trend of sharing experiences and photographs on social media platforms has prompted individuals to seek digital frames that can seamlessly integrate with these platforms.
- Technological advancements in display technology, such as OLED and LED screens, are enhancing the visual appeal of digital photo frames, drawing in consumers who value aesthetics.
- Sustainability is becoming increasingly important, with eco-friendly materials and energy-efficient designs gaining traction among environmentally conscious consumers.
- The expanding gifting culture, especially for occasions such as weddings and anniversaries, positions digital photo frames as popular choices, further fuelling market growth.
Nepal Digital Photo Frame Market Trends and Opportunities
The Nepal Digital Photo Frame Market is experiencing notable trends that present various opportunities for growth. The movement towards smart home technologies is creating demand for digital photo frames that offer enhanced functionalities such as Wi-Fi connectivity and cloud storage capabilities. As consumers look for more interactive experiences, touch screen digital frames are becoming sought after.
- Increased consumer openness towards technology integration presents an opportunity for brands to cater to a tech-savvy audience seeking multifunctional devices.
- The rising popularity of digital photography continues to push the demand for digital frames, as consumers look for innovative ways to display their captured moments.
- Customized frames that allow users to upload photos directly from their smartphones are gaining traction, highlighting the importance of user-friendly interfaces.
- With the shift towards a more digital lifestyle, the demand for digital photo frames that can also function as digital assistants or information displays is on the rise.
- Investing in advertising campaigns that highlight the unique features of digital photo frames can effectively generate interest among new consumers.
Nepal Digital Photo Frame Market Challenges and Restraints
Despite the promising growth potential, the Nepal Digital Photo Frame Market faces several challenges. Limited awareness regarding the benefits and functionalities of digital frames poses a barrier to market penetration. Many consumers still hold a preference for traditional photo displays, viewing digital alternatives as non-essential.
- The lack of awareness creates a slower adoption rate among potential users, limiting market expansion opportunities.
- Access to quality digital photo frames can be constrained by the lack of widespread distribution channels in certain regions of Nepal.
- Concerns about the reliability and longevity of digital photo frames present challenges, as consumers may perceive them as luxurious items rather than functional necessities.
- Price sensitivity among consumers can hinder the growth of premium digital frames, resulting in a preference for lower-cost alternatives.
- The absence of sufficient technical support and after-sales services can deter consumers from investing in digital photo frames, impacting market growth.
Nepal Digital Photo Frame Market Government Investment and Initiatives
The government of Nepal has recognized the potential of the digital photo frame market and is implementing policies to foster its growth. Regulatory measures are in place to ensure the quality of imported products, thus safeguarding consumer interests while encouraging fair competition in the market.
- Import regulations are designed to maintain the safety standards of digital photo frames, ensuring that consumers have access to high-quality products.
- Taxation policies are aimed at generating revenue while controlling the influx of goods, creating a balanced market environment.
- Efforts to promote local manufacturing are supported by the government, providing incentives for domestic companies to produce digital frames, bolstering the national economy.
- Licensing requirements for manufacturers and sellers help maintain market integrity and ensure compliance with industry standards.
- Through these initiatives, the government aims to create employment opportunities and enhance technological literacy among the population, indirectly benefiting the digital photo frame market.
Nepal Digital Photo Frame Market Latest Developments (May 2025 - June 2026)
In recent months, the digital photo frame industry in Nepal has seen several exciting developments that signal a dynamic market landscape. Consumers are increasingly drawn to digital frames equipped with the latest technologies, leading to innovations in user interface and connectivity features.
- The integration of advanced display technologies has become a focal point, with manufacturers aiming to enhance visual quality and user engagement.
- Market players are exploring partnerships with technology firms to introduce frames that can synchronize with social media accounts, allowing users to effortlessly display their online galleries.
- Consumer feedback is driving the demand for customization options, with brands increasingly focusing on creating products that allow for personalized photo uploads and settings adjustments.
- Marketing strategies are evolving, with companies leveraging social media platforms to reach potential consumers, generating interest and fostering community engagement.
- As the gifting season approaches, promotional activities are being ramped up, highlighting digital photo frames as ideal gifts for various occasions.
Nepal Digital Photo Frame Market - Key Attractiveness of the Report
- 10 Years of Market Numbers
- Historical Data Starting from 2022 to 2025
- Base Year: 2025
- Forecast Data until 2032
- Key Performance Indicators Impacting the Market
- Major Upcoming Developments and Projects
Key Highlights of the Report:
- Nepal Digital Photo Frame Market Outlook
- Market Size of Nepal Digital Photo Frame Market, 2025
- Forecast of Nepal Digital Photo Frame Market, 2032F
- Historical Data and Forecast of Nepal Digital Photo Frame Revenues & Volume for the Period 2022-2032F
- Nepal Digital Photo Frame Market Trend Evolution
- Nepal Digital Photo Frame Market Drivers and Challenges
- Nepal Digital Photo Frame Price Trends
- Nepal Digital Photo Frame Porter's Five Forces
- Nepal Digital Photo Frame Industry Life Cycle
- Historical Data and Forecast of Nepal Digital Photo Frame Market Revenues & Volume By Product Type for the Period 2022-2032F
- Historical Data and Forecast of Nepal Digital Photo Frame Market Revenues & Volume By Pan Touch Control Frame for the Period 2022-2032F
- Historical Data and Forecast of Nepal Digital Photo Frame Market Revenues & Volume By Remote Control Frame for the Period 2022-2032F
- Historical Data and Forecast of Nepal Digital Photo Frame Market Revenues & Volume By Size for the Period 2022-2032F
- Historical Data and Forecast of Nepal Digital Photo Frame Market Revenues & Volume By Standard Frame (4:3) for the Period 2022-2032F
- Historical Data and Forecast of Nepal Digital Photo Frame Market Revenues & Volume By Widescreen Frame (16:9) for the Period 2022-2032F
- Historical Data and Forecast of Nepal Digital Photo Frame Market Revenues & Volume By Inch for the Period 2022-2032F
- Historical Data and Forecast of Nepal Digital Photo Frame Market Revenues & Volume By Up to 7 for the Period 2022-2032F
- Historical Data and Forecast of Nepal Digital Photo Frame Market Revenues & Volume By Between 7 to 15 for the Period 2022-2032F
- Historical Data and Forecast of Nepal Digital Photo Frame Market Revenues & Volume By Above 15 for the Period 2022-2032F
- Historical Data and Forecast of Nepal Digital Photo Frame Market Revenues & Volume By Power Source for the Period 2022-2032F
- Historical Data and Forecast of Nepal Digital Photo Frame Market Revenues & Volume By Electricity Power Source for the Period 2022-2032F
- Historical Data and Forecast of Nepal Digital Photo Frame Market Revenues & Volume By Battery Power Source for the Period 2022-2032F
- Historical Data and Forecast of Nepal Digital Photo Frame Market Revenues & Volume By Application for the Period 2022-2032F
- Historical Data and Forecast of Nepal Digital Photo Frame Market Revenues & Volume By Residential for the Period 2022-2032F
- Historical Data and Forecast of Nepal Digital Photo Frame Market Revenues & Volume By Commercial for the Period 2022-2032F
- Historical Data and Forecast of Nepal Digital Photo Frame Market Revenues & Volume By Distribution Channel for the Period 2022-2032F
- Historical Data and Forecast of Nepal Digital Photo Frame Market Revenues & Volume By Online for the Period 2022-2032F
- Historical Data and Forecast of Nepal Digital Photo Frame Market Revenues & Volume By Offline for the Period 2022-2032F
- Nepal Digital Photo Frame Import Export Trade Statistics
- Market Opportunity Assessment By Product Type
- Market Opportunity Assessment By Size
- Market Opportunity Assessment By Inch
- Market Opportunity Assessment By Power Source
- Market Opportunity Assessment By Application
- Market Opportunity Assessment By Distribution Channel
- Nepal Digital Photo Frame Top Companies Market Share
- Nepal Digital Photo Frame Competitive Benchmarking By Technical and Operational Parameters
- Nepal Digital Photo Frame Company Profiles
- Nepal Digital Photo Frame Key Strategic Recommendations
Frequently Asked Questions About the Market Study (FAQs):
The growth is primarily driven by increasing consumer demand for personalized digital display options and the rise in digital technology adoption.
Yes, challenges include low consumer awareness, limited access to products, and competition from traditional photo displays.
The government has implemented various regulations to ensure product quality, promote local manufacturing, and support consumer interests.
The future outlook remains positive, with expected growth driven by technological advancements and evolving consumer preferences towards digital solutions.
6Wresearch actively monitors the Nepal Digital Photo Frame Market and publishes its comprehensive annual report, highlighting emerging trends, growth drivers, revenue analysis, and forecast outlook. Our insights help businesses to make data-backed strategic decisions with ongoing market dynamics. Our analysts track relevent industries related to the Nepal Digital Photo Frame Market, allowing our clients with actionable intelligence and reliable forecasts tailored to emerging regional needs.
Yes, we provide customisation as per your requirements. To learn more, feel free to contact us on sales@6wresearch.com
1 Executive Summary |
2 Introduction |
2.1 Key Highlights of the Report |
2.2 Report Description |
2.3 Market Scope & Segmentation |
2.4 Research Methodology |
2.5 Assumptions |
3 Nepal Digital Photo Frame Market Overview |
3.1 Nepal Country Macro Economic Indicators |
3.2 Nepal Digital Photo Frame Market Revenues & Volume, 2022 & 2032F |
3.3 Nepal Digital Photo Frame Market - Industry Life Cycle |
3.4 Nepal Digital Photo Frame Market - Porter's Five Forces |
3.5 Nepal Digital Photo Frame Market Revenues & Volume Share, By Product Type, 2022 & 2032F |
3.6 Nepal Digital Photo Frame Market Revenues & Volume Share, By Size, 2022 & 2032F |
3.7 Nepal Digital Photo Frame Market Revenues & Volume Share, By Inch, 2022 & 2032F |
3.8 Nepal Digital Photo Frame Market Revenues & Volume Share, By Power Source, 2022 & 2032F |
3.9 Nepal Digital Photo Frame Market Revenues & Volume Share, By Application, 2022 & 2032F |
3.10 Nepal Digital Photo Frame Market Revenues & Volume Share, By Distribution Channel, 2022 & 2032F |
4 Nepal Digital Photo Frame Market Dynamics |
4.1 Impact Analysis |
4.2 Market Drivers |
4.3 Market Restraints |
5 Nepal Digital Photo Frame Market Trends |
6 Nepal Digital Photo Frame Market, By Types |
6.1 Nepal Digital Photo Frame Market, By Product Type |
6.1.1 Overview and Analysis |
6.1.2 Nepal Digital Photo Frame Market Revenues & Volume, By Product Type, 2022-2032F |
6.1.3 Nepal Digital Photo Frame Market Revenues & Volume, By Pan Touch Control Frame, 2022-2032F |
6.1.4 Nepal Digital Photo Frame Market Revenues & Volume, By Remote Control Frame, 2022-2032F |
6.2 Nepal Digital Photo Frame Market, By Size |
6.2.1 Overview and Analysis |
6.2.2 Nepal Digital Photo Frame Market Revenues & Volume, By Standard Frame (4:3), 2022-2032F |
6.2.3 Nepal Digital Photo Frame Market Revenues & Volume, By Widescreen Frame (16:9), 2022-2032F |
6.3 Nepal Digital Photo Frame Market, By Inch |
6.3.1 Overview and Analysis |
6.3.2 Nepal Digital Photo Frame Market Revenues & Volume, By Up to 7, 2022-2032F |
6.3.3 Nepal Digital Photo Frame Market Revenues & Volume, By Between 7 to 15, 2022-2032F |
6.3.4 Nepal Digital Photo Frame Market Revenues & Volume, By Above 15, 2022-2032F |
6.4 Nepal Digital Photo Frame Market, By Power Source |
6.4.1 Overview and Analysis |
6.4.2 Nepal Digital Photo Frame Market Revenues & Volume, By Electricity Power Source, 2022-2032F |
6.4.3 Nepal Digital Photo Frame Market Revenues & Volume, By Battery Power Source, 2022-2032F |
6.5 Nepal Digital Photo Frame Market, By Application |
6.5.1 Overview and Analysis |
6.5.2 Nepal Digital Photo Frame Market Revenues & Volume, By Residential, 2022-2032F |
6.5.3 Nepal Digital Photo Frame Market Revenues & Volume, By Commercial, 2022-2032F |
6.6 Nepal Digital Photo Frame Market, By Distribution Channel |
6.6.1 Overview and Analysis |
6.6.2 Nepal Digital Photo Frame Market Revenues & Volume, By Online, 2022-2032F |
6.6.3 Nepal Digital Photo Frame Market Revenues & Volume, By Offline, 2022-2032F |
7 Nepal Digital Photo Frame Market Import-Export Trade Statistics |
7.1 Nepal Digital Photo Frame Market Export to Major Countries |
7.2 Nepal Digital Photo Frame Market Imports from Major Countries |
8 Nepal Digital Photo Frame Market Key Performance Indicators |
9 Nepal Digital Photo Frame Market - Opportunity Assessment |
9.1 Nepal Digital Photo Frame Market Opportunity Assessment, By Product Type, 2022 & 2032F |
9.2 Nepal Digital Photo Frame Market Opportunity Assessment, By Size, 2022 & 2032F |
9.3 Nepal Digital Photo Frame Market Opportunity Assessment, By Inch, 2022 & 2032F |
9.4 Nepal Digital Photo Frame Market Opportunity Assessment, By Power Source, 2022 & 2032F |
9.5 Nepal Digital Photo Frame Market Opportunity Assessment, By Application, 2022 & 2032F |
9.6 Nepal Digital Photo Frame Market Opportunity Assessment, By Distribution Channel, 2022 & 2032F |
10 Nepal Digital Photo Frame Market - Competitive Landscape |
10.1 Nepal Digital Photo Frame Market Revenue Share, By Companies, 2025 |
10.2 Nepal Digital Photo Frame Market Competitive Benchmarking, By Operating and Technical Parameters |
11 Company Profiles |
12 Recommendations |
13 Disclaimer |
Global Go To Market Strategy - 2030
Export potential enables firms to identify high-growth global markets with greater confidence by combining advanced trade intelligence with a structured quantitative methodology. The framework analyzes emerging demand trends and country-level import patterns while integrating macroeconomic and trade datasets such as GDP and population forecasts, bilateral import–export flows, tariff structures, elasticity differentials between developed and developing economies, geographic distance, and import demand projections. Using weighted trade values from 2020–2024 as the base period to project country-to-country export potential for 2030, these inputs are operationalized through calculated drivers such as gravity model parameters, tariff impact factors, and projected GDP per-capita growth. Through an analysis of hidden potentials, demand hotspots, and market conditions that are most favorable to success, this method enables firms to focus on target countries, maximize returns, and global expansion with data, backed by accuracy.
By factoring in the projected importer demand gap that is currently unmet and could be potential opportunity, it identifies the potential for the Exporter (Country) among 190 countries, against the general trade analysis, which identifies the biggest importer or exporter.
To discover high-growth global markets and optimize your business strategy:
Click Here
Pricing
- Single User License$ 1,995
- Department License$ 2,400
- Site License$ 3,120
- Global License$ 3,795

Leadership Perspectives from Industry Events
Search
Thought Leadership and Analyst Meet


Our Clients
6WResearch In News
- India Air Conditioner Market Set for Strong Rebound in 2026 After Weather-Led Correction and GST-Driven Recovery: 6Wresearch
- ADAS in India: How Automatic Emergency Braking, Blind Spot Detection & Driver Monitoring are Transforming Road Safety
- Doha a strategic location for EV manufacturing hub: IPA Qatar
- Demand for luxury TVs surging in the GCC, says Samsung
- Empowering Growth: The Thriving Journey of Bangladesh’s Cable Industry
- Demand for luxury TVs surging in the GCC, says Samsung
Latest Reports
- Poland Fire Protection Systems Market (2026-2032)
- Cape Verde Portable Hand-Thrown Extinguisher Market (2026-2032)
- Canada Portable Hand-Thrown Extinguisher Market (2026-2032)
- Cameroon Portable Hand-Thrown Extinguisher Market (2026-2032)
- Burundi Portable Hand-Thrown Extinguisher Market (2026-2032)
- Burkina Faso Portable Hand-Thrown Extinguisher Market (2026-2032)
- Bulgaria Portable Hand-Thrown Extinguisher Market (2026-2032)
- Brunei Portable Hand-Thrown Extinguisher Market (2026-2032)
- Botswana Portable Hand-Thrown Extinguisher Market (2026-2032)
- Bosnia and Herzegovina Portable Hand-Thrown Extinguisher Market (2026-2032)
Industry Events and Analyst Meet

HIMTEX 2026

India Refining Summit 2026

India EV Show 2026

EV tech India Expo 2026

Auto Tech Asia 2026
Whitepaper
- Middle East & Africa Commercial Security Market Click here to view more.
- Middle East & Africa Fire Safety Systems & Equipment Market Click here to view more.
- GCC Drone Market Click here to view more.
- Middle East Lighting Fixture Market Click here to view more.
- GCC Physical & Perimeter Security Market Click here to view more.