Nepal Laboratory Furniture Market (2026-2032) | Growth, Trends, Share, Analysis, Size, Companies, Industry, Forecast, Revenue, Outlook & Value
Market Forecast By Product Type (Lab Bench, Lab Cabinet, Fume Hood, Stool, Accessories), By Applications (Education, Government, Industry, Research, Pharmaceutical) And Competitive Landscape
| Product Code: ETC029456 | Publication Date: Oct 2020 | Updated Date: Jun 2026 | Product Type: Report | |
| Publisher: 6Wresearch | Author: Summon Dutta | No. of Pages: 70 | No. of Figures: 35 | No. of Tables: 5 |
Nepal Laboratory Furniture Market Summary
The nepal laboratory furniture market was estimated at USD 620 Million in 2025 and is projected to reach USD 884 Million by 2032, growing at a CAGR of 6.5% from 2026 to 2032.
Nepal Laboratory Furniture Market Year-wise Growth Rate and Key Drivers
This graph highlights how the Nepal Laboratory Furniture Market has steadily grown over the past five years, supported by major growth factors.
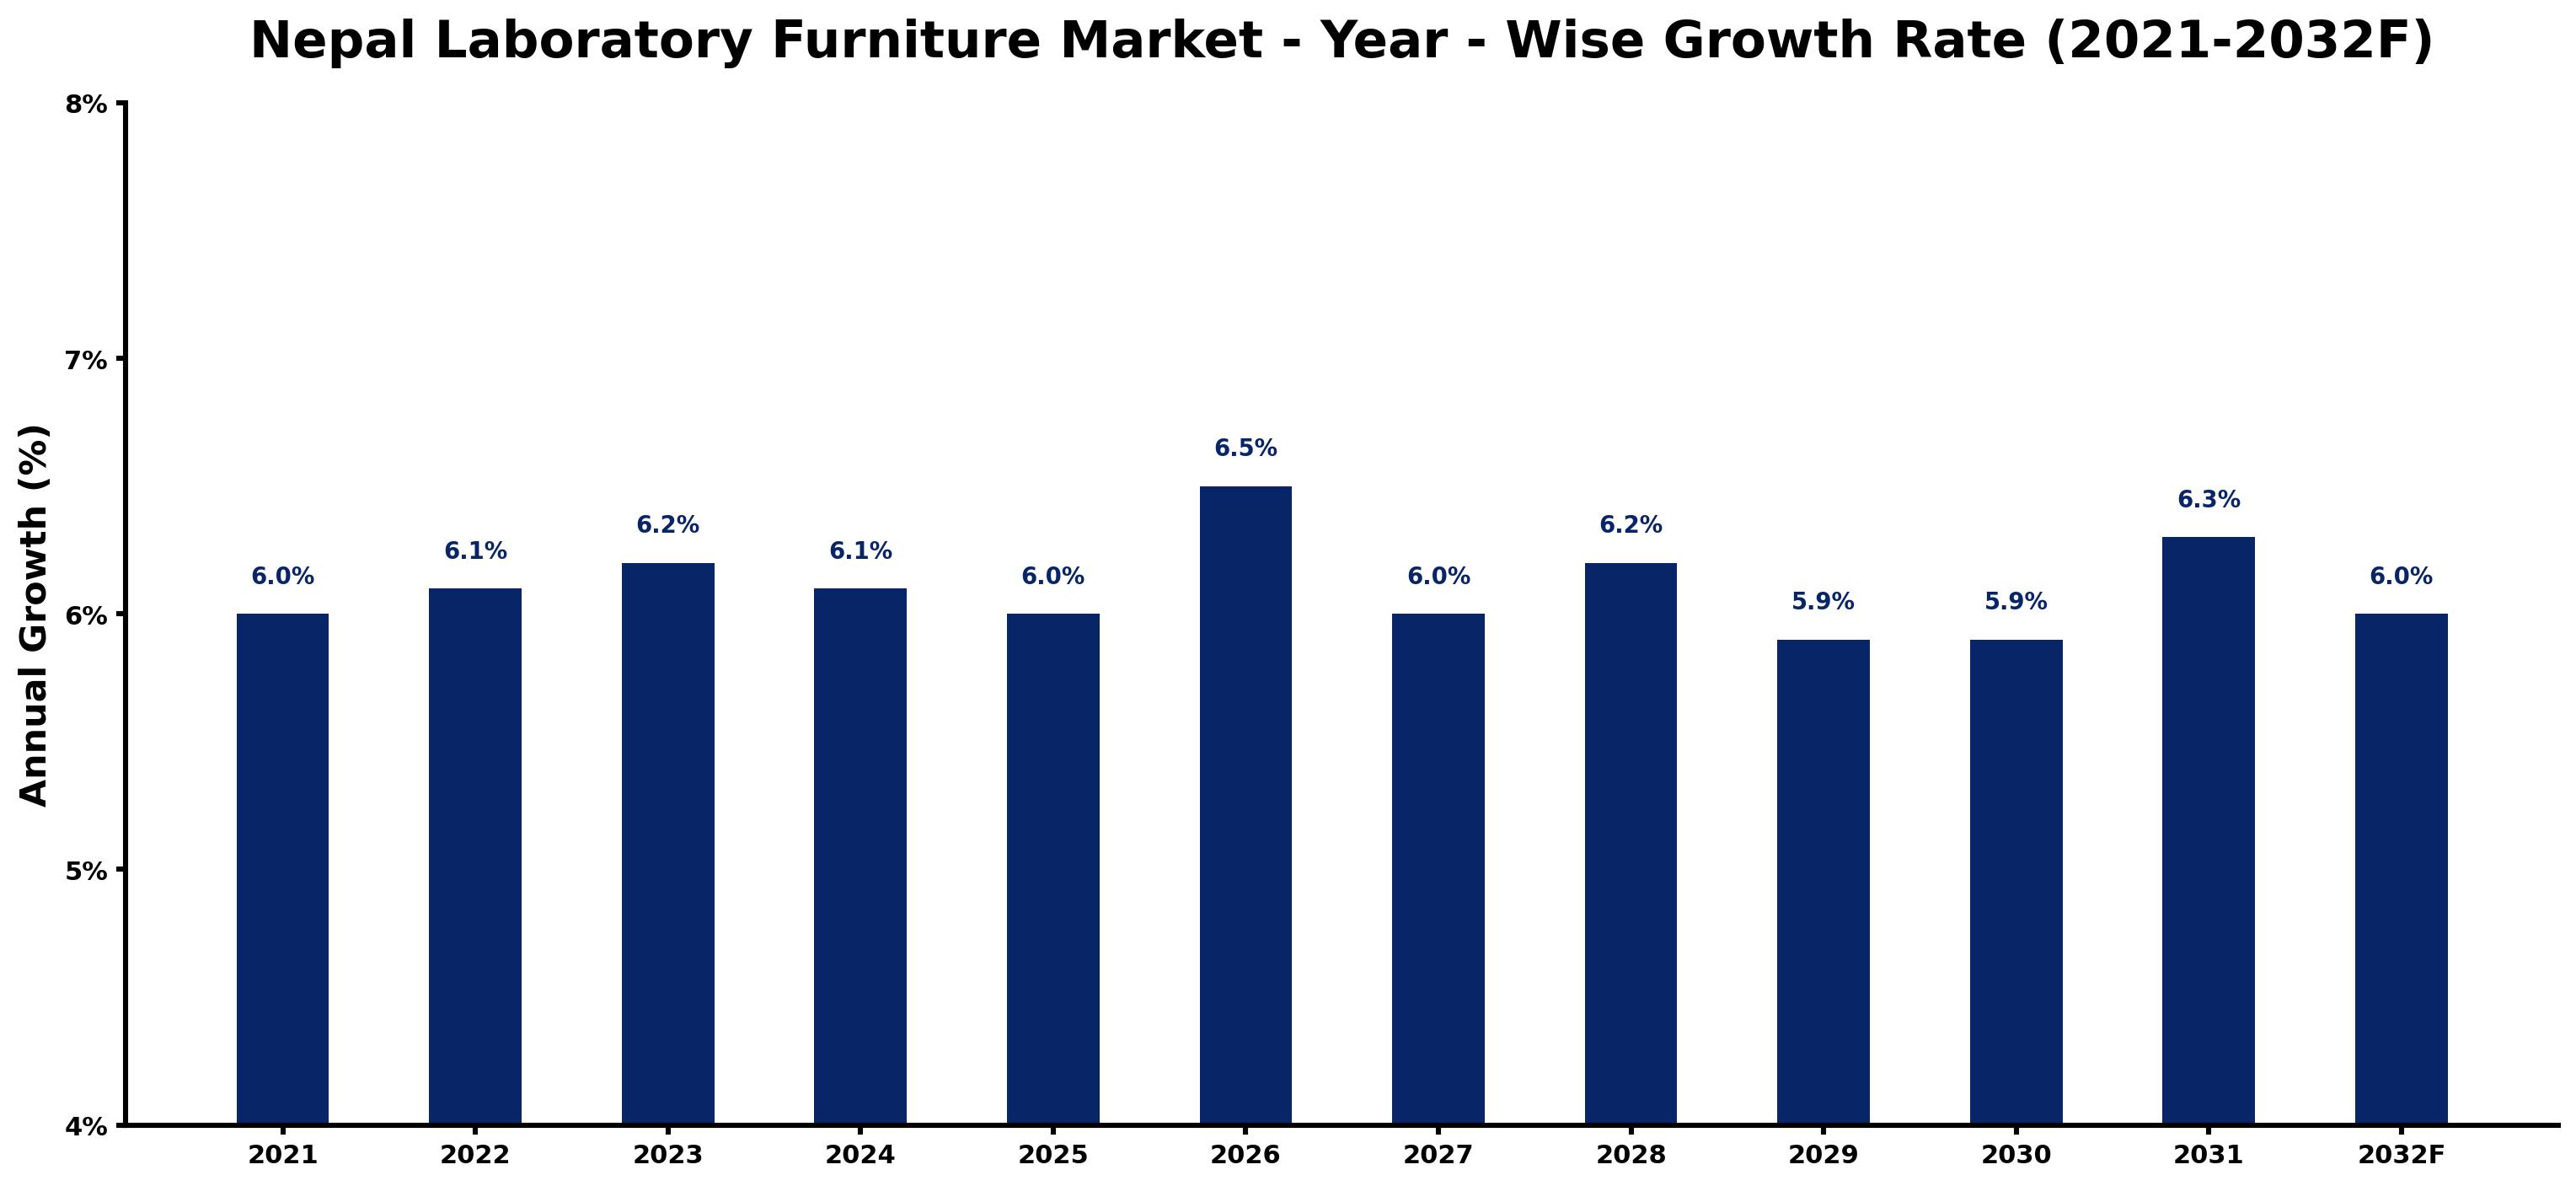
The table below presents the year wise growth rates along with the key drivers influencing the market
| Year | Growth Rate | Major Drivers |
| 2021 | 6.0% | Post-pandemic recovery highlighted the importance of laboratory safety and functionality. |
| 2022 | 6.1% | Investment in research and development sectors stimulated laboratory infrastructure requirements significantly. |
| 2023 | 6.2% | Emerging biotechnology startups reported a pressing need for modern lab equipment and furniture. |
| 2024 | 6.1% | Increased academic collaborations fostered demand for specialized laboratory furniture in universities. |
| 2025 | 6.0% | Healthcare expansion led to greater laboratory space needs across new medical facilities. |
| 2026 | 6.5% | Evolving educational curricula emphasized practical lab work, driving furniture market expansion. |
| 2027 | 6.0% | Sustainability trends prompted laboratories to seek eco-friendly furniture solutions. |
| 2028 | 6.2% | Technological innovations created a demand for adaptable lab furniture catering to diverse needs. |
| 2029 | 5.9% | Regional manufacturing capabilities improved, reducing dependency on imported laboratory furnishings. |
| 2030 | 5.9% | Corporate investments in health research indicated sustained growth in laboratory infrastructure. |
| 2031 | 6.3% | Increased public awareness regarding health safety prompted demand for customized lab environments. |
| 2032 | 6.0% | Competitive market dynamics required manufacturers to innovate, enhancing furniture quality and design. |
Note - Market size estimations and growth projections presented in this report are based on 6Wresearch's advanced forecasting approach, validated with industry datasets as of June 2026.
Nepal Laboratory Furniture Market Synopsis
The Nepal Laboratory Furniture Market is projected to reach 6.5% and witness significant growth during the forecast period (2026-2032). This market is primarily driven by an increasing focus on enhancing research and development capabilities across key sectors such as healthcare, education, and pharmaceuticals. Modern laboratories are demanding high-quality, durable, and ergonomic furniture solutions to improve operational efficiency and productivity.
Nepal Laboratory Furniture Market Growth Drivers
The growth of the Nepal laboratory furniture market is supported by several pivotal factors:
- The rising investments in research and development initiatives across various sectors, particularly in healthcare and pharmaceuticals, are creating a robust demand for specialized laboratory furniture.
- As laboratories strive for a safe and comfortable working environment, the demand for ergonomic designs that enhance user experience is significantly increasing.
- Environmental sustainability is becoming a priority, with laboratories increasingly opting for furniture made from eco-friendly materials that also offer durability.
- Government regulations and quality standards pertaining to laboratory operations are encouraging the procurement of compliant furniture solutions, thus driving market growth.
- The push for modernization of existing laboratory spaces is leading to a surge in demand for innovative and customizable furniture that caters to specific workflows.
Nepal Laboratory Furniture Market Trends and Opportunities
Current trends in the Nepal laboratory furniture market reflect a shift towards innovative and functional designs:
- The increasing preference for mobile and flexible furniture solutions allows laboratories to adapt to changing requirements and configurations, promoting efficiency.
- Customization options are seeing heightened interest, as laboratories seek solutions specifically tailored to their operational needs and space constraints.
- Integration of technology into laboratory furniture, such as power outlets and data connectivity, is gaining traction to support advanced equipment usage.
- Durability and low maintenance are critical attributes that laboratories look for, driving the demand for high-quality materials and designs.
- Educational institutions are modernizing laboratory spaces, thereby creating opportunities for suppliers to provide tailored solutions that enhance the learning environment.
Nepal Laboratory Furniture Market Challenges and Restraints
While the market exhibits promising growth, it also encounters several challenges that may impede progress:
- Limited awareness regarding the benefits of modern laboratory furniture, particularly in smaller laboratories and educational institutions, poses a barrier to adoption.
- Dependence on imported materials and products can lead to increased costs, making it challenging for local manufacturers to compete on price.
- Infrastructure limitations, including inadequate transportation and distribution networks, hinder the effective delivery of laboratory furniture to remote areas.
- Quality assurance can be difficult to maintain, particularly when relying on imported goods, leading to potential discrepancies in product standards.
- There is a notable absence of local manufacturing capabilities which can restrict availability and increase the lead times for ordering new laboratory furniture.
Nepal Laboratory Furniture Market Investment Opportunities
The Nepal laboratory furniture market offers various lucrative investment opportunities:
- With a growing number of research institutions and healthcare facilities establishing operations, the demand for quality laboratory furniture is expected to continue climbing.
- Investors can benefit from supplying ergonomic and modern furniture designs that cater specifically to the unique needs of laboratories.
- The ongoing trend towards laboratory modernization presents an opportunity for companies to introduce innovative, customizable solutions.
- Investment in local manufacturing capabilities could reduce reliance on imports, thus enhancing competitiveness and market reach.
- As the scientific and educational sectors expand, creating partnerships with institutions for tailored furniture solutions can yield significant returns.
Nepal Laboratory Furniture Market Government Investment and Initiatives
Government policies in the Nepal laboratory furniture market are aimed at fostering growth and ensuring safety standards. The government has implemented regulations to promote the use of high-quality and durable furniture, crucial for efficient laboratory operations. Initiatives supporting local manufacturing are in place to reduce dependency on imports, encouraging domestic industries. Additionally, there are guidelines surrounding design and materials that align with international quality standards, ensuring that laboratories have access to safe and functional furniture solutions. By promoting procurement from approved suppliers, the government is enhancing compliance and quality within laboratories across Nepal.
Nepal Laboratory Furniture Market Latest Developments (May 2025 - June 2026)
Recent developments within the Nepal laboratory furniture market indicate a strong shift towards modernization and regulatory compliance. Various institutions are engaged in upgrading their facilities to meet enhanced safety and quality standards, leading to an increased demand for innovative furniture solutions. Furthermore, there is a rising trend among laboratories to incorporate technology into their furniture configurations, which supports advanced scientific practices. The local production of laboratory furniture is gaining traction as government incentives for domestic manufacturers are being rolled out, potentially reducing the reliance on foreign imports. Overall, the market is poised for significant transformative changes in the upcoming years.
Nepal Laboratory Furniture Market - Key Attractiveness of the Report
- 10 Years of Market Numbers
- Historical Data Starting from 2022 to 2025
- Base Year: 2025
- Forecast Data until 2032
- Key Performance Indicators Impacting the Market
- Major Upcoming Developments and Projects
Key Highlights of the Report:
- Nepal Laboratory Furniture Market Outlook
- Market Size of Nepal Laboratory Furniture Market, 2025
- Forecast of Nepal Laboratory Furniture Market, 2032F
- Historical Data and Forecast of Nepal Laboratory Furniture Revenues & Volume for the Period 2022-2032F
- Nepal Laboratory Furniture Market Trend Evolution
- Nepal Laboratory Furniture Market Drivers and Challenges
- Nepal Laboratory Furniture Price Trends
- Nepal Laboratory Furniture Porter's Five Forces
- Nepal Laboratory Furniture Industry Life Cycle
- Historical Data and Forecast of Nepal Laboratory Furniture Market Revenues & Volume By Product Type for the Period 2022-2032F
- Historical Data and Forecast of Nepal Laboratory Furniture Market Revenues & Volume By Lab Bench for the Period 2022-2032F
- Historical Data and Forecast of Nepal Laboratory Furniture Market Revenues & Volume By Lab Cabinet for the Period 2022-2032F
- Historical Data and Forecast of Nepal Laboratory Furniture Market Revenues & Volume By Fume Hood for the Period 2022-2032F
- Historical Data and Forecast of Nepal Laboratory Furniture Market Revenues & Volume By Stool for the Period 2022-2032F
- Historical Data and Forecast of Nepal Laboratory Furniture Market Revenues & Volume By Accessories for the Period 2022-2032F
- Historical Data and Forecast of Nepal Laboratory Furniture Market Revenues & Volume By Applications for the Period 2022-2032F
- Historical Data and Forecast of Nepal Laboratory Furniture Market Revenues & Volume By Education for the Period 2022-2032F
- Historical Data and Forecast of Nepal Laboratory Furniture Market Revenues & Volume By Government for the Period 2022-2032F
- Historical Data and Forecast of Nepal Laboratory Furniture Market Revenues & Volume By Industry for the Period 2022-2032F
- Historical Data and Forecast of Nepal Laboratory Furniture Market Revenues & Volume By Research for the Period 2022-2032F
- Historical Data and Forecast of Nepal Laboratory Furniture Market Revenues & Volume By Pharmaceutical for the Period 2022-2032F
- Nepal Laboratory Furniture Import Export Trade Statistics
- Market Opportunity Assessment By Product Type
- Market Opportunity Assessment By Applications
- Nepal Laboratory Furniture Top Companies Market Share
- Nepal Laboratory Furniture Competitive Benchmarking By Technical and Operational Parameters
- Nepal Laboratory Furniture Company Profiles
- Nepal Laboratory Furniture Key Strategic Recommendations
Frequently Asked Questions About the Market Study (FAQs):
The growth is primarily driven by increased investments in research and development across key sectors, leading to higher demand for specialized and ergonomic laboratory furniture.
Key challenges include limited awareness of modern solutions, reliance on imported materials, and logistical difficulties in reaching remote areas.
Opportunities exist in supplying customized and ergonomic furniture, investing in local manufacturing, and partnering with educational and research institutions.
The government is implementing regulations that promote quality standards, encouraging local manufacturing, and supporting research institutions in their procurement of compliant furniture.
6Wresearch actively monitors the Nepal Laboratory Furniture Market and publishes its comprehensive annual report, highlighting emerging trends, growth drivers, revenue analysis, and forecast outlook. Our insights help businesses to make data-backed strategic decisions with ongoing market dynamics. Our analysts track relevent industries related to the Nepal Laboratory Furniture Market, allowing our clients with actionable intelligence and reliable forecasts tailored to emerging regional needs.
Yes, we provide customisation as per your requirements. To learn more, feel free to contact us on sales@6wresearch.com
1 Executive Summary |
2 Introduction |
2.1 Key Highlights of the Report |
2.2 Report Description |
2.3 Market Scope & Segmentation |
2.4 Research Methodology |
2.5 Assumptions |
3 Nepal Laboratory Furniture Market Overview |
3.1 Nepal Country Macro Economic Indicators |
3.2 Nepal Laboratory Furniture Market Revenues & Volume, 2022 & 2032F |
3.3 Nepal Laboratory Furniture Market - Industry Life Cycle |
3.4 Nepal Laboratory Furniture Market - Porter's Five Forces |
3.5 Nepal Laboratory Furniture Market Revenues & Volume Share, By Product Type, 2022 & 2032F |
3.6 Nepal Laboratory Furniture Market Revenues & Volume Share, By Applications, 2022 & 2032F |
4 Nepal Laboratory Furniture Market Dynamics |
4.1 Impact Analysis |
4.2 Market Drivers |
4.3 Market Restraints |
5 Nepal Laboratory Furniture Market Trends |
6 Nepal Laboratory Furniture Market, By Types |
6.1 Nepal Laboratory Furniture Market, By Product Type |
6.1.1 Overview and Analysis |
6.1.2 Nepal Laboratory Furniture Market Revenues & Volume, By Product Type, 2022-2032F |
6.1.3 Nepal Laboratory Furniture Market Revenues & Volume, By Lab Bench, 2022-2032F |
6.1.4 Nepal Laboratory Furniture Market Revenues & Volume, By Lab Cabinet, 2022-2032F |
6.1.5 Nepal Laboratory Furniture Market Revenues & Volume, By Fume Hood, 2022-2032F |
6.1.6 Nepal Laboratory Furniture Market Revenues & Volume, By Stool, 2022-2032F |
6.1.7 Nepal Laboratory Furniture Market Revenues & Volume, By Accessories, 2022-2032F |
6.2 Nepal Laboratory Furniture Market, By Applications |
6.2.1 Overview and Analysis |
6.2.2 Nepal Laboratory Furniture Market Revenues & Volume, By Education, 2022-2032F |
6.2.3 Nepal Laboratory Furniture Market Revenues & Volume, By Government, 2022-2032F |
6.2.4 Nepal Laboratory Furniture Market Revenues & Volume, By Industry, 2022-2032F |
6.2.5 Nepal Laboratory Furniture Market Revenues & Volume, By Research, 2022-2032F |
6.2.6 Nepal Laboratory Furniture Market Revenues & Volume, By Pharmaceutical, 2022-2032F |
7 Nepal Laboratory Furniture Market Import-Export Trade Statistics |
7.1 Nepal Laboratory Furniture Market Export to Major Countries |
7.2 Nepal Laboratory Furniture Market Imports from Major Countries |
8 Nepal Laboratory Furniture Market Key Performance Indicators |
9 Nepal Laboratory Furniture Market - Opportunity Assessment |
9.1 Nepal Laboratory Furniture Market Opportunity Assessment, By Product Type, 2022 & 2032F |
9.2 Nepal Laboratory Furniture Market Opportunity Assessment, By Applications, 2022 & 2032F |
10 Nepal Laboratory Furniture Market - Competitive Landscape |
10.1 Nepal Laboratory Furniture Market Revenue Share, By Companies, 2025 |
10.2 Nepal Laboratory Furniture Market Competitive Benchmarking, By Operating and Technical Parameters |
11 Company Profiles |
12 Recommendations |
13 Disclaimer |
Global Go To Market Strategy - 2030
Export potential enables firms to identify high-growth global markets with greater confidence by combining advanced trade intelligence with a structured quantitative methodology. The framework analyzes emerging demand trends and country-level import patterns while integrating macroeconomic and trade datasets such as GDP and population forecasts, bilateral import–export flows, tariff structures, elasticity differentials between developed and developing economies, geographic distance, and import demand projections. Using weighted trade values from 2020–2024 as the base period to project country-to-country export potential for 2030, these inputs are operationalized through calculated drivers such as gravity model parameters, tariff impact factors, and projected GDP per-capita growth. Through an analysis of hidden potentials, demand hotspots, and market conditions that are most favorable to success, this method enables firms to focus on target countries, maximize returns, and global expansion with data, backed by accuracy.
By factoring in the projected importer demand gap that is currently unmet and could be potential opportunity, it identifies the potential for the Exporter (Country) among 190 countries, against the general trade analysis, which identifies the biggest importer or exporter.
To discover high-growth global markets and optimize your business strategy:
Click Here
Pricing
- Single User License$ 1,995
- Department License$ 2,400
- Site License$ 3,120
- Global License$ 3,795

Leadership Perspectives from Industry Events
Search
Thought Leadership and Analyst Meet


Our Clients
6WResearch In News
- India Air Conditioner Market Set for Strong Rebound in 2026 After Weather-Led Correction and GST-Driven Recovery: 6Wresearch
- ADAS in India: How Automatic Emergency Braking, Blind Spot Detection & Driver Monitoring are Transforming Road Safety
- Doha a strategic location for EV manufacturing hub: IPA Qatar
- Demand for luxury TVs surging in the GCC, says Samsung
- Empowering Growth: The Thriving Journey of Bangladesh’s Cable Industry
- Demand for luxury TVs surging in the GCC, says Samsung
Latest Reports
- Nicaragua RPG Gaming Market (2026-2032)
- New Zealand RPG Gaming Market (2026-2032)
- Netherlands RPG Gaming Market (2026-2032)
- Nauru RPG Gaming Market (2026-2032)
- Namibia RPG Gaming Market (2026-2032)
- Mozambique RPG Gaming Market (2026-2032)
- Montenegro RPG Gaming Market (2026-2032)
- Mongolia RPG Gaming Market (2026-2032)
- Monaco RPG Gaming Market (2026-2032)
- Micronesia RPG Gaming Market (2026-2032)
Industry Events and Analyst Meet

EV India Expo 2026

HIMTEX 2026

India Refining Summit 2026

India EV Show 2026

EV tech India Expo 2026
Whitepaper
- Middle East & Africa Commercial Security Market Click here to view more.
- Middle East & Africa Fire Safety Systems & Equipment Market Click here to view more.
- GCC Drone Market Click here to view more.
- Middle East Lighting Fixture Market Click here to view more.
- GCC Physical & Perimeter Security Market Click here to view more.