Nepal Rubber Transmission Belts Market (2026-2032) | Forecast, Companies, Industry, Share, Trends, Size, Value, Outlook, Revenue, Analysis & Growth
Market Forecast By Product (Raw Edged Belts, V-belts, Timing Belts, Wrapped Belts, Specialty Belts, Others), By Application (Industrial, Automotive Components, Agricultural Equipment, Mining, Others) And Competitive Landscape
| Product Code: ETC030116 | Publication Date: Oct 2020 | Updated Date: Jun 2026 | Product Type: Report | |
| Publisher: 6Wresearch | Author: Bhawna Singh | No. of Pages: 70 | No. of Figures: 35 | No. of Tables: 5 |
Nepal Rubber Transmission Belts Market Summary
The nepal rubber transmission belts market was estimated at USD 385 Million in 2025 and is projected to reach USD 517 Million by 2032, growing at a CAGR of 4.9% from 2026 to 2032.
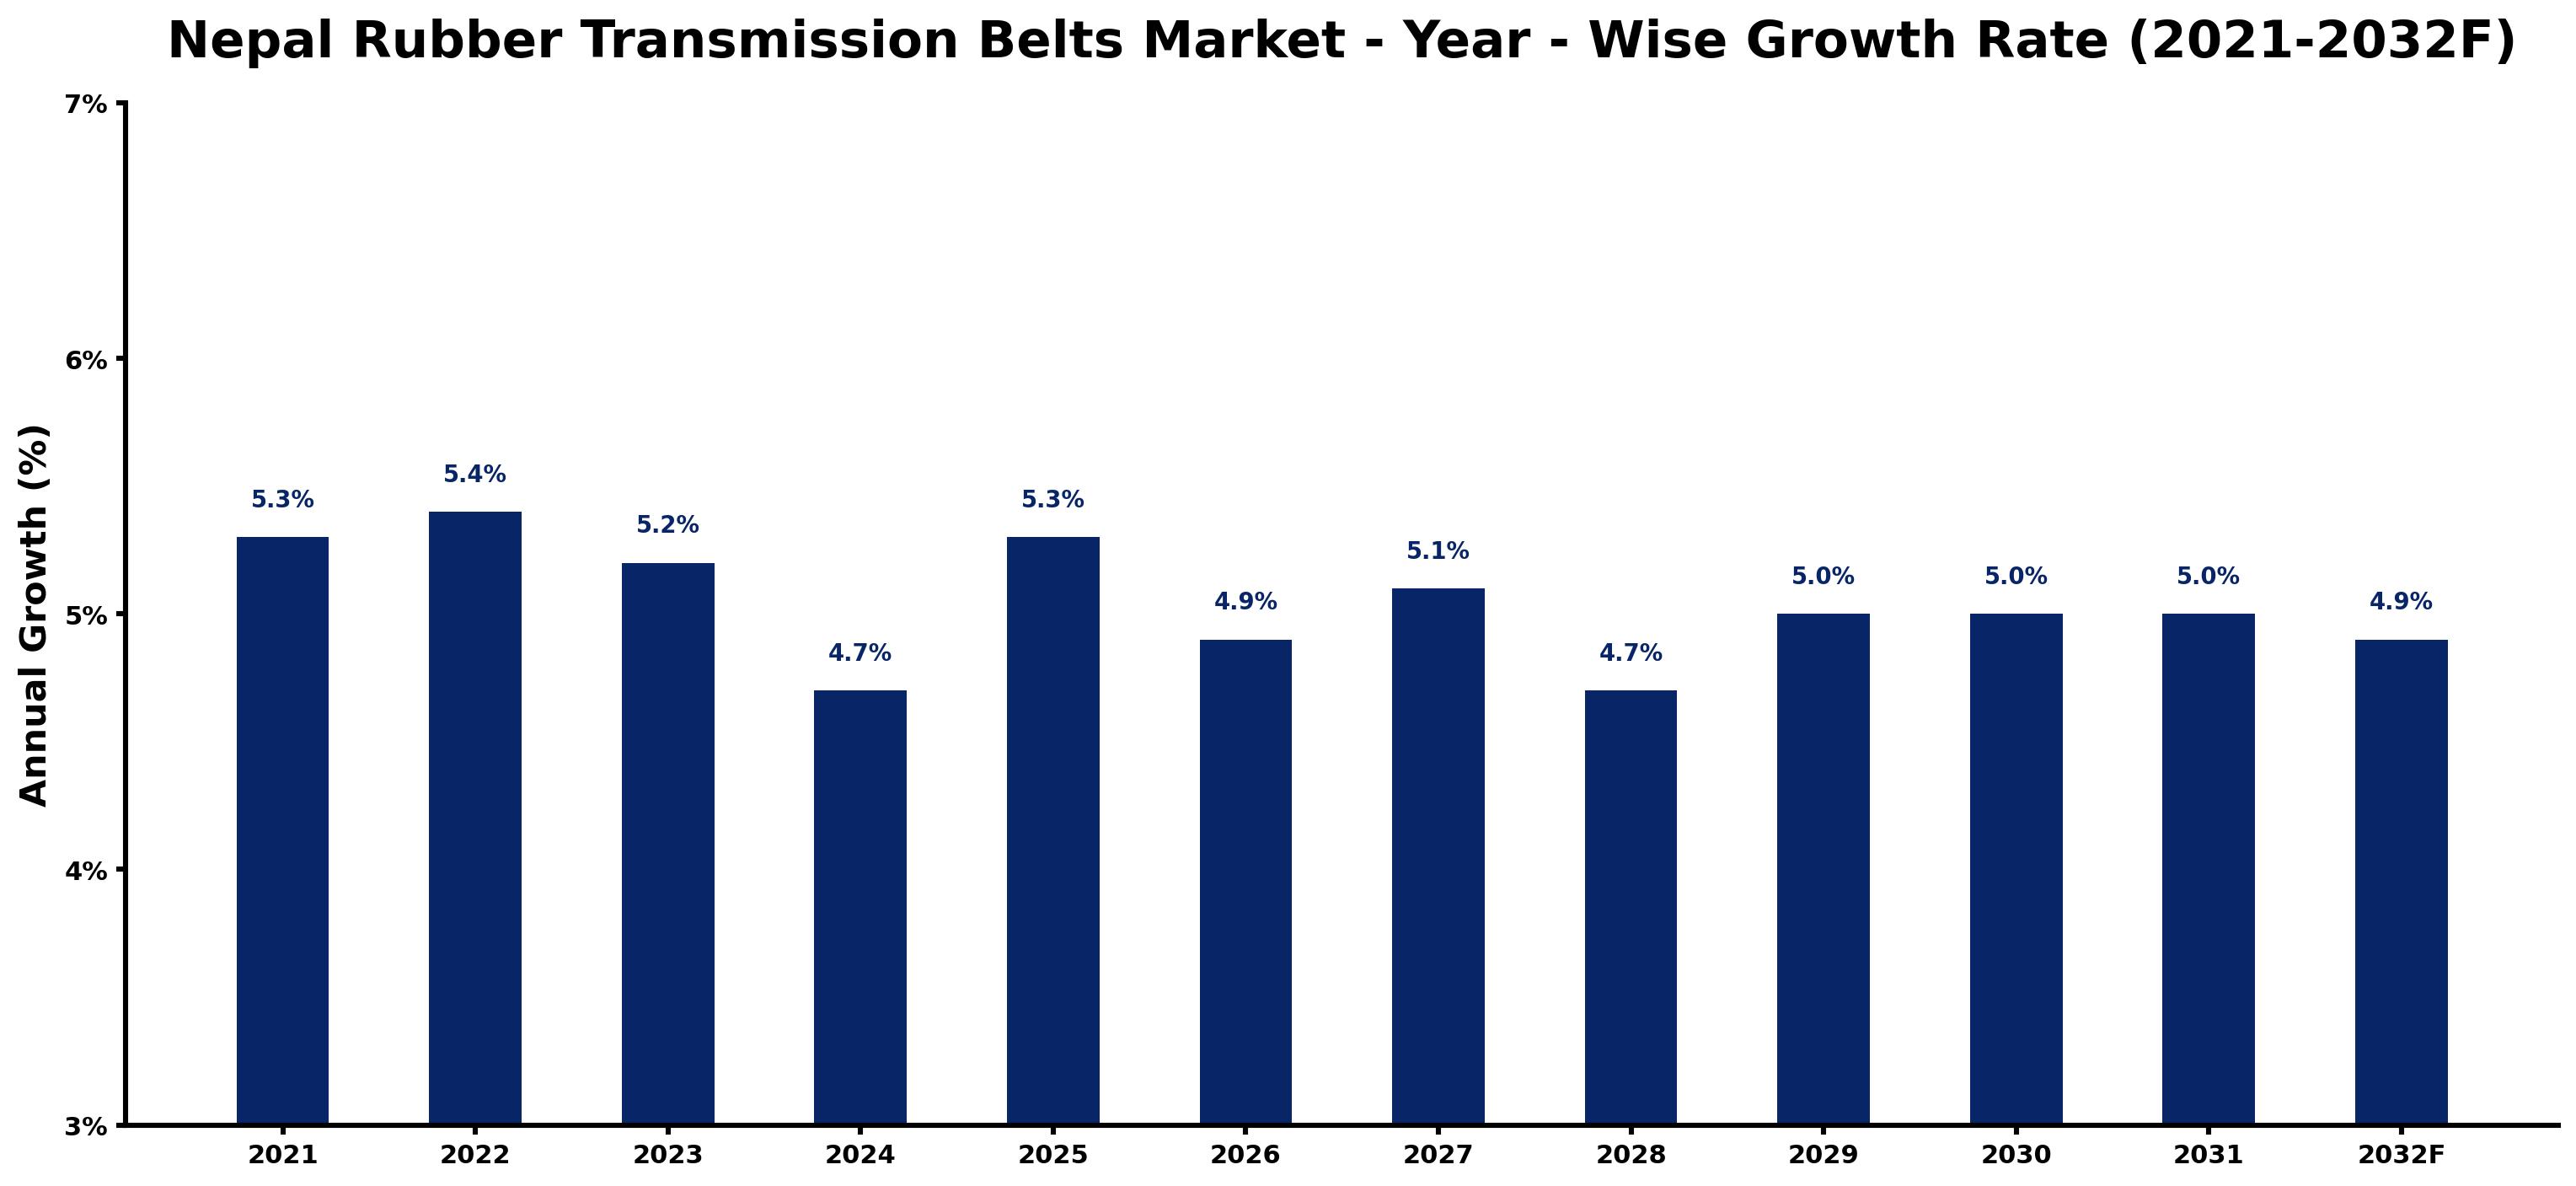
Nepal Rubber Transmission Belts Market Growth Rate Analysis (2021-2032)
The Nepal rubber transmission belts market has showcased stable growth, with annual growth rates fluctuating between 4.7% and 5.4% from 2021 through 2027. Demand remained resilient due to increased investments in various industrial sectors and ongoing infrastructure projects. Particularly, the growth of the manufacturing and automotive industries fueled the need for robust transmission solutions. The slight dip to 4.7% in 2024 can be attributed to temporary supply chain disruptions and a tech shift towards more efficient materials. However, a rebound to 5.3% in 2025 illustrates recovery, driven by surging consumer demand and the ongoing energy transition that necessitates upgraded machinery. By 2032, growth stabilizes at approximately 4.9%, reflecting a balanced market adjustment.
Nepal Rubber Transmission Belts Market Year-wise Growth Rate and Key Drivers
This graph highlights how the Nepal Rubber Transmission Belts Market has steadily grown over the past five years, supported by major growth factors.
The table below presents the year wise growth rates along with the key drivers influencing the market
| Year | Growth Rate | Major Drivers |
| 2021 | 5.3% | The manufacturing sector's recovery begins to boost rubber belt requirements in Nepal. |
| 2022 | 5.4% | Infrastructure projects see increased allocations, enhancing demand for transmission belts. |
| 2023 | 5.2% | Local industries focus on quality, prompting shifts towards advanced rubber belt technologies. |
| 2024 | 4.7% | Rising awareness of maintenance efficiency elevates the importance of reliable belts. |
| 2025 | 5.3% | Global supply chain adjustments lead to localized production of rubber components. |
| 2026 | 4.9% | Adoption of eco-friendly materials influences the market dynamics for rubber products. |
| 2027 | 5.1% | Emerging industries, such as renewable energy, create unique rubber transmission needs. |
| 2028 | 4.7% | Technological enhancements in manufacturing processes increase the reliability of transmission belts. |
| 2029 | 5.0% | International partnerships are established, influencing innovation within the local rubber market. |
| 2030 | 5.0% | Expanding automotive sector drives robust requirements for high-performance rubber belts. |
| 2031 | 5.0% | Competitive pricing strategies emerge as domestic producers seek to capture market share. |
| 2032 | 4.9% | Comprehensive research and development efforts lead to enhanced product diversification. |
Note - Market size estimations and growth projections presented in this report are based on 6Wresearch's advanced forecasting approach, validated with industry datasets as of June 2026.
Nepal Rubber Transmission Belts Market Synopsis
The Nepal Rubber Transmission Belts Market is projected to reach 4.9% and witness significant growth during the forecast period (2026-2032). This growth is largely attributed to the continuous expansion of Nepal's industrial sector, which is increasingly utilizing machinery and equipment that require dependable rubber transmission belts. Key industries such as automotive, agriculture, and manufacturing are fuelling the demand for these essential components, primarily for their role in conveyor systems that enhance operational efficiency.
Nepal Rubber Transmission Belts Market Growth Drivers
The primary drivers stimulating growth in the Nepal Rubber Transmission Belts Market can be identified as follows:
- The expanding industrial base in Nepal has increased the need for machinery that relies on rubber transmission belts for optimal functioning.
- The automotive sector's growing demand for advanced conveyor systems promotes the use of high-quality rubber belts, enhancing power transmission capabilities.
- Agricultural advancements, including mechanization and the use of specialized equipment, are driving higher consumption of rubber transmission belts to support farming operations.
- Infrastructural development initiatives led by the government are stimulating investment in construction, thereby increasing the demand for reliable conveyor systems that utilize rubber transmission belts.
- The push for sustainability has encouraged manufacturers to innovate and produce eco-friendly rubber belts, attracting industries committed to reducing their environmental footprint.
Nepal Rubber Transmission Belts Market Trends and Opportunities
The Nepal Rubber Transmission Belts Market is currently experiencing several notable trends that present opportunities for growth and innovation:
- A marked shift towards lightweight and high-strength transmission belts is observable, enhancing efficiency in various industrial applications.
- Manufacturers are increasingly focused on incorporating sustainable practices, leading to the development of eco-friendly rubber transmission belts that cater to environmentally conscious consumers.
- Technological advancements in manufacturing processes are enhancing product quality, with innovations leading to belts that exhibit greater durability and reliability.
- There is a trend towards expanding product portfolios to include a diverse array of transmission belts tailored to meet the specific requirements of different sectors, enhancing market competitiveness.
- The rise of digital technologies is influencing the development of smart belts that integrate monitoring systems for real-time performance analysis, appealing to industries keen on optimizing operations.
Nepal Rubber Transmission Belts Market Challenges and Restraints
Despite the growth potential, the Nepal Rubber Transmission Belts Market faces certain challenges that could hinder its overall development:
- Fluctuating raw material prices pose a significant threat to manufacturers, leading to volatility in production costs and pricing strategies.
- Competition from alternative materials that offer cost advantages may reduce the market share of traditional rubber transmission belts.
- Inconsistent quality of locally sourced raw materials can affect product reliability and brand reputation among consumers.
- Limited technological advancements in the local manufacturing sector can lead to inefficiencies and higher operational costs, affecting competitiveness.
- Inadequate infrastructure and logistics services can result in delays in product delivery, impacting customer satisfaction and market dynamics.
Nepal Rubber Transmission Belts Market Investment Opportunities
The evolving landscape of the Nepal Rubber Transmission Belts Market presents multiple avenues for investment, particularly in the following areas:
- Investing in high-quality production facilities to manufacture rubber transmission belts could yield strong returns, given the essential role these components play across various sectors.
- The booming construction industry and increasing infrastructure projects create a significant opportunity for providing conveyor systems using rubber belts, supported by government initiatives.
- There is potential for investments in technological advancements to create eco-friendly and energy-efficient rubber transmission belts that align with sustainability goals.
- Collaborations with international partners for knowledge transfer in manufacturing technologies and raw material sourcing could enhance product quality and market viability.
- Exploring export opportunities could open new markets for rubber transmission belts manufactured in Nepal, thus broadening the revenue base for local manufacturers.
Nepal Rubber Transmission Belts Market Government Investment and Initiatives
The government of Nepal has initiated various policies to bolster the rubber transmission belts market, highlighting a commitment to local production and industry support. Key initiatives include:
- Subsidies for local manufacturers aim to reduce production costs, encouraging the establishment and expansion of rubber belt production facilities.
- Promotion of research and development activities is incentivized, fostering innovation in the manufacturing processes and product quality.
- Regulations have been implemented to ensure that rubber transmission belts meet quality standards and specifications, aligning with international benchmarks.
- Infrastructure developments are being prioritized to enhance logistics and distribution networks, facilitating smoother operations for local manufacturers.
- Incentives for exporting rubber transmission belts are being designed to broaden market access and increase foreign exchange earnings for the country.
Nepal Rubber Transmission Belts Market Latest Developments (May 2025 - June 2026)
Recent developments in the Nepal Rubber Transmission Belts Market reflect a firm commitment towards modernization and adherence to quality standards. Key industry movements during the specified period include:
- An increase in collaborations between local manufacturers and international technology providers to enhance manufacturing capabilities and product offerings.
- Launches of new product lines focusing on lightweight and high-strength rubber transmission belts designed for enhanced efficiency.
- Growing participation in trade fairs and exhibitions aimed at showcasing advancements in rubber belt technologies, thus fostering industry networking.
- Government initiatives aimed at improving quality standards are being reinforced, with emphasis on eco-friendly materials in belt production.
- Enhanced promotional activities focusing on the benefits of quality rubber transmission belts have increased awareness among potential industrial consumers.
Nepal Rubber Transmission Belts Market - Key Attractiveness of the Report
- 10 Years of Market Numbers
- Historical Data Starting from 2022 to 2025
- Base Year: 2025
- Forecast Data until 2032
- Key Performance Indicators Impacting the Market
- Major Upcoming Developments and Projects
Key Highlights of the Report:
- Nepal Rubber Transmission Belts Market Outlook
- Market Size of Nepal Rubber Transmission Belts Market, 2025
- Forecast of Nepal Rubber Transmission Belts Market, 2032F
- Historical Data and Forecast of Nepal Rubber Transmission Belts Revenues & Volume for the Period 2022-2032F
- Nepal Rubber Transmission Belts Market Trend Evolution
- Nepal Rubber Transmission Belts Market Drivers and Challenges
- Nepal Rubber Transmission Belts Price Trends
- Nepal Rubber Transmission Belts Porter's Five Forces
- Nepal Rubber Transmission Belts Industry Life Cycle
- Historical Data and Forecast of Nepal Rubber Transmission Belts Market Revenues & Volume By Product for the Period 2022-2032F
- Historical Data and Forecast of Nepal Rubber Transmission Belts Market Revenues & Volume By Raw Edged Belts for the Period 2022-2032F
- Historical Data and Forecast of Nepal Rubber Transmission Belts Market Revenues & Volume By V-belts for the Period 2022-2032F
- Historical Data and Forecast of Nepal Rubber Transmission Belts Market Revenues & Volume By Timing Belts for the Period 2022-2032F
- Historical Data and Forecast of Nepal Rubber Transmission Belts Market Revenues & Volume By Wrapped Belts for the Period 2022-2032F
- Historical Data and Forecast of Nepal Rubber Transmission Belts Market Revenues & Volume By Specialty Belts for the Period 2022-2032F
- Historical Data and Forecast of Nepal Rubber Transmission Belts Market Revenues & Volume By Others for the Period 2022-2032F
- Historical Data and Forecast of Nepal Rubber Transmission Belts Market Revenues & Volume By Application for the Period 2022-2032F
- Historical Data and Forecast of Nepal Rubber Transmission Belts Market Revenues & Volume By Industrial for the Period 2022-2032F
- Historical Data and Forecast of Nepal Rubber Transmission Belts Market Revenues & Volume By Automotive Components for the Period 2022-2032F
- Historical Data and Forecast of Nepal Rubber Transmission Belts Market Revenues & Volume By Agricultural Equipment for the Period 2022-2032F
- Historical Data and Forecast of Nepal Rubber Transmission Belts Market Revenues & Volume By Mining for the Period 2022-2032F
- Historical Data and Forecast of Nepal Rubber Transmission Belts Market Revenues & Volume By Others for the Period 2022-2032F
- Nepal Rubber Transmission Belts Import Export Trade Statistics
- Market Opportunity Assessment By Product
- Market Opportunity Assessment By Application
- Nepal Rubber Transmission Belts Top Companies Market Share
- Nepal Rubber Transmission Belts Competitive Benchmarking By Technical and Operational Parameters
- Nepal Rubber Transmission Belts Company Profiles
- Nepal Rubber Transmission Belts Key Strategic Recommendations
Frequently Asked Questions About the Market Study (FAQs):
Key factors driving growth include the expanding industrial sector, increasing automotive and agricultural demands, and rising infrastructure projects promoting the use of rubber transmission belts.
Challenges include fluctuating raw material prices, competition from alternative materials, and infrastructural limitations that affect logistics and distribution.
The government is providing subsidies for local production, promoting R&D, enforcing quality regulations, and enhancing infrastructure capabilities to support the rubber transmission belts market.
Investment opportunities include production facilities, technological advancements, eco-friendly solutions, export initiatives, and collaborations for knowledge transfer.
6Wresearch actively monitors the Nepal Rubber Transmission Belts Market and publishes its comprehensive annual report, highlighting emerging trends, growth drivers, revenue analysis, and forecast outlook. Our insights help businesses to make data-backed strategic decisions with ongoing market dynamics. Our analysts track relevent industries related to the Nepal Rubber Transmission Belts Market, allowing our clients with actionable intelligence and reliable forecasts tailored to emerging regional needs.
Yes, we provide customisation as per your requirements. To learn more, feel free to contact us on sales@6wresearch.com
1 Executive Summary |
2 Introduction |
2.1 Key Highlights of the Report |
2.2 Report Description |
2.3 Market Scope & Segmentation |
2.4 Research Methodology |
2.5 Assumptions |
3 Nepal Rubber Transmission Belts Market Overview |
3.1 Nepal Country Macro Economic Indicators |
3.2 Nepal Rubber Transmission Belts Market Revenues & Volume, 2022 & 2032F |
3.3 Nepal Rubber Transmission Belts Market - Industry Life Cycle |
3.4 Nepal Rubber Transmission Belts Market - Porter's Five Forces |
3.5 Nepal Rubber Transmission Belts Market Revenues & Volume Share, By Product, 2022 & 2032F |
3.6 Nepal Rubber Transmission Belts Market Revenues & Volume Share, By Application, 2022 & 2032F |
4 Nepal Rubber Transmission Belts Market Dynamics |
4.1 Impact Analysis |
4.2 Market Drivers |
4.3 Market Restraints |
5 Nepal Rubber Transmission Belts Market Trends |
6 Nepal Rubber Transmission Belts Market, By Types |
6.1 Nepal Rubber Transmission Belts Market, By Product |
6.1.1 Overview and Analysis |
6.1.2 Nepal Rubber Transmission Belts Market Revenues & Volume, By Product, 2022-2032F |
6.1.3 Nepal Rubber Transmission Belts Market Revenues & Volume, By Raw Edged Belts, 2022-2032F |
6.1.4 Nepal Rubber Transmission Belts Market Revenues & Volume, By V-belts, 2022-2032F |
6.1.5 Nepal Rubber Transmission Belts Market Revenues & Volume, By Timing Belts, 2022-2032F |
6.1.6 Nepal Rubber Transmission Belts Market Revenues & Volume, By Wrapped Belts, 2022-2032F |
6.1.7 Nepal Rubber Transmission Belts Market Revenues & Volume, By Specialty Belts, 2022-2032F |
6.1.8 Nepal Rubber Transmission Belts Market Revenues & Volume, By Others, 2022-2032F |
6.2 Nepal Rubber Transmission Belts Market, By Application |
6.2.1 Overview and Analysis |
6.2.2 Nepal Rubber Transmission Belts Market Revenues & Volume, By Industrial, 2022-2032F |
6.2.3 Nepal Rubber Transmission Belts Market Revenues & Volume, By Automotive Components, 2022-2032F |
6.2.4 Nepal Rubber Transmission Belts Market Revenues & Volume, By Agricultural Equipment, 2022-2032F |
6.2.5 Nepal Rubber Transmission Belts Market Revenues & Volume, By Mining, 2022-2032F |
6.2.6 Nepal Rubber Transmission Belts Market Revenues & Volume, By Others, 2022-2032F |
7 Nepal Rubber Transmission Belts Market Import-Export Trade Statistics |
7.1 Nepal Rubber Transmission Belts Market Export to Major Countries |
7.2 Nepal Rubber Transmission Belts Market Imports from Major Countries |
8 Nepal Rubber Transmission Belts Market Key Performance Indicators |
9 Nepal Rubber Transmission Belts Market - Opportunity Assessment |
9.1 Nepal Rubber Transmission Belts Market Opportunity Assessment, By Product, 2022 & 2032F |
9.2 Nepal Rubber Transmission Belts Market Opportunity Assessment, By Application, 2022 & 2032F |
10 Nepal Rubber Transmission Belts Market - Competitive Landscape |
10.1 Nepal Rubber Transmission Belts Market Revenue Share, By Companies, 2025 |
10.2 Nepal Rubber Transmission Belts Market Competitive Benchmarking, By Operating and Technical Parameters |
11 Company Profiles |
12 Recommendations |
13 Disclaimer |
Global Go To Market Strategy - 2030
Export potential enables firms to identify high-growth global markets with greater confidence by combining advanced trade intelligence with a structured quantitative methodology. The framework analyzes emerging demand trends and country-level import patterns while integrating macroeconomic and trade datasets such as GDP and population forecasts, bilateral import–export flows, tariff structures, elasticity differentials between developed and developing economies, geographic distance, and import demand projections. Using weighted trade values from 2020–2024 as the base period to project country-to-country export potential for 2030, these inputs are operationalized through calculated drivers such as gravity model parameters, tariff impact factors, and projected GDP per-capita growth. Through an analysis of hidden potentials, demand hotspots, and market conditions that are most favorable to success, this method enables firms to focus on target countries, maximize returns, and global expansion with data, backed by accuracy.
By factoring in the projected importer demand gap that is currently unmet and could be potential opportunity, it identifies the potential for the Exporter (Country) among 190 countries, against the general trade analysis, which identifies the biggest importer or exporter.
To discover high-growth global markets and optimize your business strategy:
Click Here
Pricing
- Single User License$ 1,995
- Department License$ 2,400
- Site License$ 3,120
- Global License$ 3,795

Leadership Perspectives from Industry Events
Search
Thought Leadership and Analyst Meet


Our Clients
6WResearch In News
- India Air Conditioner Market Set for Strong Rebound in 2026 After Weather-Led Correction and GST-Driven Recovery: 6Wresearch
- ADAS in India: How Automatic Emergency Braking, Blind Spot Detection & Driver Monitoring are Transforming Road Safety
- Doha a strategic location for EV manufacturing hub: IPA Qatar
- Demand for luxury TVs surging in the GCC, says Samsung
- Empowering Growth: The Thriving Journey of Bangladesh’s Cable Industry
- Demand for luxury TVs surging in the GCC, says Samsung
Latest Reports
- Nicaragua RPG Gaming Market (2026-2032)
- New Zealand RPG Gaming Market (2026-2032)
- Netherlands RPG Gaming Market (2026-2032)
- Nauru RPG Gaming Market (2026-2032)
- Namibia RPG Gaming Market (2026-2032)
- Mozambique RPG Gaming Market (2026-2032)
- Montenegro RPG Gaming Market (2026-2032)
- Mongolia RPG Gaming Market (2026-2032)
- Monaco RPG Gaming Market (2026-2032)
- Micronesia RPG Gaming Market (2026-2032)
Industry Events and Analyst Meet

HIMTEX 2026

India Refining Summit 2026

India EV Show 2026

EV tech India Expo 2026

Auto Tech Asia 2026
Whitepaper
- Middle East & Africa Commercial Security Market Click here to view more.
- Middle East & Africa Fire Safety Systems & Equipment Market Click here to view more.
- GCC Drone Market Click here to view more.
- Middle East Lighting Fixture Market Click here to view more.
- GCC Physical & Perimeter Security Market Click here to view more.