Netherlands Automated Fluid Dispensing Systems Market (2026-2032) | Strategic Insights, Outlook, Size, Forecast, Strategy, Trends, Opportunities, Competition, Segmentation, Consumer Insights, Growth, Segments, Analysis, Drivers, Investment Trends, Supply, Restraints, Companies, Industry, Revenue, Challenges, Demand, Share, Pricing Analysis, Competitive, Value
Market Forecast By Product Type (Fluid Dispensers, Automated Liquid Systems, Syringe Pumps), By Application (Medical Devices, Healthcare, Biotech), By End User (Drug Delivery, Lab Testing, Medical Research), By Functionality (Precision Dispensing, Liquid Handling, Automated Fluid Control) And Competitive Landscape
| Product Code: ETC10325772 | Publication Date: Apr 2025 | Updated Date: Apr 2026 | Product Type: Market Research Report | |
| Publisher: 6Wresearch | Author: Bhawna Singh | No. of Pages: 65 | No. of Figures: 34 | No. of Tables: 19 |
Netherlands Automated Fluid Dispensing Systems Market Size (2020-2030)
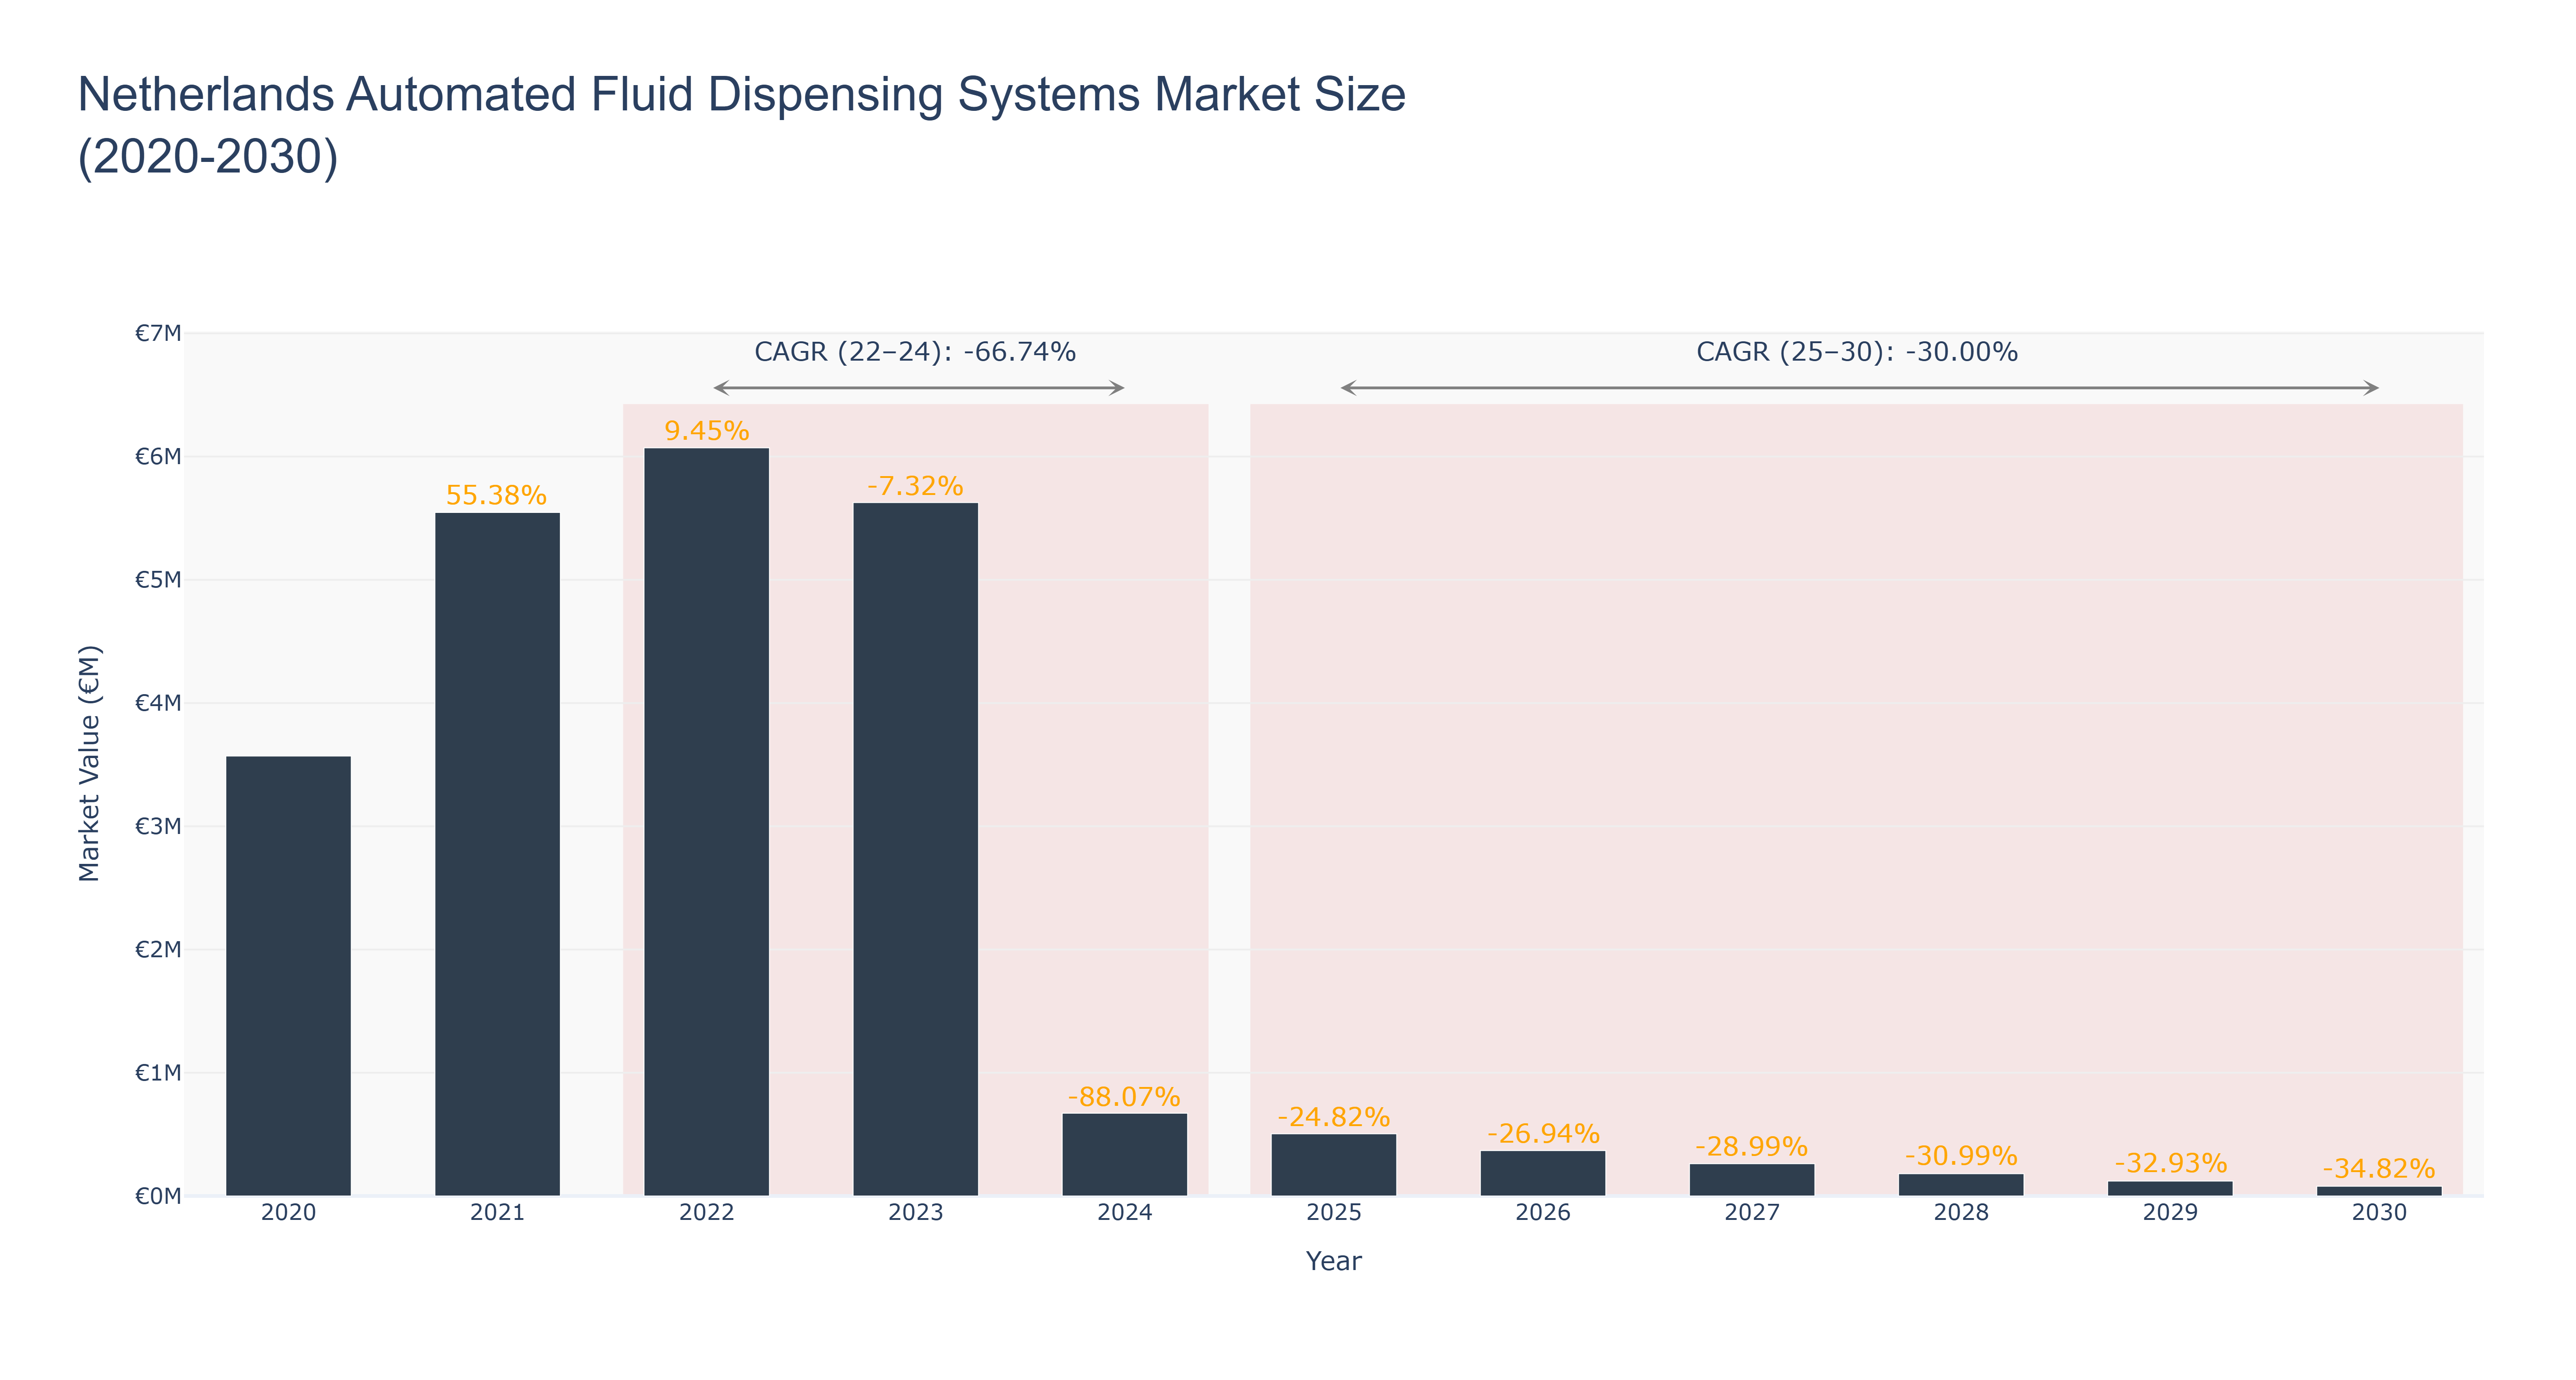
The Netherlands Automated Fluid Dispensing Systems Market experienced significant fluctuations from 2020 to 2024, peaking at €6.07 million in 2022 before declining to €671.56 thousand in 2024, reflecting a sharp CAGR of -66.74% during this actual period. The market saw robust growth in 2021 at 55.38% but faced subsequent contractions due to increased competition and shifts in customer preferences towards alternative technologies. Looking ahead, the forecasted period from 2025 to 2030 indicates continued decline, with projected market sizes decreasing from €504.85 thousand in 2025 to €79.01 thousand by 2030, resulting in an anticipated CAGR of -30.00%. This downturn may be driven by ongoing technological advancements that render traditional dispensing systems less relevant. While specific upcoming projects are not highlighted, the market's future will likely be influenced by broader automation trends and potential regulatory changes aimed at enhancing efficiency in industrial applications.
Netherlands Automated Fluid Dispensing Systems Market: Production & Trade Performance (2019-2025)
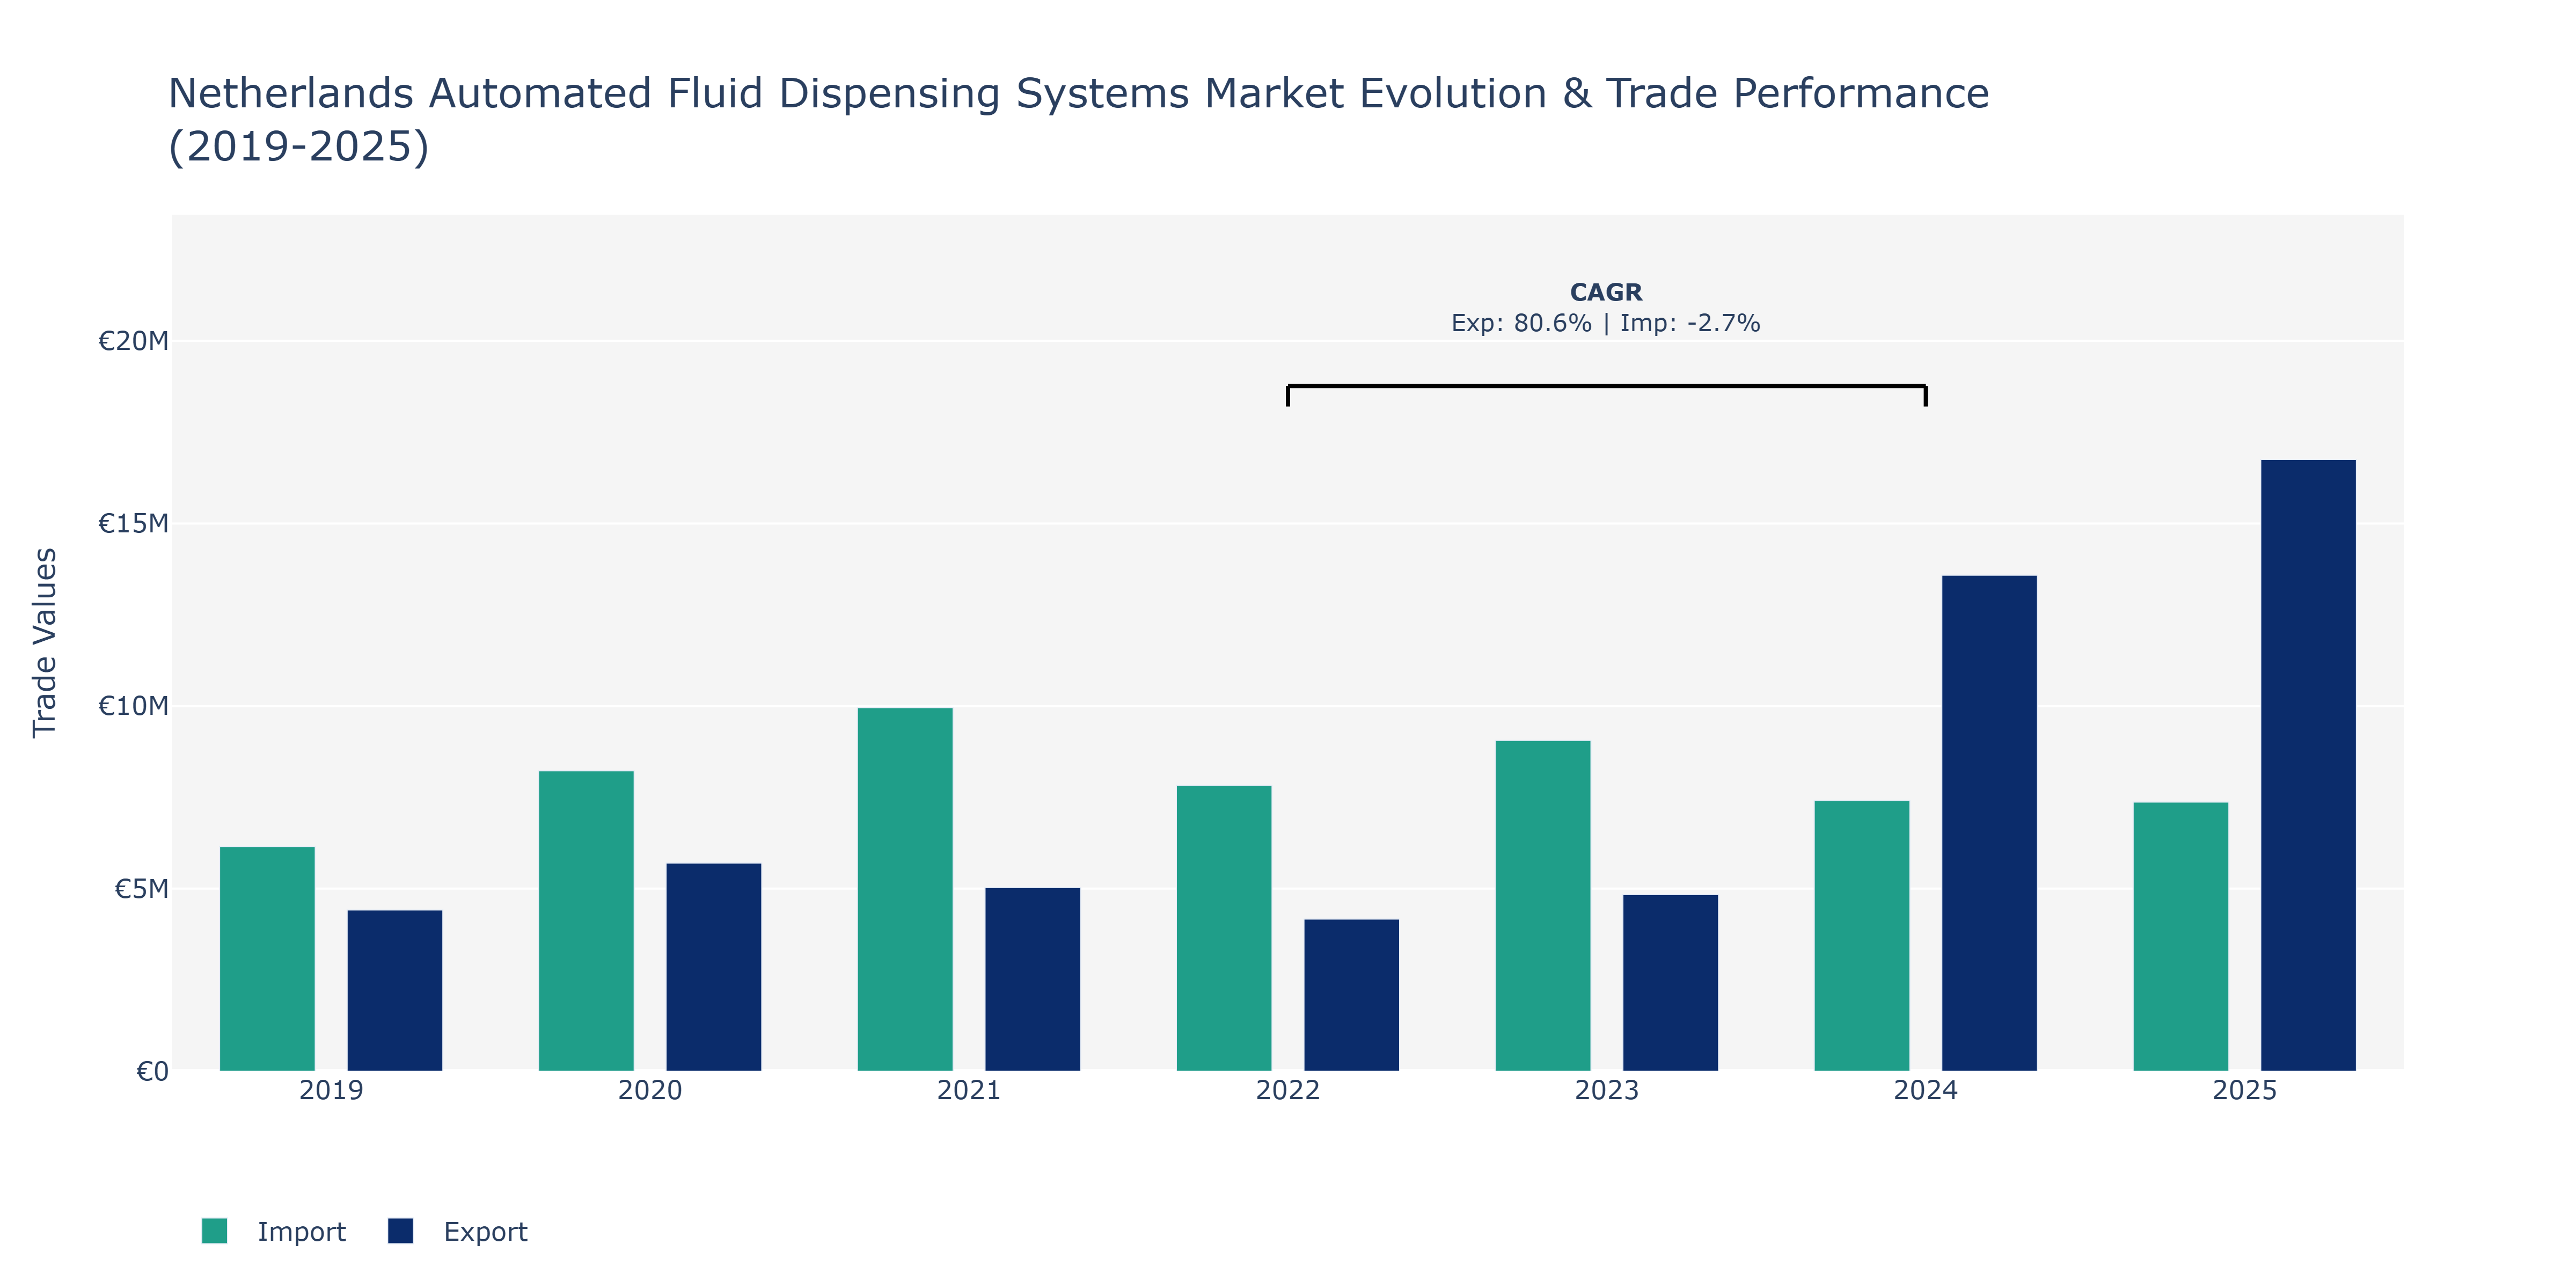
The Netherlands Automated Fluid Dispensing Systems Market experienced various shifts in exports and imports from 2019 to 2025. Notably, exports surged from €4.42 million in 2019 to €16.76 million in 2025, showcasing a consistent upward trajectory with a peak in 2025. Conversely, imports fluctuated, reaching their highest in 2021 at €9.96 million before declining to €7.37 million in 2025. The substantial growth in exports can be attributed to the increasing demand for automated fluid dispensing systems globally, driven by advancements in industries such as electronics manufacturing and healthcare. On the other hand, the fluctuations in imports may reflect evolving supply chain dynamics, changes in trade policies, or efforts to enhance domestic production capabilities. To sustain market growth, Netherlands-based manufacturers could focus on innovation, quality assurance, and efficient distribution networks to capitalize on export opportunities and mitigate import volatility.
Key Highlights of the Report:
- Netherlands Automated Fluid Dispensing Systems Market Outlook
- Market Size of Netherlands Automated Fluid Dispensing Systems Market, 2025
- Forecast of Netherlands Automated Fluid Dispensing Systems Market, 2032
- Historical Data and Forecast of Netherlands Automated Fluid Dispensing Systems Revenues & Volume for the Period 2022 - 2032F
- Netherlands Automated Fluid Dispensing Systems Market Trend Evolution
- Netherlands Automated Fluid Dispensing Systems Market Drivers and Challenges
- Netherlands Automated Fluid Dispensing Systems Price Trends
- Netherlands Automated Fluid Dispensing Systems Porter's Five Forces
- Netherlands Automated Fluid Dispensing Systems Industry Life Cycle
- Historical Data and Forecast of Netherlands Automated Fluid Dispensing Systems Market Revenues & Volume By Product Type for the Period 2022 - 2032F
- Historical Data and Forecast of Netherlands Automated Fluid Dispensing Systems Market Revenues & Volume By Fluid Dispensers for the Period 2022 - 2032F
- Historical Data and Forecast of Netherlands Automated Fluid Dispensing Systems Market Revenues & Volume By Automated Liquid Systems for the Period 2022 - 2032F
- Historical Data and Forecast of Netherlands Automated Fluid Dispensing Systems Market Revenues & Volume By Syringe Pumps for the Period 2022 - 2032F
- Historical Data and Forecast of Netherlands Automated Fluid Dispensing Systems Market Revenues & Volume By Application for the Period 2022 - 2032F
- Historical Data and Forecast of Netherlands Automated Fluid Dispensing Systems Market Revenues & Volume By Medical Devices for the Period 2022 - 2032F
- Historical Data and Forecast of Netherlands Automated Fluid Dispensing Systems Market Revenues & Volume By Healthcare for the Period 2022 - 2032F
- Historical Data and Forecast of Netherlands Automated Fluid Dispensing Systems Market Revenues & Volume By Biotech for the Period 2022 - 2032F
- Historical Data and Forecast of Netherlands Automated Fluid Dispensing Systems Market Revenues & Volume By End User for the Period 2022 - 2032F
- Historical Data and Forecast of Netherlands Automated Fluid Dispensing Systems Market Revenues & Volume By Drug Delivery for the Period 2022 - 2032F
- Historical Data and Forecast of Netherlands Automated Fluid Dispensing Systems Market Revenues & Volume By Lab Testing for the Period 2022 - 2032F
- Historical Data and Forecast of Netherlands Automated Fluid Dispensing Systems Market Revenues & Volume By Medical Research for the Period 2022 - 2032F
- Historical Data and Forecast of Netherlands Automated Fluid Dispensing Systems Market Revenues & Volume By Functionality for the Period 2022 - 2032F
- Historical Data and Forecast of Netherlands Automated Fluid Dispensing Systems Market Revenues & Volume By Precision Dispensing for the Period 2022 - 2032F
- Historical Data and Forecast of Netherlands Automated Fluid Dispensing Systems Market Revenues & Volume By Liquid Handling for the Period 2022 - 2032F
- Historical Data and Forecast of Netherlands Automated Fluid Dispensing Systems Market Revenues & Volume By Automated Fluid Control for the Period 2022 - 2032F
- Netherlands Automated Fluid Dispensing Systems Import Export Trade Statistics
- Market Opportunity Assessment By Product Type
- Market Opportunity Assessment By Application
- Market Opportunity Assessment By End User
- Market Opportunity Assessment By Functionality
- Netherlands Automated Fluid Dispensing Systems Top Companies Market Share
- Netherlands Automated Fluid Dispensing Systems Competitive Benchmarking By Technical and Operational Parameters
- Netherlands Automated Fluid Dispensing Systems Company Profiles
- Netherlands Automated Fluid Dispensing Systems Key Strategic Recommendations
Frequently Asked Questions About the Market Study (FAQs):
6Wresearch actively monitors the Netherlands Automated Fluid Dispensing Systems Market and publishes its comprehensive annual report, highlighting emerging trends, growth drivers, revenue analysis, and forecast outlook. Our insights help businesses to make data-backed strategic decisions with ongoing market dynamics. Our analysts track relevent industries related to the Netherlands Automated Fluid Dispensing Systems Market, allowing our clients with actionable intelligence and reliable forecasts tailored to emerging regional needs.
Yes, we provide customisation as per your requirements. To learn more, feel free to contact us on sales@6wresearch.com
1 Executive Summary |
2 Introduction |
2.1 Key Highlights of the Report |
2.2 Report Description |
2.3 Market Scope & Segmentation |
2.4 Research Methodology |
2.5 Assumptions |
3 Netherlands Automated Fluid Dispensing Systems Market Overview |
3.1 Netherlands Country Macro Economic Indicators |
3.2 Netherlands Automated Fluid Dispensing Systems Market Revenues & Volume, 2022 & 2032F |
3.3 Netherlands Automated Fluid Dispensing Systems Market - Industry Life Cycle |
3.4 Netherlands Automated Fluid Dispensing Systems Market - Porter's Five Forces |
3.5 Netherlands Automated Fluid Dispensing Systems Market Revenues & Volume Share, By Product Type, 2022 & 2032F |
3.6 Netherlands Automated Fluid Dispensing Systems Market Revenues & Volume Share, By Application, 2022 & 2032F |
3.7 Netherlands Automated Fluid Dispensing Systems Market Revenues & Volume Share, By End User, 2022 & 2032F |
3.8 Netherlands Automated Fluid Dispensing Systems Market Revenues & Volume Share, By Functionality, 2022 & 2032F |
4 Netherlands Automated Fluid Dispensing Systems Market Dynamics |
4.1 Impact Analysis |
4.2 Market Drivers |
4.2.1 Increasing demand for accuracy and precision in fluid dispensing processes |
4.2.2 Growing adoption of automation technology in manufacturing industries |
4.2.3 Emphasis on reducing waste and improving efficiency in production processes |
4.3 Market Restraints |
4.3.1 High initial investment costs associated with automated fluid dispensing systems |
4.3.2 Lack of skilled workforce to operate and maintain these systems effectively |
4.3.3 Concerns regarding the complexity and reliability of automated systems |
5 Netherlands Automated Fluid Dispensing Systems Market Trends |
6 Netherlands Automated Fluid Dispensing Systems Market, By Types |
6.1 Netherlands Automated Fluid Dispensing Systems Market, By Product Type |
6.1.1 Overview and Analysis |
6.1.2 Netherlands Automated Fluid Dispensing Systems Market Revenues & Volume, By Product Type, 2022 - 2032F |
6.1.3 Netherlands Automated Fluid Dispensing Systems Market Revenues & Volume, By Fluid Dispensers, 2022 - 2032F |
6.1.4 Netherlands Automated Fluid Dispensing Systems Market Revenues & Volume, By Automated Liquid Systems, 2022 - 2032F |
6.1.5 Netherlands Automated Fluid Dispensing Systems Market Revenues & Volume, By Syringe Pumps, 2022 - 2032F |
6.2 Netherlands Automated Fluid Dispensing Systems Market, By Application |
6.2.1 Overview and Analysis |
6.2.2 Netherlands Automated Fluid Dispensing Systems Market Revenues & Volume, By Medical Devices, 2022 - 2032F |
6.2.3 Netherlands Automated Fluid Dispensing Systems Market Revenues & Volume, By Healthcare, 2022 - 2032F |
6.2.4 Netherlands Automated Fluid Dispensing Systems Market Revenues & Volume, By Biotech, 2022 - 2032F |
6.3 Netherlands Automated Fluid Dispensing Systems Market, By End User |
6.3.1 Overview and Analysis |
6.3.2 Netherlands Automated Fluid Dispensing Systems Market Revenues & Volume, By Drug Delivery, 2022 - 2032F |
6.3.3 Netherlands Automated Fluid Dispensing Systems Market Revenues & Volume, By Lab Testing, 2022 - 2032F |
6.3.4 Netherlands Automated Fluid Dispensing Systems Market Revenues & Volume, By Medical Research, 2022 - 2032F |
6.4 Netherlands Automated Fluid Dispensing Systems Market, By Functionality |
6.4.1 Overview and Analysis |
6.4.2 Netherlands Automated Fluid Dispensing Systems Market Revenues & Volume, By Precision Dispensing, 2022 - 2032F |
6.4.3 Netherlands Automated Fluid Dispensing Systems Market Revenues & Volume, By Liquid Handling, 2022 - 2032F |
6.4.4 Netherlands Automated Fluid Dispensing Systems Market Revenues & Volume, By Automated Fluid Control, 2022 - 2032F |
7 Netherlands Automated Fluid Dispensing Systems Market Import-Export Trade Statistics |
7.1 Netherlands Automated Fluid Dispensing Systems Market Export to Major Countries |
7.2 Netherlands Automated Fluid Dispensing Systems Market Imports from Major Countries |
8 Netherlands Automated Fluid Dispensing Systems Market Key Performance Indicators |
8.1 Percentage increase in demand for automated fluid dispensing systems |
8.2 Number of new manufacturing facilities adopting automated fluid dispensing technology |
8.3 Rate of improvement in dispensing accuracy and efficiency |
8.4 Percentage reduction in waste and material usage |
8.5 Increase in customer satisfaction scores related to product quality and consistency |
9 Netherlands Automated Fluid Dispensing Systems Market - Opportunity Assessment |
9.1 Netherlands Automated Fluid Dispensing Systems Market Opportunity Assessment, By Product Type, 2022 & 2032F |
9.2 Netherlands Automated Fluid Dispensing Systems Market Opportunity Assessment, By Application, 2022 & 2032F |
9.3 Netherlands Automated Fluid Dispensing Systems Market Opportunity Assessment, By End User, 2022 & 2032F |
9.4 Netherlands Automated Fluid Dispensing Systems Market Opportunity Assessment, By Functionality, 2022 & 2032F |
10 Netherlands Automated Fluid Dispensing Systems Market - Competitive Landscape |
10.1 Netherlands Automated Fluid Dispensing Systems Market Revenue Share, By Companies, 2025 |
10.2 Netherlands Automated Fluid Dispensing Systems Market Competitive Benchmarking, By Operating and Technical Parameters |
11 Company Profiles |
12 Recommendations |
13 Disclaimer |
Export potential assessment - trade Analytics for 2030
Export potential enables firms to identify high-growth global markets with greater confidence by combining advanced trade intelligence with a structured quantitative methodology. The framework analyzes emerging demand trends and country-level import patterns while integrating macroeconomic and trade datasets such as GDP and population forecasts, bilateral import–export flows, tariff structures, elasticity differentials between developed and developing economies, geographic distance, and import demand projections. Using weighted trade values from 2020–2024 as the base period to project country-to-country export potential for 2030, these inputs are operationalized through calculated drivers such as gravity model parameters, tariff impact factors, and projected GDP per-capita growth. Through an analysis of hidden potentials, demand hotspots, and market conditions that are most favorable to success, this method enables firms to focus on target countries, maximize returns, and global expansion with data, backed by accuracy.
By factoring in the projected importer demand gap that is currently unmet and could be potential opportunity, it identifies the potential for the Exporter (Country) among 190 countries, against the general trade analysis, which identifies the biggest importer or exporter.
To discover high-growth global markets and optimize your business strategy:
Click Here
Pricing
- Single User License$ 1,995
- Department License$ 2,400
- Site License$ 3,120
- Global License$ 3,795

Search
Thought Leadership and Analyst Meet


Our Clients
Latest Reports
- Canada Cloud CFD Market (2026-2032) | Size & Revenue, Industry, Growth, Competitive Landscape, Forecast, Segmentation, Value, Outlook, Trends, Share, Analysis, Companies
- Taiwan Food Delivery Platform Market (2026-2032) | Companies, Outlook, Analysis, Trends, Value, Revenue, Segmentation, Share, Forecast, Competitive Landscape, Growth, Size & Forecast
- United Kingdom (UK) Long-term Care Insurance Market (2026-2032) | Growth, Share, Consumer Insights, Drivers, Opportunities, Competition, Pricing Analysis, Segments, Restraints, Companies, Competitive, Value, Outlook, Size, Demand, Analysis, Challenges, Strategic Insights, Investment Trends, Revenue, Trends, Supply, Forecast
- United Kingdom (UK) Long Term Care Market (2026-2032) | Companies, Outlook, Analysis, Trends, Value, Revenue, Segmentation, Share, Forecast, Competitive Landscape, Growth, Size & Forecast
- Iraq Insulation and Waterproofing Market (2026-2032) | Outlook, Drivers, Growth, Size, Share, Industry, Revenue, Trends, Demand, Competitive, Strategic Insights, Opportunities, Segments, Companies, Challenges, Strategy, Consumer Insights, Analysis, Investment Trends, Value, Segmentation, Forecast, Restraints
- India Switchgear Market Outlook (2026-2032) | Size, Share, Trends, Growth, Revenue, Forecast, Analysis, Value, Outlook
- Pakistan Contraceptive Implants Market (2025-2031) | Demand, Growth, Size, Share, Industry, Pricing Analysis, Competitive, Strategic Insights, Strategy, Consumer Insights, Analysis, Investment Trends, Opportunities, Revenue, Segments, Value, Segmentation, Supply, Forecast, Restraints, Outlook, Competition, Drivers, Trends, Companies, Challenges
- Sri Lanka Packaging Market (2026-2032) | Outlook, Competition, Drivers, Trends, Demand, Pricing Analysis, Competitive, Strategic Insights, Companies, Challenges, Strategy, Consumer Insights, Analysis, Investment Trends, Opportunities, Growth, Size, Share, Industry, Revenue, Segments, Value, Segmentation, Supply, Forecast, Restraints
- India Kids Watches Market (2026-2032) | Strategy, Consumer Insights, Analysis, Investment Trends, Opportunities, Growth, Size, Share, Industry, Revenue, Segments, Value, Segmentation, Supply, Forecast, Restraints, Outlook, Competition, Drivers, Trends, Demand, Pricing Analysis, Competitive, Strategic Insights, Companies, Challenges
- Saudi Arabia Core Assurance Service Market (2025-2031) | Strategy, Consumer Insights, Analysis, Investment Trends, Opportunities, Growth, Size, Share, Industry, Revenue, Segments, Value, Segmentation, Supply, Forecast, Restraints, Outlook, Competition, Drivers, Trends, Demand, Pricing Analysis, Competitive, Strategic Insights, Companies, Challenges
Industry Events and Analyst Meet

India EV Show 2026

EV tech India Expo 2026

Auto Tech Asia 2026

Battery Tech India 2026

Smart Production Solutions Guangzhou 2026
Whitepaper
- Middle East & Africa Commercial Security Market Click here to view more.
- Middle East & Africa Fire Safety Systems & Equipment Market Click here to view more.
- GCC Drone Market Click here to view more.
- Middle East Lighting Fixture Market Click here to view more.
- GCC Physical & Perimeter Security Market Click here to view more.
6WResearch In News
- Doha a strategic location for EV manufacturing hub: IPA Qatar
- Demand for luxury TVs surging in the GCC, says Samsung
- Empowering Growth: The Thriving Journey of Bangladesh’s Cable Industry
- Demand for luxury TVs surging in the GCC, says Samsung
- Video call with a traditional healer? Once unthinkable, it’s now common in South Africa
- Intelligent Buildings To Smooth GCC’s Path To Net Zero