Netherlands Carbonated Beverages Market (2026-2032) | Industry, Value, Companies, Outlook, Revenue, Size, Share, Growth, Segmentation, Analysis, Trends & Forecast
Market Forecast By Product Types (Soft Drinks, Carbonated Water, Sports & Energy Drinks, Others), By Flavour (Cola, Fruit Based, Others), By Distribution Channel (Hypermarkets & Supermarkets, Convenience Stores, Food Service Outlets, Transport Terminals, Online Stores & D2C) And Competitive Landscape
| Product Code: ETC5375538 | Publication Date: Nov 2023 | Updated Date: Apr 2026 | Product Type: Market Research Report | |
| Publisher: 6Wresearch | Author: Bhawna Singh | No. of Pages: 60 | No. of Figures: 30 | No. of Tables: 5 |
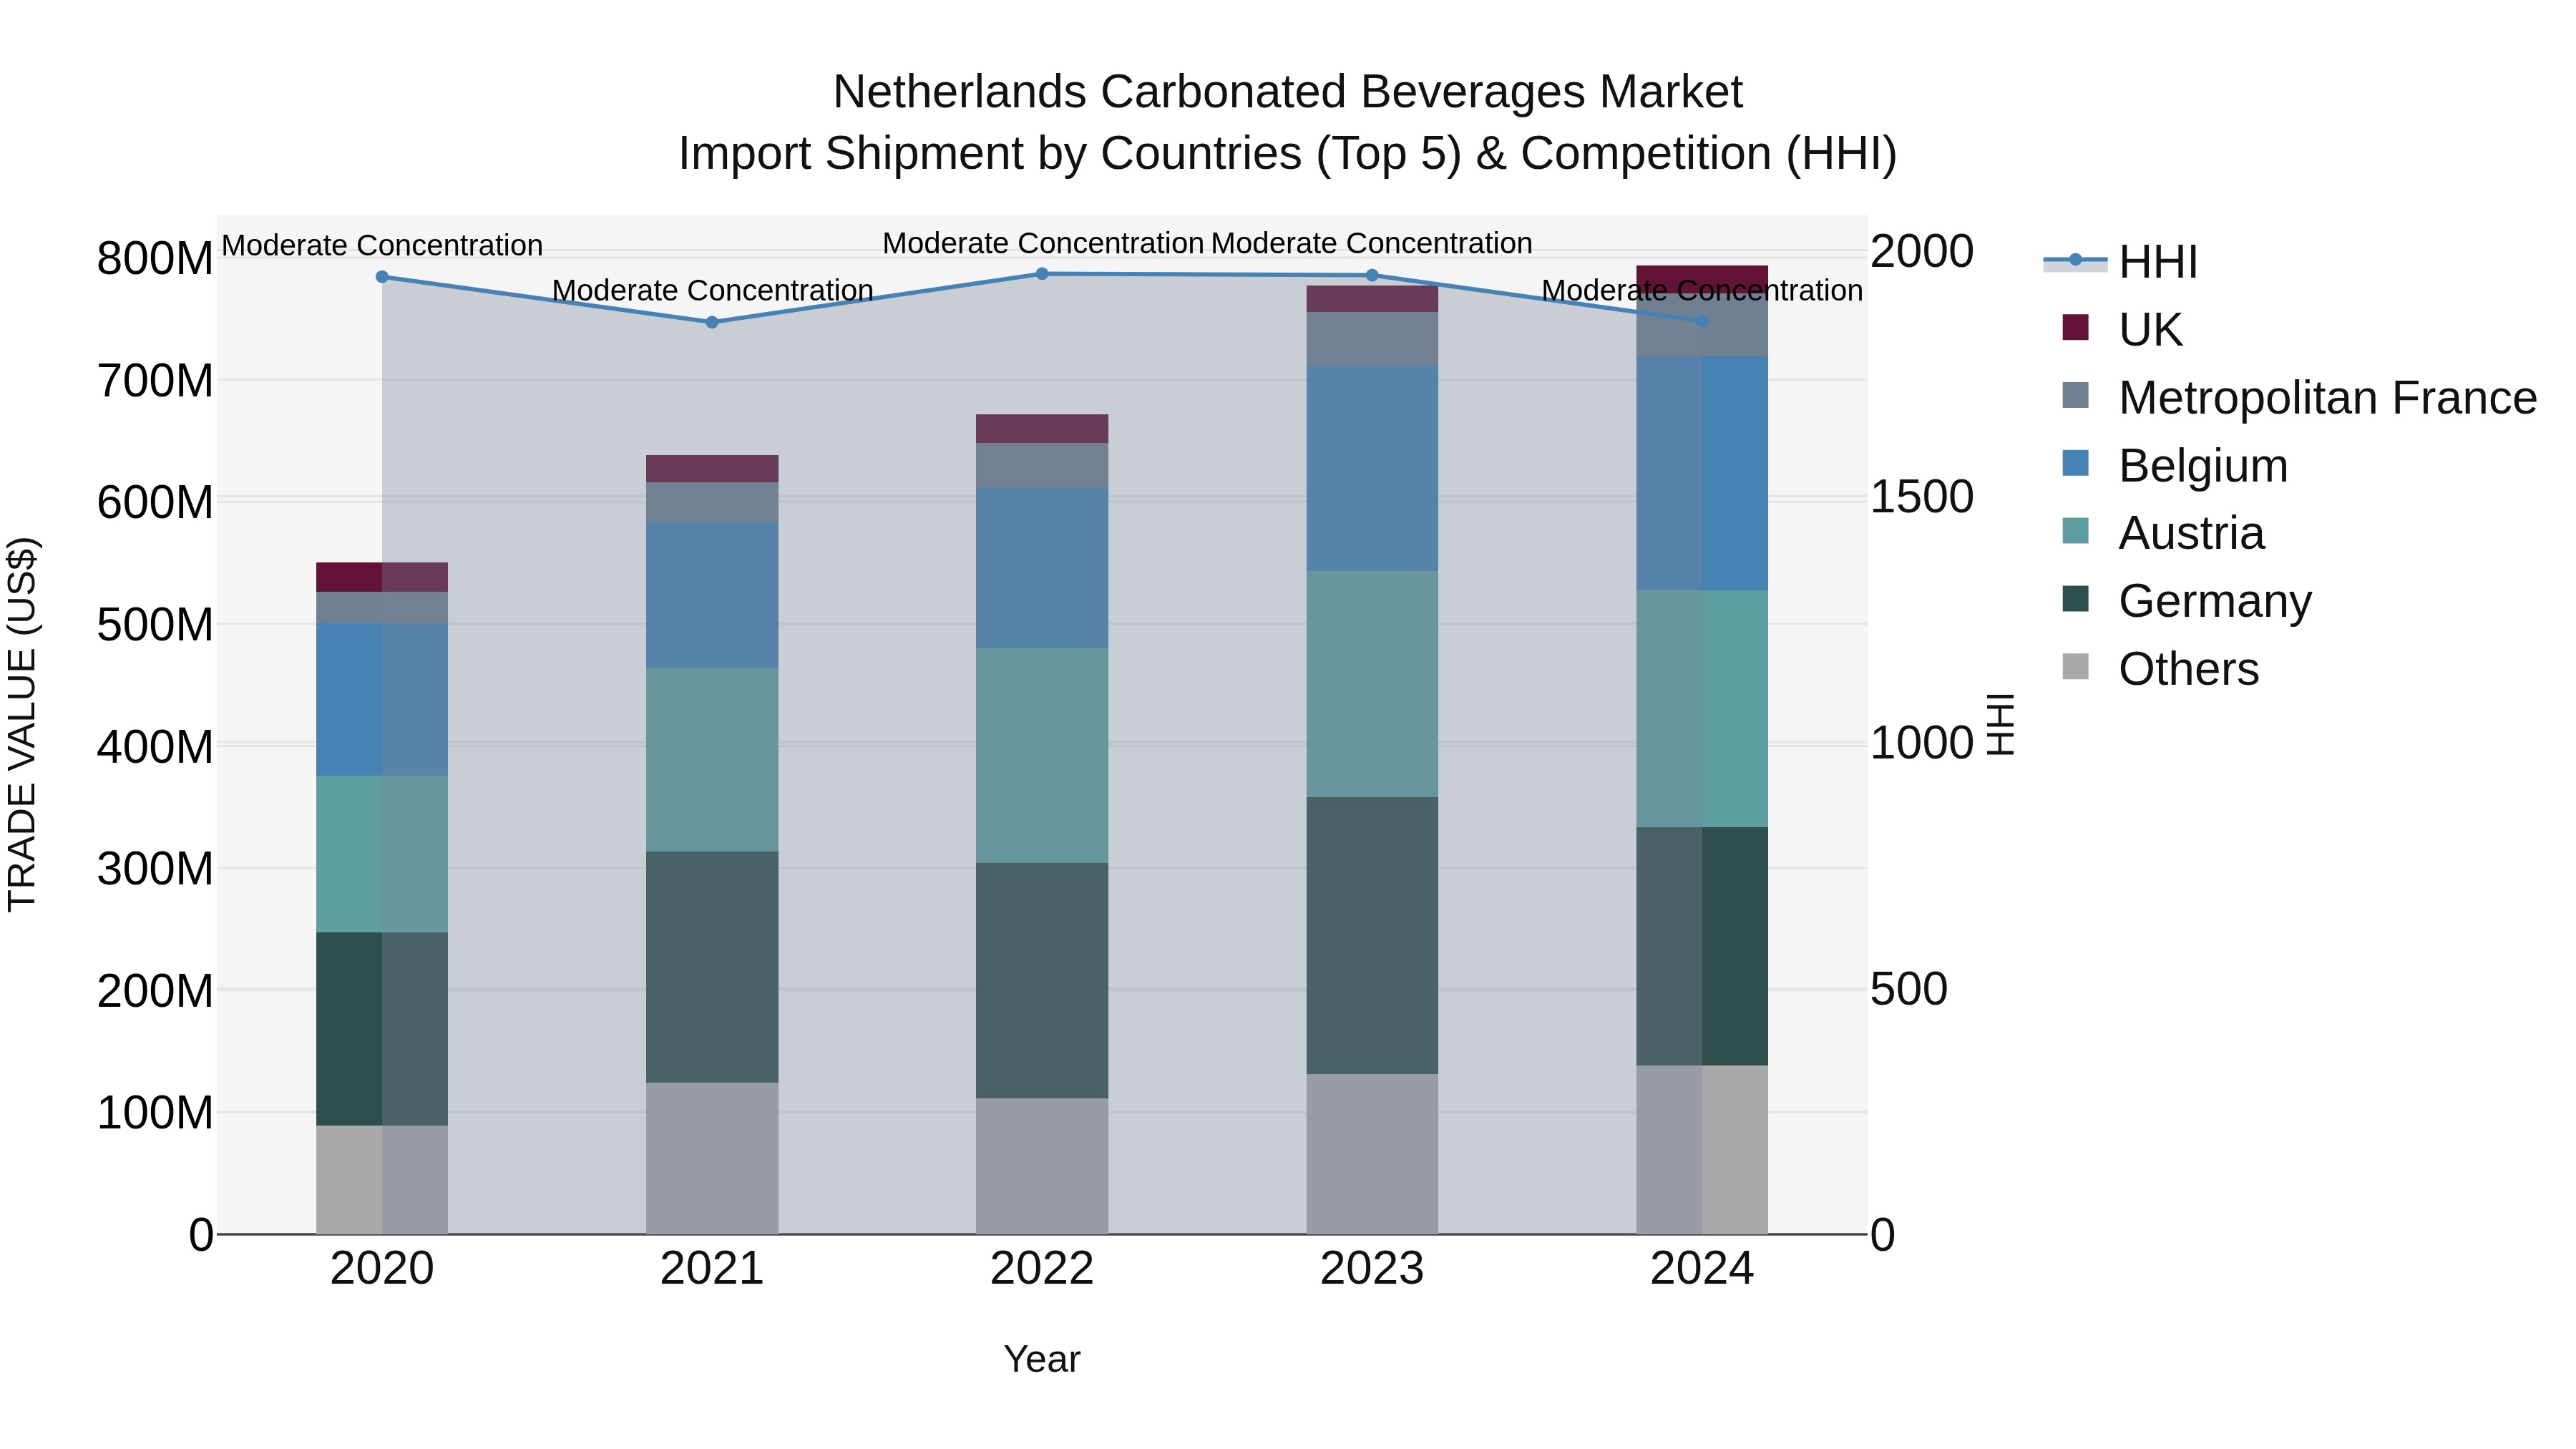
Netherlands Carbonated Beverages Market Top 5 Importing Countries and Market Competition (HHI) Analysis
The Netherlands saw steady growth in carbonated beverages import shipments in 2024, with top exporting countries including Germany, Austria, Belgium, Metropolitan France, and the UK. Despite moderate concentration measured by HHI, the industry maintained a strong CAGR of 9.59% from 2020 to 2024. The growth rate in 2024 remained positive at 2.08%, indicating a resilient market for carbonated beverages in the Netherlands. This data suggests continued demand and opportunities for both domestic consumption and international trade in the carbonated beverages sector.
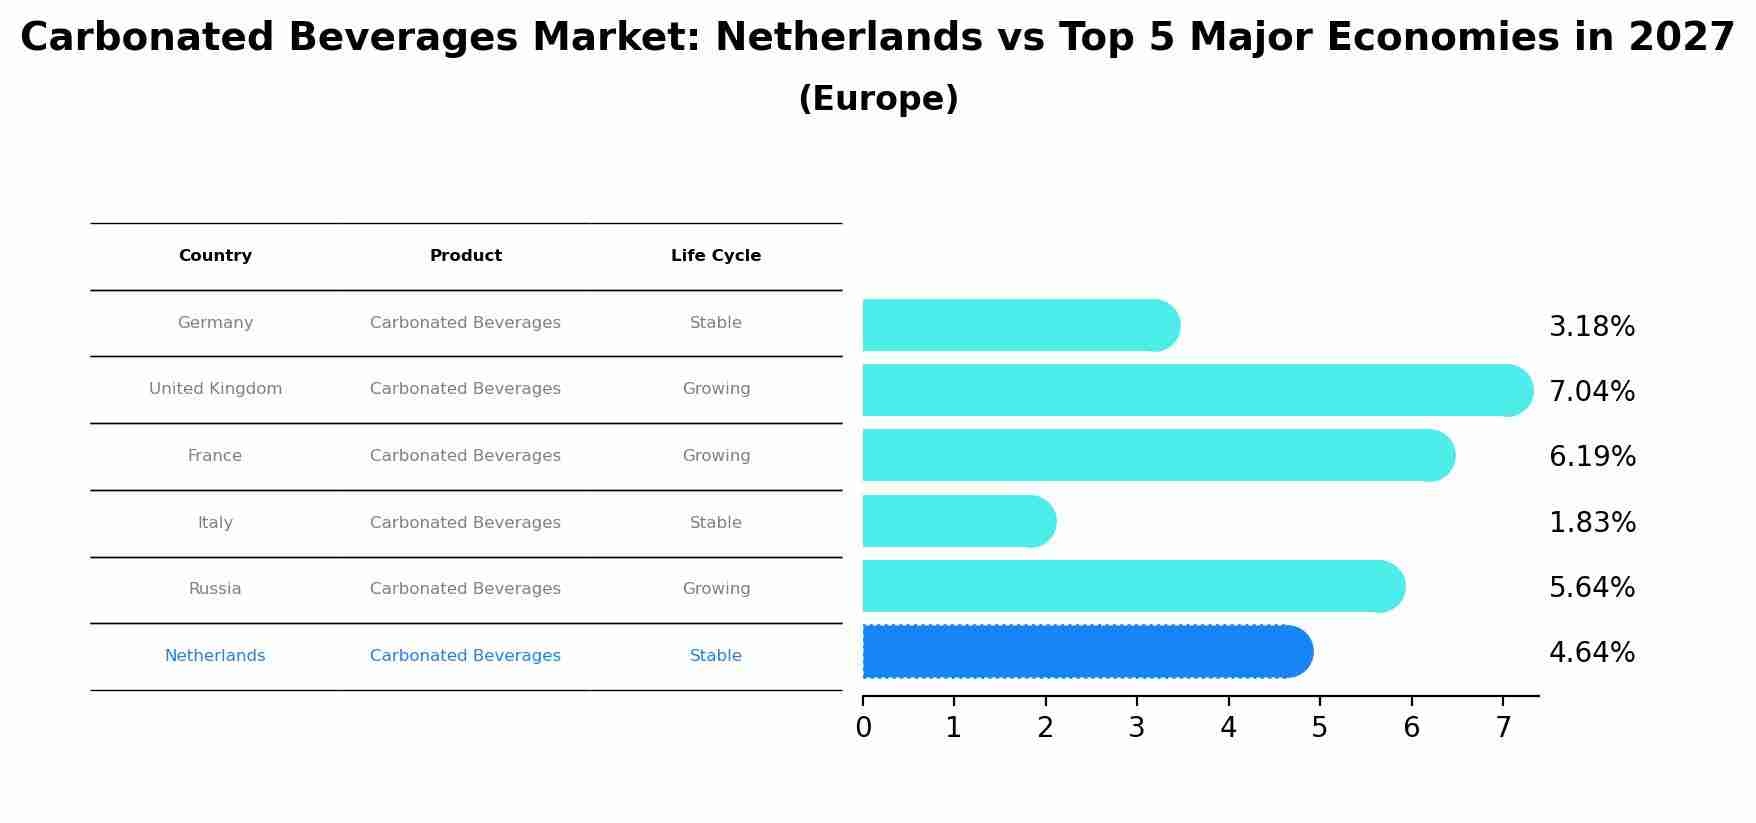
Carbonated Beverages Market: Netherlands vs Top 5 Major Economies in 2027 (Europe)
The Carbonated Beverages market in Netherlands is projected to grow at a stable growth rate of 4.64% by 2027, highlighting the country's increasing focus on advanced technologies within the Europe region, where Germany holds the dominant position, followed closely by United Kingdom, France, Italy and Russia, shaping overall regional demand.
Key Highlights of the Report:
- Netherlands Carbonated Beverages Market Outlook
- Market Size of Netherlands Carbonated Beverages Market, 2025
- Forecast of Netherlands Carbonated Beverages Market, 2032
- Historical Data and Forecast of Netherlands Carbonated Beverages Revenues & Volume for the Period 2022 - 2032F
- Netherlands Carbonated Beverages Market Trend Evolution
- Netherlands Carbonated Beverages Market Drivers and Challenges
- Netherlands Carbonated Beverages Price Trends
- Netherlands Carbonated Beverages Porter`s Five Forces
- Netherlands Carbonated Beverages Industry Life Cycle
- Historical Data and Forecast of Netherlands Carbonated Beverages Market Revenues & Volume By Product Types for the Period 2022 - 2032F
- Historical Data and Forecast of Netherlands Carbonated Beverages Market Revenues & Volume By Soft Drinks for the Period 2022 - 2032F
- Historical Data and Forecast of Netherlands Carbonated Beverages Market Revenues & Volume By Carbonated Water for the Period 2022 - 2032F
- Historical Data and Forecast of Netherlands Carbonated Beverages Market Revenues & Volume By Sports & Energy Drinks for the Period 2022 - 2032F
- Historical Data and Forecast of Netherlands Carbonated Beverages Market Revenues & Volume By Others for the Period 2022 - 2032F
- Historical Data and Forecast of Netherlands Carbonated Beverages Market Revenues & Volume By Flavour for the Period 2022 - 2032F
- Historical Data and Forecast of Netherlands Carbonated Beverages Market Revenues & Volume By Cola for the Period 2022 - 2032F
- Historical Data and Forecast of Netherlands Carbonated Beverages Market Revenues & Volume By Fruit Based for the Period 2022 - 2032F
- Historical Data and Forecast of Netherlands Carbonated Beverages Market Revenues & Volume By Others for the Period 2022 - 2032F
- Historical Data and Forecast of Netherlands Carbonated Beverages Market Revenues & Volume By Distribution Channel for the Period 2022 - 2032F
- Historical Data and Forecast of Netherlands Carbonated Beverages Market Revenues & Volume By Hypermarkets & Supermarkets for the Period 2022 - 2032F
- Historical Data and Forecast of Netherlands Carbonated Beverages Market Revenues & Volume By Convenience Stores for the Period 2022 - 2032F
- Historical Data and Forecast of Netherlands Carbonated Beverages Market Revenues & Volume By Food Service Outlets for the Period 2022 - 2032F
- Historical Data and Forecast of Netherlands Carbonated Beverages Market Revenues & Volume By Transport Terminals for the Period 2022 - 2032F
- Historical Data and Forecast of Netherlands Carbonated Beverages Market Revenues & Volume By Online Stores & D2C for the Period 2022 - 2032F
- Netherlands Carbonated Beverages Import Export Trade Statistics
- Market Opportunity Assessment By Product Types
- Market Opportunity Assessment By Flavour
- Market Opportunity Assessment By Distribution Channel
- Netherlands Carbonated Beverages Top Companies Market Share
- Netherlands Carbonated Beverages Competitive Benchmarking By Technical and Operational Parameters
- Netherlands Carbonated Beverages Company Profiles
- Netherlands Carbonated Beverages Key Strategic Recommendations
Frequently Asked Questions About the Market Study (FAQs):
6Wresearch actively monitors the Netherlands Carbonated Beverages Market and publishes its comprehensive annual report, highlighting emerging trends, growth drivers, revenue analysis, and forecast outlook. Our insights help businesses to make data-backed strategic decisions with ongoing market dynamics. Our analysts track relevent industries related to the Netherlands Carbonated Beverages Market, allowing our clients with actionable intelligence and reliable forecasts tailored to emerging regional needs.
Yes, we provide customisation as per your requirements. To learn more, feel free to contact us on sales@6wresearch.com
1 Executive Summary |
2 Introduction |
2.1 Key Highlights of the Report |
2.2 Report Description |
2.3 Market Scope & Segmentation |
2.4 Research Methodology |
2.5 Assumptions |
3 Netherlands Carbonated Beverages Market Overview |
3.1 Netherlands Country Macro Economic Indicators |
3.2 Netherlands Carbonated Beverages Market Revenues & Volume, 2022 & 2032F |
3.3 Netherlands Carbonated Beverages Market - Industry Life Cycle |
3.4 Netherlands Carbonated Beverages Market - Porter's Five Forces |
3.5 Netherlands Carbonated Beverages Market Revenues & Volume Share, By Product Types, 2022 & 2032F |
3.6 Netherlands Carbonated Beverages Market Revenues & Volume Share, By Flavour, 2022 & 2032F |
3.7 Netherlands Carbonated Beverages Market Revenues & Volume Share, By Distribution Channel, 2022 & 2032F |
4 Netherlands Carbonated Beverages Market Dynamics |
4.1 Impact Analysis |
4.2 Market Drivers |
4.2.1 Changing consumer preferences towards healthier and natural alternatives |
4.2.2 Innovation in flavors and packaging of carbonated beverages |
4.2.3 Growing popularity of premium and craft carbonated beverages |
4.3 Market Restraints |
4.3.1 Increasing health concerns related to sugar content and artificial ingredients in carbonated beverages |
4.3.2 Government regulations and taxes on sugary drinks |
4.3.3 Competition from other beverage categories such as bottled water and functional drinks |
5 Netherlands Carbonated Beverages Market Trends |
6 Netherlands Carbonated Beverages Market Segmentations |
6.1 Netherlands Carbonated Beverages Market, By Product Types |
6.1.1 Overview and Analysis |
6.1.2 Netherlands Carbonated Beverages Market Revenues & Volume, By Soft Drinks, 2022 - 2032F |
6.1.3 Netherlands Carbonated Beverages Market Revenues & Volume, By Carbonated Water, 2022 - 2032F |
6.1.4 Netherlands Carbonated Beverages Market Revenues & Volume, By Sports & Energy Drinks, 2022 - 2032F |
6.1.5 Netherlands Carbonated Beverages Market Revenues & Volume, By Others, 2022 - 2032F |
6.2 Netherlands Carbonated Beverages Market, By Flavour |
6.2.1 Overview and Analysis |
6.2.2 Netherlands Carbonated Beverages Market Revenues & Volume, By Cola, 2022 - 2032F |
6.2.3 Netherlands Carbonated Beverages Market Revenues & Volume, By Fruit Based, 2022 - 2032F |
6.2.4 Netherlands Carbonated Beverages Market Revenues & Volume, By Others, 2022 - 2032F |
6.3 Netherlands Carbonated Beverages Market, By Distribution Channel |
6.3.1 Overview and Analysis |
6.3.2 Netherlands Carbonated Beverages Market Revenues & Volume, By Hypermarkets & Supermarkets, 2022 - 2032F |
6.3.3 Netherlands Carbonated Beverages Market Revenues & Volume, By Convenience Stores, 2022 - 2032F |
6.3.4 Netherlands Carbonated Beverages Market Revenues & Volume, By Food Service Outlets, 2022 - 2032F |
6.3.5 Netherlands Carbonated Beverages Market Revenues & Volume, By Transport Terminals, 2022 - 2032F |
6.3.6 Netherlands Carbonated Beverages Market Revenues & Volume, By Online Stores & D2C, 2022 - 2032F |
7 Netherlands Carbonated Beverages Market Import-Export Trade Statistics |
7.1 Netherlands Carbonated Beverages Market Export to Major Countries |
7.2 Netherlands Carbonated Beverages Market Imports from Major Countries |
8 Netherlands Carbonated Beverages Market Key Performance Indicators |
8.1 Consumer demand for low-sugar or sugar-free carbonated beverages |
8.2 Adoption rate of eco-friendly packaging solutions in the carbonated beverages market |
8.3 Market penetration of premium and craft carbonated beverages |
8.4 Consumer awareness and perception of health risks associated with traditional carbonated beverages |
8.5 Growth in sales of carbonated beverages positioned as a treat or indulgence rather than a daily consumption option |
9 Netherlands Carbonated Beverages Market - Opportunity Assessment |
9.1 Netherlands Carbonated Beverages Market Opportunity Assessment, By Product Types, 2022 & 2032F |
9.2 Netherlands Carbonated Beverages Market Opportunity Assessment, By Flavour, 2022 & 2032F |
9.3 Netherlands Carbonated Beverages Market Opportunity Assessment, By Distribution Channel, 2022 & 2032F |
10 Netherlands Carbonated Beverages Market - Competitive Landscape |
10.1 Netherlands Carbonated Beverages Market Revenue Share, By Companies, 2025 |
10.2 Netherlands Carbonated Beverages Market Competitive Benchmarking, By Operating and Technical Parameters |
11 Company Profiles |
12 Recommendations | 13 Disclaimer |
Export potential assessment - trade Analytics for 2030
Export potential enables firms to identify high-growth global markets with greater confidence by combining advanced trade intelligence with a structured quantitative methodology. The framework analyzes emerging demand trends and country-level import patterns while integrating macroeconomic and trade datasets such as GDP and population forecasts, bilateral import–export flows, tariff structures, elasticity differentials between developed and developing economies, geographic distance, and import demand projections. Using weighted trade values from 2020–2024 as the base period to project country-to-country export potential for 2030, these inputs are operationalized through calculated drivers such as gravity model parameters, tariff impact factors, and projected GDP per-capita growth. Through an analysis of hidden potentials, demand hotspots, and market conditions that are most favorable to success, this method enables firms to focus on target countries, maximize returns, and global expansion with data, backed by accuracy.
By factoring in the projected importer demand gap that is currently unmet and could be potential opportunity, it identifies the potential for the Exporter (Country) among 190 countries, against the general trade analysis, which identifies the biggest importer or exporter.
To discover high-growth global markets and optimize your business strategy:
Click Here
Pricing
- Single User License$ 1,995
- Department License$ 2,400
- Site License$ 3,120
- Global License$ 3,795

Search
Thought Leadership and Analyst Meet


Our Clients
Latest Reports
- Philippines Polyhydroxybutyrate-co-Hydroxyvalerate Market (2026-2032) | Trends, Insights, Challenges, Restraints, Competition, Size, Value, Forecast, Pricing, Share, Outlook, Revenue, Investment Opportunities, Strategy, Drivers, Demand, Growth, segmentation, Analysis, Companies
- Peru Polyhydroxybutyrate-co-Hydroxyvalerate Market (2026-2032) | Growth, Demand, Challenges, Share, Trends, Analysis, Pricing, Investment Opportunities, Drivers, Value, Forecast, Competition, Size, Companies, Insights, Outlook, Restraints, segmentation, Revenue, Strategy
- Pakistan Polyhydroxybutyrate-co-Hydroxyvalerate Market (2026-2032) | Restraints, segmentation, Pricing, Forecast, Share, Strategy, Competition, Trends, Insights, Drivers, Challenges, Growth, Revenue, Outlook, Value, Investment Opportunities, Companies, Size, Analysis, Demand
- Oman Polyhydroxybutyrate-co-Hydroxyvalerate Market (2026-2032) | Drivers, segmentation, Insights, Competition, Pricing, Outlook, Size, Revenue, Challenges, Forecast, Analysis, Growth, Value, Share, Trends, Investment Opportunities, Strategy, Restraints, Companies, Demand
- Nigeria Polyhydroxybutyrate-co-Hydroxyvalerate Market (2026-2032) | Value, Investment Opportunities, Analysis, Revenue, Restraints, Pricing, Outlook, Competition, Demand, Growth, Forecast, Companies, Trends, Challenges, segmentation, Drivers, Insights, Share, Size, Strategy
- Nepal Polyhydroxybutyrate-co-Hydroxyvalerate Market (2026-2032) | Insights, Analysis, Drivers, Share, Revenue, Demand, segmentation, Investment Opportunities, Competition, Forecast, Growth, Pricing, Companies, Strategy, Trends, Restraints, Challenges, Outlook, Size, Value
- Myanmar Polyhydroxybutyrate-co-Hydroxyvalerate Market (2026-2032) | Outlook, Revenue, Strategy, Restraints, Drivers, segmentation, Share, Forecast, Competition, Insights, Growth, Pricing, Size, Demand, Value, Companies, Trends, Challenges, Investment Opportunities, Analysis
- Morocco Polyhydroxybutyrate-co-Hydroxyvalerate Market (2026-2032) | Outlook, Investment Opportunities, Restraints, Strategy, Forecast, Challenges, Drivers, Growth, Companies, segmentation, Trends, Size, Competition, Revenue, Demand, Insights, Share, Analysis, Value, Pricing
- Mexico Polyhydroxybutyrate-co-Hydroxyvalerate Market (2026-2032) | Size, Drivers, Outlook, Share, Strategy, Growth, Pricing, Challenges, Companies, Demand, Value, Investment Opportunities, Restraints, Trends, Forecast, segmentation, Analysis, Insights, Competition, Revenue
- Malaysia Polyhydroxybutyrate-co-Hydroxyvalerate Market (2026-2032) | Share, segmentation, Size, Companies, Analysis, Insights, Forecast, Value, Revenue, Drivers, Restraints, Challenges, Investment Opportunities, Trends, Competition, Strategy, Demand, Growth, Outlook, Pricing
Industry Events and Analyst Meet

HIMTEX 2026

India Refining Summit 2026

India EV Show 2026

EV tech India Expo 2026

Auto Tech Asia 2026
Whitepaper
- Middle East & Africa Commercial Security Market Click here to view more.
- Middle East & Africa Fire Safety Systems & Equipment Market Click here to view more.
- GCC Drone Market Click here to view more.
- Middle East Lighting Fixture Market Click here to view more.
- GCC Physical & Perimeter Security Market Click here to view more.
6WResearch In News
- Doha a strategic location for EV manufacturing hub: IPA Qatar
- Demand for luxury TVs surging in the GCC, says Samsung
- Empowering Growth: The Thriving Journey of Bangladesh’s Cable Industry
- Demand for luxury TVs surging in the GCC, says Samsung
- Video call with a traditional healer? Once unthinkable, it’s now common in South Africa
- Intelligent Buildings To Smooth GCC’s Path To Net Zero