Netherlands Motorcycle Drive Chain Market (2025-2031) | Growth, Share, Value, Companies, Competitive Landscape, Outlook, Segmentation, Industry, Forecast, Trends, Analysis, Size & Revenue
Market Forecast By Types (Standard, Cruiser, Sports, Off-Road), By Chain type (Standard Rolling Chain, O Ring Chain, X Ring Chain), By Engine Capacity (Up to 150 CC, 151-300 CC, 301-500 CC, Above 500 CC), By Material Type (Mild Steel, Cast Steel, Cast Iron), By Distribution Channel (Online, Offline) And Competitive Landscape
| Product Code: ETC8543286 | Publication Date: Sep 2024 | Updated Date: Apr 2026 | Product Type: Market Research Report | |
| Publisher: 6Wresearch | Author: Dhaval Chaurasia | No. of Pages: 75 | No. of Figures: 35 | No. of Tables: 20 |
Netherlands Motorcycle Drive Chain Market Size (2020-2030)
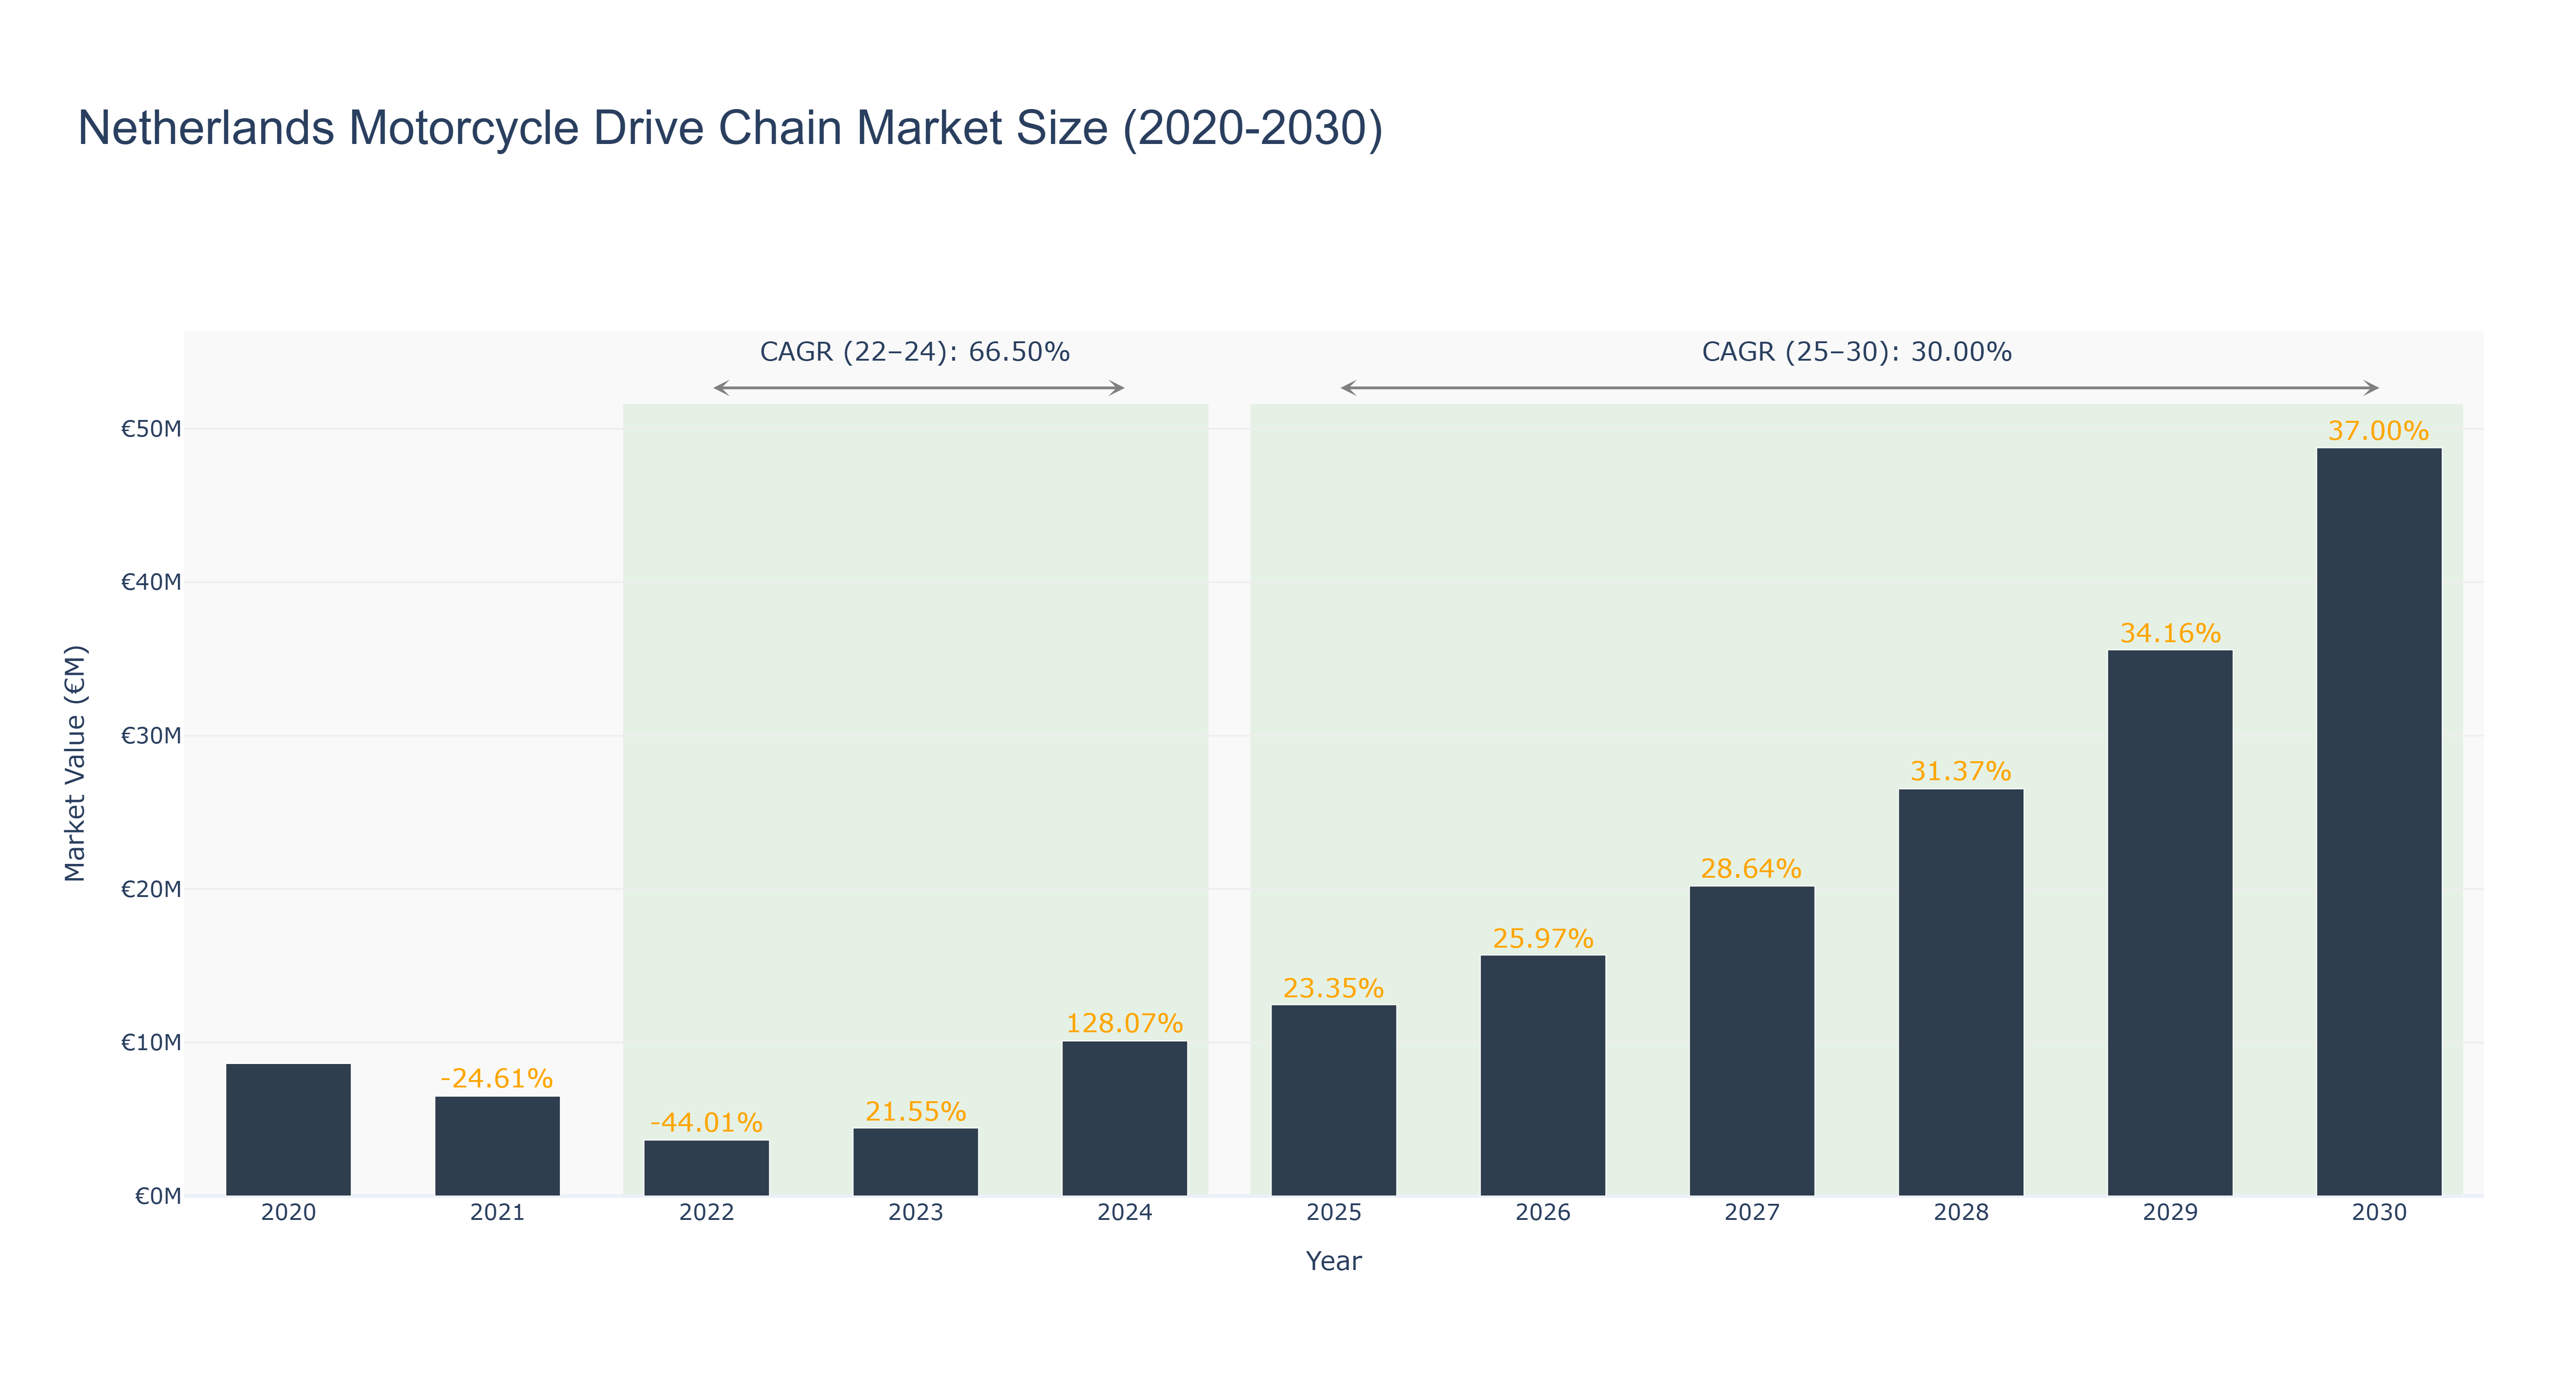
The Netherlands Motorcycle Drive Chain Market experienced significant fluctuations in recent years, peaking at €8.63 million in 2020 before declining sharply to €3.64 million in 2022, reflecting a notable decrease of 44.01%. However, the market rebounded in 2023, reaching €4.43 million, and is projected to grow substantially, with an estimated market size of €10.10 million in 2024. The actual Compound Annual Growth Rate (CAGR) for the period 2022-2024 stands at an impressive 66.50%. Looking forward, the market is expected to maintain a robust trajectory, with the forecasted CAGR from 2025 to 2030 estimated at 30.00%. This growth can be attributed to the increasing popularity of motorcycles for both recreational and commuting purposes, alongside advancements in drive chain technology. As consumer preferences shift towards sustainable and efficient transportation options, the market is poised for continued expansion, driven by ongoing innovations and potential investments in infrastructure and product development.
Netherlands Motorcycle Drive Chain Market: Production & Trade Performance (2019-2025)
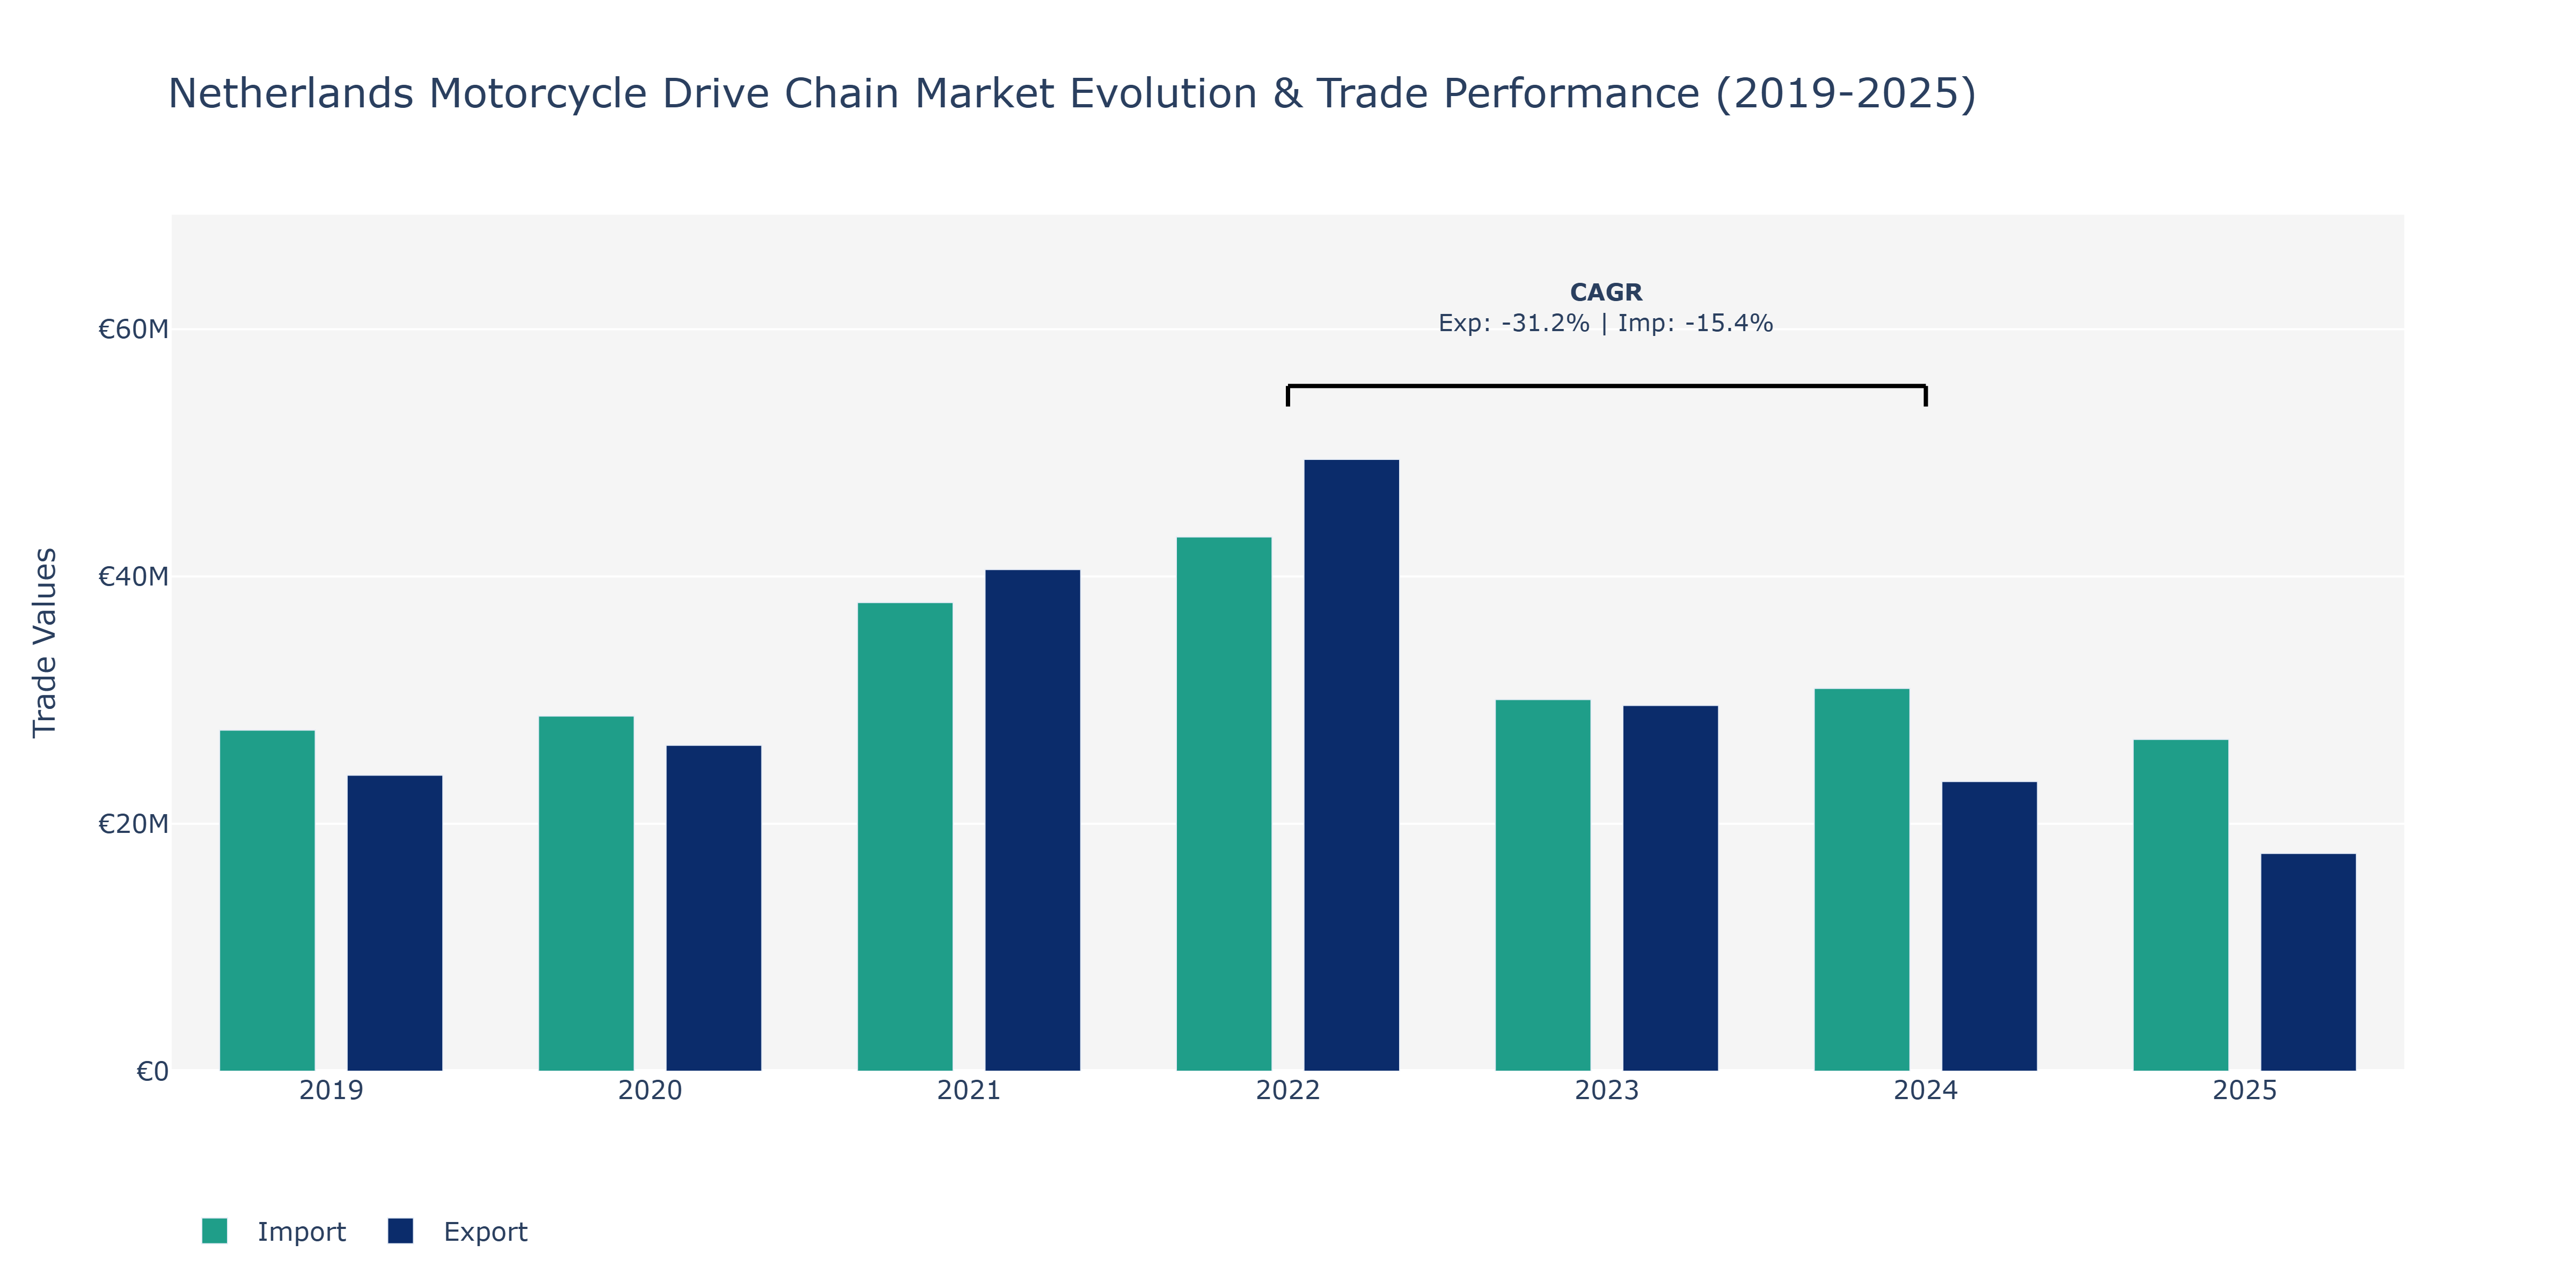
Between 2019 and 2025, the Netherlands Motorcycle Drive Chain Market saw varying trends in exports and imports. In 2021, there was a substantial surge in exports to €40.57 million, likely driven by increased demand for motorcycles and related components. However, by 2025, exports dropped to €17.61 million, possibly due to shifts in consumer preferences or global economic factors. Imports followed a similar trajectory, reaching €43.21 million in 2022, the highest point during the period, before decreasing to €26.84 million in 2025. This decline could be attributed to changes in supply chain dynamics or trade regulations affecting import patterns. Despite a notable decrease in exports and imports from 2022 to 2024, the market demonstrated resilience, potentially indicating strategic adjustments by key players to navigate challenges posed by market conditions. The negative CAGRs during these years reflect the market's adaptability to evolving circumstances, highlighting the need for continuous innovation and competitiveness within the sector to sustain growth.
Key Highlights of the Report:
- Netherlands Motorcycle Drive Chain Market Outlook
- Market Size of Netherlands Motorcycle Drive Chain Market, 2024
- Forecast of Netherlands Motorcycle Drive Chain Market, 2031
- Historical Data and Forecast of Netherlands Motorcycle Drive Chain Revenues & Volume for the Period 2021- 2031
- Netherlands Motorcycle Drive Chain Market Trend Evolution
- Netherlands Motorcycle Drive Chain Market Drivers and Challenges
- Netherlands Motorcycle Drive Chain Price Trends
- Netherlands Motorcycle Drive Chain Porter's Five Forces
- Netherlands Motorcycle Drive Chain Industry Life Cycle
- Historical Data and Forecast of Netherlands Motorcycle Drive Chain Market Revenues & Volume By Types for the Period 2021- 2031
- Historical Data and Forecast of Netherlands Motorcycle Drive Chain Market Revenues & Volume By Standard for the Period 2021- 2031
- Historical Data and Forecast of Netherlands Motorcycle Drive Chain Market Revenues & Volume By Cruiser for the Period 2021- 2031
- Historical Data and Forecast of Netherlands Motorcycle Drive Chain Market Revenues & Volume By Sports for the Period 2021- 2031
- Historical Data and Forecast of Netherlands Motorcycle Drive Chain Market Revenues & Volume By Off-Road for the Period 2021- 2031
- Historical Data and Forecast of Netherlands Motorcycle Drive Chain Market Revenues & Volume By Chain type for the Period 2021- 2031
- Historical Data and Forecast of Netherlands Motorcycle Drive Chain Market Revenues & Volume By Standard Rolling Chain for the Period 2021- 2031
- Historical Data and Forecast of Netherlands Motorcycle Drive Chain Market Revenues & Volume By O Ring Chain for the Period 2021- 2031
- Historical Data and Forecast of Netherlands Motorcycle Drive Chain Market Revenues & Volume By X Ring Chain for the Period 2021- 2031
- Historical Data and Forecast of Netherlands Motorcycle Drive Chain Market Revenues & Volume By Engine Capacity for the Period 2021- 2031
- Historical Data and Forecast of Netherlands Motorcycle Drive Chain Market Revenues & Volume By Up to 150 CC for the Period 2021- 2031
- Historical Data and Forecast of Netherlands Motorcycle Drive Chain Market Revenues & Volume By 151-300 CC for the Period 2021- 2031
- Historical Data and Forecast of Netherlands Motorcycle Drive Chain Market Revenues & Volume By 301-500 CC for the Period 2021- 2031
- Historical Data and Forecast of Netherlands Motorcycle Drive Chain Market Revenues & Volume By Above 500 CC for the Period 2021- 2031
- Historical Data and Forecast of Netherlands Motorcycle Drive Chain Market Revenues & Volume By Material Type for the Period 2021- 2031
- Historical Data and Forecast of Netherlands Motorcycle Drive Chain Market Revenues & Volume By Mild Steel for the Period 2021- 2031
- Historical Data and Forecast of Netherlands Motorcycle Drive Chain Market Revenues & Volume By Cast Steel for the Period 2021- 2031
- Historical Data and Forecast of Netherlands Motorcycle Drive Chain Market Revenues & Volume By Cast Iron for the Period 2021- 2031
- Historical Data and Forecast of Netherlands Motorcycle Drive Chain Market Revenues & Volume By Distribution Channel for the Period 2021- 2031
- Historical Data and Forecast of Netherlands Motorcycle Drive Chain Market Revenues & Volume By Online for the Period 2021- 2031
- Historical Data and Forecast of Netherlands Motorcycle Drive Chain Market Revenues & Volume By Offline for the Period 2021- 2031
- Netherlands Motorcycle Drive Chain Import Export Trade Statistics
- Market Opportunity Assessment By Types
- Market Opportunity Assessment By Chain type
- Market Opportunity Assessment By Engine Capacity
- Market Opportunity Assessment By Material Type
- Market Opportunity Assessment By Distribution Channel
- Netherlands Motorcycle Drive Chain Top Companies Market Share
- Netherlands Motorcycle Drive Chain Competitive Benchmarking By Technical and Operational Parameters
- Netherlands Motorcycle Drive Chain Company Profiles
- Netherlands Motorcycle Drive Chain Key Strategic Recommendations
Frequently Asked Questions About the Market Study (FAQs):
6Wresearch actively monitors the Netherlands Motorcycle Drive Chain Market and publishes its comprehensive annual report, highlighting emerging trends, growth drivers, revenue analysis, and forecast outlook. Our insights help businesses to make data-backed strategic decisions with ongoing market dynamics. Our analysts track relevent industries related to the Netherlands Motorcycle Drive Chain Market, allowing our clients with actionable intelligence and reliable forecasts tailored to emerging regional needs.
Yes, we provide customisation as per your requirements. To learn more, feel free to contact us on sales@6wresearch.com
1 Executive Summary |
2 Introduction |
2.1 Key Highlights of the Report |
2.2 Report Description |
2.3 Market Scope & Segmentation |
2.4 Research Methodology |
2.5 Assumptions |
3 Netherlands Motorcycle Drive Chain Market Overview |
3.1 Netherlands Country Macro Economic Indicators |
3.2 Netherlands Motorcycle Drive Chain Market Revenues & Volume, 2021 & 2031F |
3.3 Netherlands Motorcycle Drive Chain Market - Industry Life Cycle |
3.4 Netherlands Motorcycle Drive Chain Market - Porter's Five Forces |
3.5 Netherlands Motorcycle Drive Chain Market Revenues & Volume Share, By Types, 2021 & 2031F |
3.6 Netherlands Motorcycle Drive Chain Market Revenues & Volume Share, By Chain type, 2021 & 2031F |
3.7 Netherlands Motorcycle Drive Chain Market Revenues & Volume Share, By Engine Capacity, 2021 & 2031F |
3.8 Netherlands Motorcycle Drive Chain Market Revenues & Volume Share, By Material Type, 2021 & 2031F |
3.9 Netherlands Motorcycle Drive Chain Market Revenues & Volume Share, By Distribution Channel, 2021 & 2031F |
4 Netherlands Motorcycle Drive Chain Market Dynamics |
4.1 Impact Analysis |
4.2 Market Drivers |
4.2.1 Increasing demand for motorcycles in the Netherlands |
4.2.2 Growing popularity of motorcycle sports and recreational activities |
4.2.3 Technological advancements in drive chain materials and designs |
4.3 Market Restraints |
4.3.1 High initial cost of purchasing motorcycles and drive chains |
4.3.2 Competition from alternative modes of transportation |
4.3.3 Environmental concerns leading to a shift towards electric motorcycles |
5 Netherlands Motorcycle Drive Chain Market Trends |
6 Netherlands Motorcycle Drive Chain Market, By Types |
6.1 Netherlands Motorcycle Drive Chain Market, By Types |
6.1.1 Overview and Analysis |
6.1.2 Netherlands Motorcycle Drive Chain Market Revenues & Volume, By Types, 2021- 2031F |
6.1.3 Netherlands Motorcycle Drive Chain Market Revenues & Volume, By Standard, 2021- 2031F |
6.1.4 Netherlands Motorcycle Drive Chain Market Revenues & Volume, By Cruiser, 2021- 2031F |
6.1.5 Netherlands Motorcycle Drive Chain Market Revenues & Volume, By Sports, 2021- 2031F |
6.1.6 Netherlands Motorcycle Drive Chain Market Revenues & Volume, By Off-Road, 2021- 2031F |
6.2 Netherlands Motorcycle Drive Chain Market, By Chain type |
6.2.1 Overview and Analysis |
6.2.2 Netherlands Motorcycle Drive Chain Market Revenues & Volume, By Standard Rolling Chain, 2021- 2031F |
6.2.3 Netherlands Motorcycle Drive Chain Market Revenues & Volume, By O Ring Chain, 2021- 2031F |
6.2.4 Netherlands Motorcycle Drive Chain Market Revenues & Volume, By X Ring Chain, 2021- 2031F |
6.3 Netherlands Motorcycle Drive Chain Market, By Engine Capacity |
6.3.1 Overview and Analysis |
6.3.2 Netherlands Motorcycle Drive Chain Market Revenues & Volume, By Up to 150 CC, 2021- 2031F |
6.3.3 Netherlands Motorcycle Drive Chain Market Revenues & Volume, By 151-300 CC, 2021- 2031F |
6.3.4 Netherlands Motorcycle Drive Chain Market Revenues & Volume, By 301-500 CC, 2021- 2031F |
6.3.5 Netherlands Motorcycle Drive Chain Market Revenues & Volume, By Above 500 CC, 2021- 2031F |
6.4 Netherlands Motorcycle Drive Chain Market, By Material Type |
6.4.1 Overview and Analysis |
6.4.2 Netherlands Motorcycle Drive Chain Market Revenues & Volume, By Mild Steel, 2021- 2031F |
6.4.3 Netherlands Motorcycle Drive Chain Market Revenues & Volume, By Cast Steel, 2021- 2031F |
6.4.4 Netherlands Motorcycle Drive Chain Market Revenues & Volume, By Cast Iron, 2021- 2031F |
6.5 Netherlands Motorcycle Drive Chain Market, By Distribution Channel |
6.5.1 Overview and Analysis |
6.5.2 Netherlands Motorcycle Drive Chain Market Revenues & Volume, By Online, 2021- 2031F |
6.5.3 Netherlands Motorcycle Drive Chain Market Revenues & Volume, By Offline, 2021- 2031F |
7 Netherlands Motorcycle Drive Chain Market Import-Export Trade Statistics |
7.1 Netherlands Motorcycle Drive Chain Market Export to Major Countries |
7.2 Netherlands Motorcycle Drive Chain Market Imports from Major Countries |
8 Netherlands Motorcycle Drive Chain Market Key Performance Indicators |
8.1 Average age of motorcycles in use |
8.2 Number of motorcycle events and races organized |
8.3 Adoption rate of new drive chain technologies |
8.4 Frequency of drive chain maintenance and replacements |
8.5 Percentage of motorcycles using traditional vs electric drive chains |
9 Netherlands Motorcycle Drive Chain Market - Opportunity Assessment |
9.1 Netherlands Motorcycle Drive Chain Market Opportunity Assessment, By Types, 2021 & 2031F |
9.2 Netherlands Motorcycle Drive Chain Market Opportunity Assessment, By Chain type, 2021 & 2031F |
9.3 Netherlands Motorcycle Drive Chain Market Opportunity Assessment, By Engine Capacity, 2021 & 2031F |
9.4 Netherlands Motorcycle Drive Chain Market Opportunity Assessment, By Material Type, 2021 & 2031F |
9.5 Netherlands Motorcycle Drive Chain Market Opportunity Assessment, By Distribution Channel, 2021 & 2031F |
10 Netherlands Motorcycle Drive Chain Market - Competitive Landscape |
10.1 Netherlands Motorcycle Drive Chain Market Revenue Share, By Companies, 2024 |
10.2 Netherlands Motorcycle Drive Chain Market Competitive Benchmarking, By Operating and Technical Parameters |
11 Company Profiles |
12 Recommendations |
13 Disclaimer |
Export potential assessment - trade Analytics for 2030
Export potential enables firms to identify high-growth global markets with greater confidence by combining advanced trade intelligence with a structured quantitative methodology. The framework analyzes emerging demand trends and country-level import patterns while integrating macroeconomic and trade datasets such as GDP and population forecasts, bilateral import–export flows, tariff structures, elasticity differentials between developed and developing economies, geographic distance, and import demand projections. Using weighted trade values from 2020–2024 as the base period to project country-to-country export potential for 2030, these inputs are operationalized through calculated drivers such as gravity model parameters, tariff impact factors, and projected GDP per-capita growth. Through an analysis of hidden potentials, demand hotspots, and market conditions that are most favorable to success, this method enables firms to focus on target countries, maximize returns, and global expansion with data, backed by accuracy.
By factoring in the projected importer demand gap that is currently unmet and could be potential opportunity, it identifies the potential for the Exporter (Country) among 190 countries, against the general trade analysis, which identifies the biggest importer or exporter.
To discover high-growth global markets and optimize your business strategy:
Click Here
Pricing
- Single User License$ 1,995
- Department License$ 2,400
- Site License$ 3,120
- Global License$ 3,795

Search
Thought Leadership and Analyst Meet


Our Clients
Latest Reports
- India Ultrasonic Smart Water Meter Market (2026-2032) | Outlook, Competition, Drivers, Trends, Demand, Competitive, Strategic Insights, Companies, Challenges, Strategy, Consumer Insights, Analysis, Opportunities, Growth, Size, Share, Industry, Revenue, Segments, Value, Segmentation, Supply, Forecast, Restraints,
- India Electromagnetic Bulk Flow Meter Market (2026-2032) | Analysis, Challenges, Strategic Insights, Supply, Forecast, Growth, Share, Consumer Insights, Competitive, Value, Outlook, Size & Demand,
- India Battery Powered Bulk Flow Meter Market (2026-2032) | Outlook, Analysis, Competitive Landscape, Growth, Size, Trends, Value, Revenue, Companies, Segmentation, Share & Forecast
- Bosnia and Herzegovina Fuel-Efficient Winglets Market (2026-2032) | Growth, Competition, Strategy, Restraints, Trends, Challenges, segmentation, Value, Outlook, Investment Opportunities, Analysis, Revenue, Companies, Insights, Pricing, Size, Drivers, Demand, Share, Forecast
- Canada Cloud CFD Market (2026-2032) | Size & Revenue, Industry, Growth, Competitive Landscape, Forecast, Segmentation, Value, Outlook, Trends, Share, Analysis, Companies
- Taiwan Food Delivery Platform Market (2026-2032) | Companies, Outlook, Analysis, Trends, Value, Revenue, Segmentation, Share, Forecast, Competitive Landscape, Growth, Size & Forecast
- United Kingdom (UK) Long-term Care Insurance Market (2026-2032) | Growth, Share, Consumer Insights, Drivers, Opportunities, Competition, Pricing Analysis, Segments, Restraints, Companies, Competitive, Value, Outlook, Size, Demand, Analysis, Challenges, Strategic Insights, Investment Trends, Revenue, Trends, Supply, Forecast
- United Kingdom (UK) Long Term Care Market (2026-2032) | Companies, Outlook, Analysis, Trends, Value, Revenue, Segmentation, Share, Forecast, Competitive Landscape, Growth, Size & Forecast
- Iraq Insulation and Waterproofing Market (2026-2032) | Outlook, Drivers, Growth, Size, Share, Industry, Revenue, Trends, Demand, Competitive, Strategic Insights, Opportunities, Segments, Companies, Challenges, Strategy, Consumer Insights, Analysis, Investment Trends, Value, Segmentation, Forecast, Restraints
- India Switchgear Market Outlook (2026-2032) | Size, Share, Trends, Growth, Revenue, Forecast, Analysis, Value, Outlook
Industry Events and Analyst Meet

India EV Show 2026

EV tech India Expo 2026

Auto Tech Asia 2026

Battery Tech India 2026

Smart Production Solutions Guangzhou 2026
Whitepaper
- Middle East & Africa Commercial Security Market Click here to view more.
- Middle East & Africa Fire Safety Systems & Equipment Market Click here to view more.
- GCC Drone Market Click here to view more.
- Middle East Lighting Fixture Market Click here to view more.
- GCC Physical & Perimeter Security Market Click here to view more.
6WResearch In News
- Doha a strategic location for EV manufacturing hub: IPA Qatar
- Demand for luxury TVs surging in the GCC, says Samsung
- Empowering Growth: The Thriving Journey of Bangladesh’s Cable Industry
- Demand for luxury TVs surging in the GCC, says Samsung
- Video call with a traditional healer? Once unthinkable, it’s now common in South Africa
- Intelligent Buildings To Smooth GCC’s Path To Net Zero