Netherlands Nano Gold Market (2026-2032) | Trends, Outlook, Forecast, Size, Segmentation, Investment Trends, Pricing Analysis, Challenges, Strategy, Value, Companies, Competition, Opportunities, Restraints, Segments, Strategic Insights, Drivers, Growth, Supply, Revenue, Demand, Industry, Analysis, Share, Consumer Insights, Competitive
Market Forecast By Form (Nanoparticles, Colloidal Gold, Nano Gold Wires, Nano Gold Films, Hybrid Nano Gold), By Application (Drug Delivery, Diagnostics, Electronics, Catalysis, Cosmetics), By Particle Size (Below 10 nm, 10-50 nm, 50-100 nm, Above 100 nm, Custom Size), By Function (Targeted Therapy, Imaging Contrast, Conductivity, Catalytic Activity, Anti-Aging), By Technology (Biofunctionalization, Surface Plasmon Resonance, Nano-Interconnects, Thin-Film Deposition, Biocompatible Coatings) And Competitive Landscape
| Product Code: ETC12965004 | Publication Date: Apr 2025 | Updated Date: Apr 2026 | Product Type: Market Research Report | |
| Publisher: 6Wresearch | No. of Pages: 65 | No. of Figures: 34 | No. of Tables: 19 | |
Netherlands Nano Gold Market Size (2020-2030)
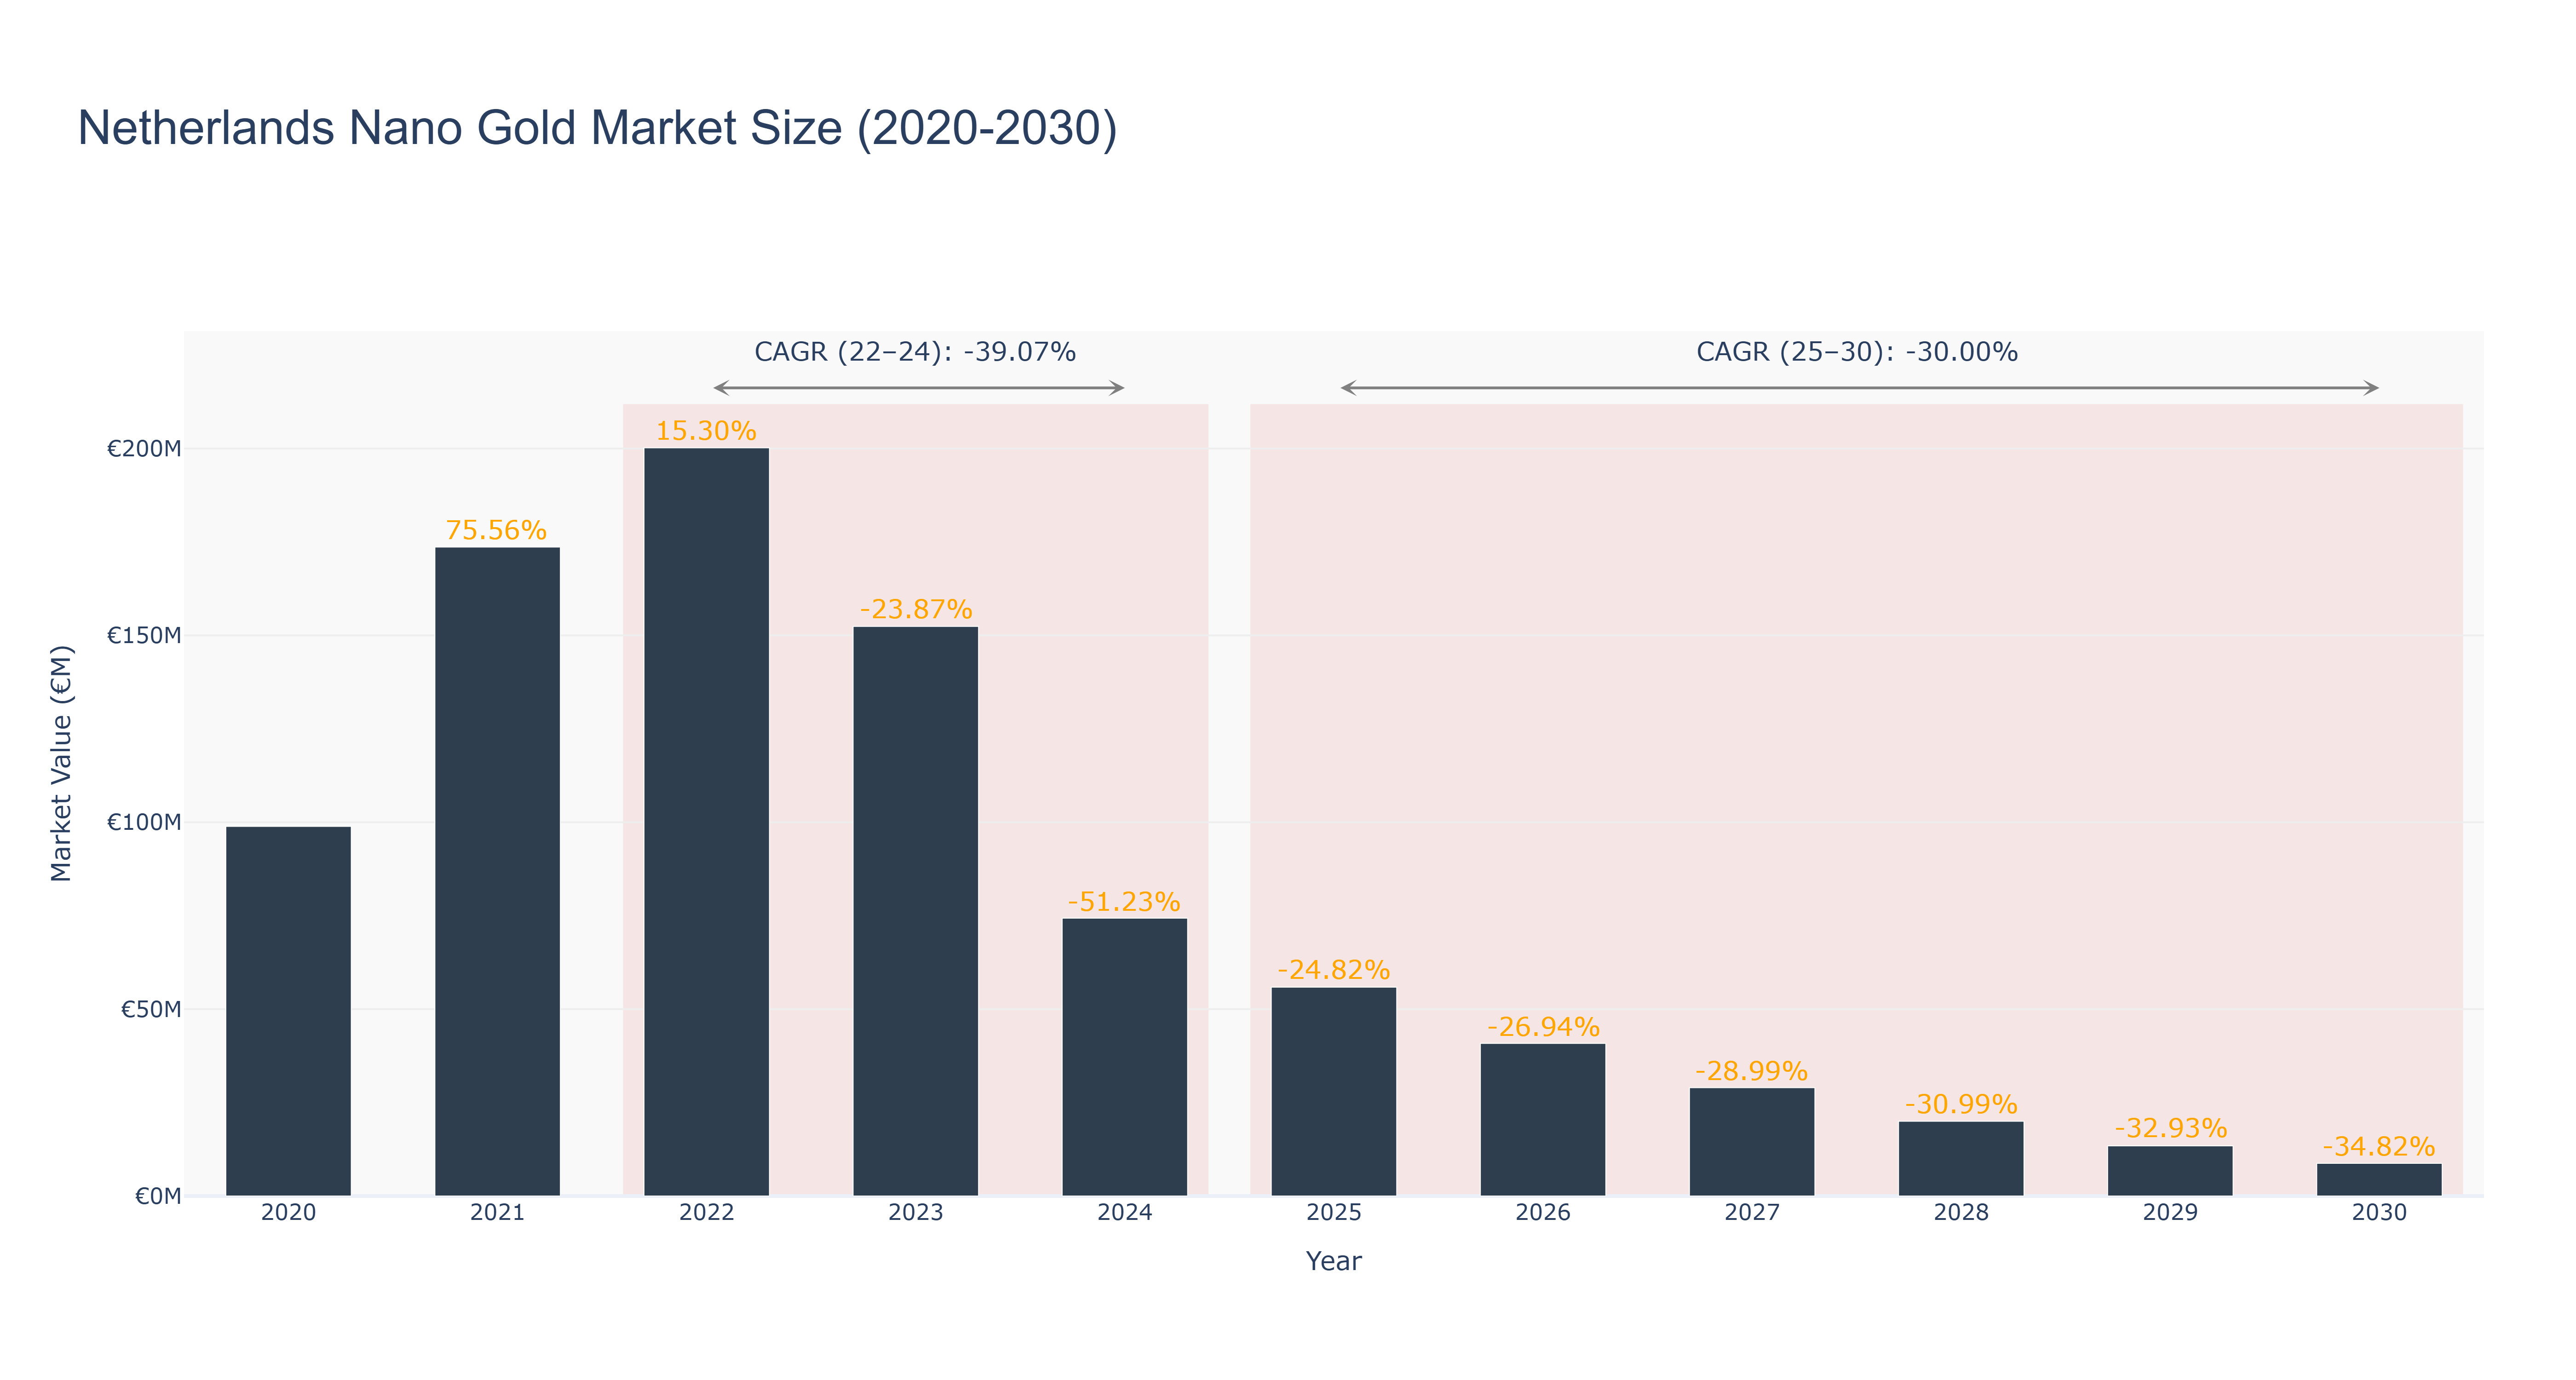
The Netherlands Nano Gold Market experienced significant fluctuations between 2020 and 2024, peaking in 2021 with a market size of €173.64 million, before declining to €74.32 million by 2024. The actual CAGR for this period stands at -39.07%, driven primarily by market saturation, shifting consumer preferences, and increased competition. In the projected period from 2025 to 2030, the market is expected to continue its downward trend, with a forecasted CAGR of -30.00%, culminating in a market size of just €8.74 million by 2030. Factors contributing to this decline include regulatory challenges, diminishing novelty of nano gold applications, and economic pressures affecting consumer spending. While there are currently no notable upcoming projects that could reverse this trend, continued innovation in nanotechnology and potential shifts in investment strategies may offer some long-term recovery opportunities for the sector.
Netherlands Nano Gold Market: Production & Trade Performance (2019-2025)
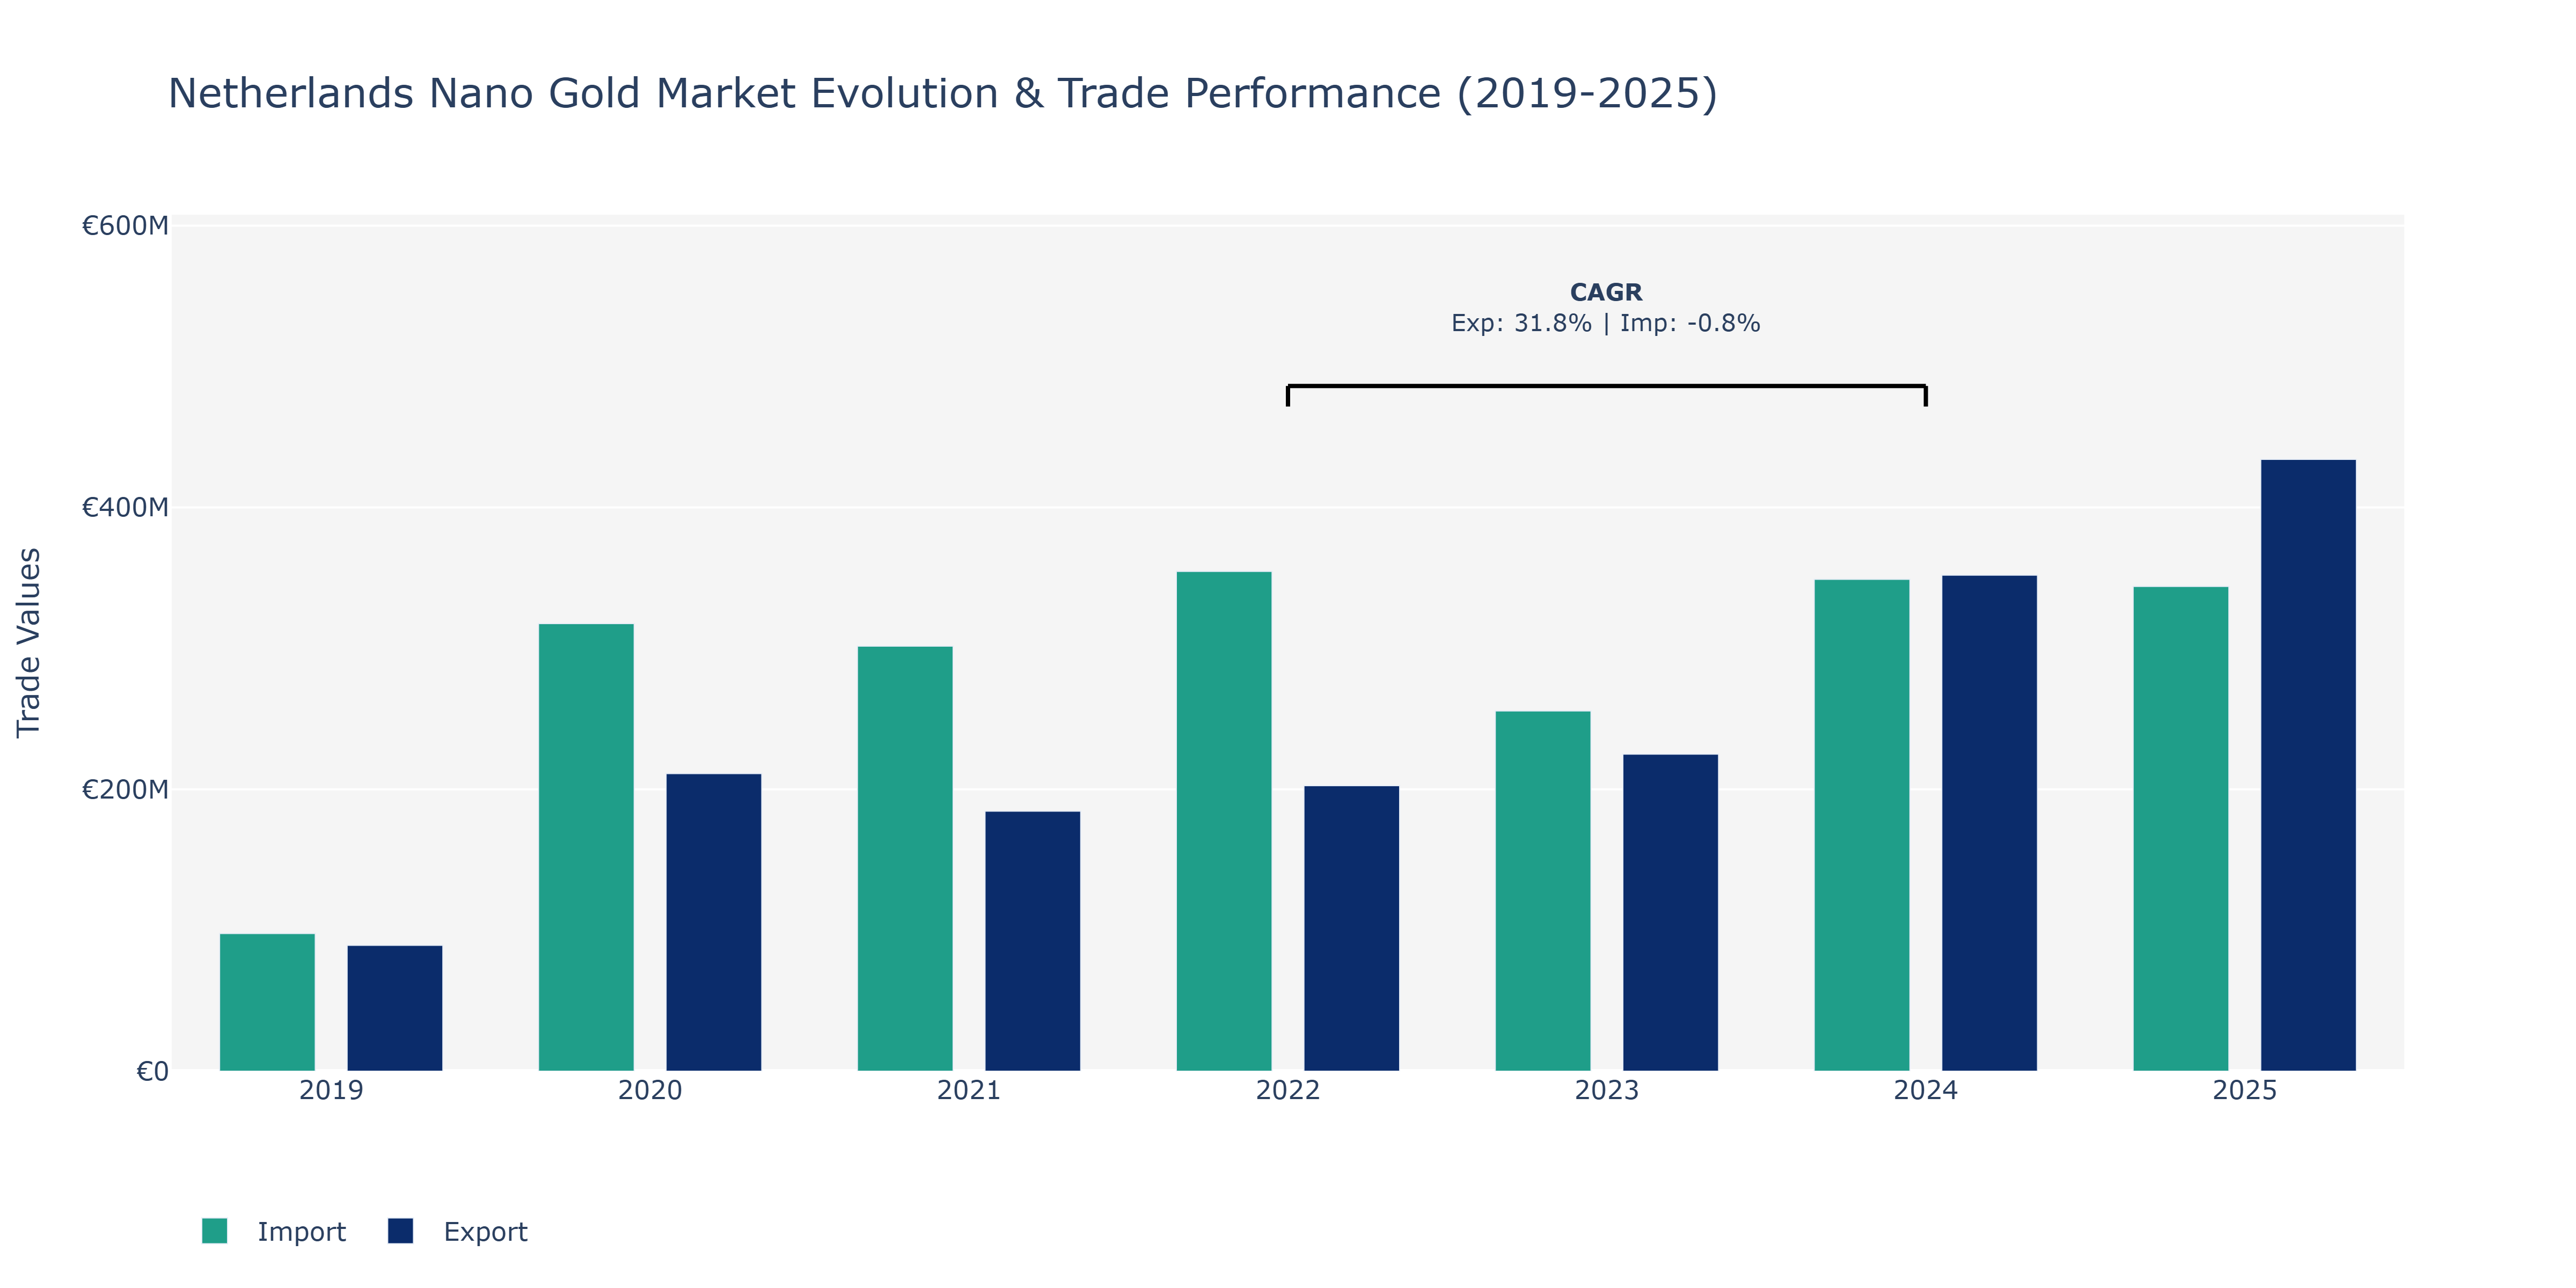
The Netherlands Nano Gold Market witnessed a notable surge in exports from 2019 to 2025, starting at €89.27 million and reaching €434.12 million in 2025. This substantial growth can be attributed to the increasing global demand for nanotechnology applications in various industries, driving the Export value to peak in 2025. In contrast, imports fluctuated over the years, with a peak in 2022 at €354.67 million, followed by a slight decline in 2023 and 2025, possibly indicating shifts in domestic consumption patterns or changes in sourcing strategies. The dip in 2023 could be due to supply chain disruptions or regulatory changes impacting import volumes. Overall, the market's performance reflects the dynamic nature of the nanotechnology sector, where innovation and regulatory factors play crucial roles in shaping trade flows.
Key Highlights of the Report:
- Netherlands Nano Gold Market Outlook
- Market Size of Netherlands Nano Gold Market, 2025
- Forecast of Netherlands Nano Gold Market, 2032
- Historical Data and Forecast of Netherlands Nano Gold Revenues & Volume for the Period 2022 - 2032F
- Netherlands Nano Gold Market Trend Evolution
- Netherlands Nano Gold Market Drivers and Challenges
- Netherlands Nano Gold Price Trends
- Netherlands Nano Gold Porter's Five Forces
- Netherlands Nano Gold Industry Life Cycle
- Historical Data and Forecast of Netherlands Nano Gold Market Revenues & Volume By Form for the Period 2022 - 2032F
- Historical Data and Forecast of Netherlands Nano Gold Market Revenues & Volume By Nanoparticles for the Period 2022 - 2032F
- Historical Data and Forecast of Netherlands Nano Gold Market Revenues & Volume By Colloidal Gold for the Period 2022 - 2032F
- Historical Data and Forecast of Netherlands Nano Gold Market Revenues & Volume By Nano Gold Wires for the Period 2022 - 2032F
- Historical Data and Forecast of Netherlands Nano Gold Market Revenues & Volume By Nano Gold Films for the Period 2022 - 2032F
- Historical Data and Forecast of Netherlands Nano Gold Market Revenues & Volume By Hybrid Nano Gold for the Period 2022 - 2032F
- Historical Data and Forecast of Netherlands Nano Gold Market Revenues & Volume By Application for the Period 2022 - 2032F
- Historical Data and Forecast of Netherlands Nano Gold Market Revenues & Volume By Drug Delivery for the Period 2022 - 2032F
- Historical Data and Forecast of Netherlands Nano Gold Market Revenues & Volume By Diagnostics for the Period 2022 - 2032F
- Historical Data and Forecast of Netherlands Nano Gold Market Revenues & Volume By Electronics for the Period 2022 - 2032F
- Historical Data and Forecast of Netherlands Nano Gold Market Revenues & Volume By Catalysis for the Period 2022 - 2032F
- Historical Data and Forecast of Netherlands Nano Gold Market Revenues & Volume By Cosmetics for the Period 2022 - 2032F
- Historical Data and Forecast of Netherlands Nano Gold Market Revenues & Volume By Particle Size for the Period 2022 - 2032F
- Historical Data and Forecast of Netherlands Nano Gold Market Revenues & Volume By Below 10 nm for the Period 2022 - 2032F
- Historical Data and Forecast of Netherlands Nano Gold Market Revenues & Volume By 10-50 nm for the Period 2022 - 2032F
- Historical Data and Forecast of Netherlands Nano Gold Market Revenues & Volume By 50-100 nm for the Period 2022 - 2032F
- Historical Data and Forecast of Netherlands Nano Gold Market Revenues & Volume By Above 100 nm for the Period 2022 - 2032F
- Historical Data and Forecast of Netherlands Nano Gold Market Revenues & Volume By Custom Size for the Period 2022 - 2032F
- Historical Data and Forecast of Netherlands Nano Gold Market Revenues & Volume By Function for the Period 2022 - 2032F
- Historical Data and Forecast of Netherlands Nano Gold Market Revenues & Volume By Targeted Therapy for the Period 2022 - 2032F
- Historical Data and Forecast of Netherlands Nano Gold Market Revenues & Volume By Imaging Contrast for the Period 2022 - 2032F
- Historical Data and Forecast of Netherlands Nano Gold Market Revenues & Volume By Conductivity for the Period 2022 - 2032F
- Historical Data and Forecast of Netherlands Nano Gold Market Revenues & Volume By Catalytic Activity for the Period 2022 - 2032F
- Historical Data and Forecast of Netherlands Nano Gold Market Revenues & Volume By Anti-Aging for the Period 2022 - 2032F
- Historical Data and Forecast of Netherlands Nano Gold Market Revenues & Volume By Technology for the Period 2022 - 2032F
- Historical Data and Forecast of Netherlands Nano Gold Market Revenues & Volume By Biofunctionalization for the Period 2022 - 2032F
- Historical Data and Forecast of Netherlands Nano Gold Market Revenues & Volume By Surface Plasmon Resonance for the Period 2022 - 2032F
- Historical Data and Forecast of Netherlands Nano Gold Market Revenues & Volume By Nano-Interconnects for the Period 2022 - 2032F
- Historical Data and Forecast of Netherlands Nano Gold Market Revenues & Volume By Thin-Film Deposition for the Period 2022 - 2032F
- Historical Data and Forecast of Netherlands Nano Gold Market Revenues & Volume By Biocompatible Coatings for the Period 2022 - 2032F
- Netherlands Nano Gold Import Export Trade Statistics
- Market Opportunity Assessment By Form
- Market Opportunity Assessment By Application
- Market Opportunity Assessment By Particle Size
- Market Opportunity Assessment By Function
- Market Opportunity Assessment By Technology
- Netherlands Nano Gold Top Companies Market Share
- Netherlands Nano Gold Competitive Benchmarking By Technical and Operational Parameters
- Netherlands Nano Gold Company Profiles
- Netherlands Nano Gold Key Strategic Recommendations
Frequently Asked Questions About the Market Study (FAQs):
6Wresearch actively monitors the Netherlands Nano Gold Market and publishes its comprehensive annual report, highlighting emerging trends, growth drivers, revenue analysis, and forecast outlook. Our insights help businesses to make data-backed strategic decisions with ongoing market dynamics. Our analysts track relevent industries related to the Netherlands Nano Gold Market, allowing our clients with actionable intelligence and reliable forecasts tailored to emerging regional needs.
Yes, we provide customisation as per your requirements. To learn more, feel free to contact us on sales@6wresearch.com
1 Executive Summary |
2 Introduction |
2.1 Key Highlights of the Report |
2.2 Report Description |
2.3 Market Scope & Segmentation |
2.4 Research Methodology |
2.5 Assumptions |
3 Netherlands Nano Gold Market Overview |
3.1 Netherlands Country Macro Economic Indicators |
3.2 Netherlands Nano Gold Market Revenues & Volume, 2022 & 2032F |
3.3 Netherlands Nano Gold Market - Industry Life Cycle |
3.4 Netherlands Nano Gold Market - Porter's Five Forces |
3.5 Netherlands Nano Gold Market Revenues & Volume Share, By Form, 2022 & 2032F |
3.6 Netherlands Nano Gold Market Revenues & Volume Share, By Application, 2022 & 2032F |
3.7 Netherlands Nano Gold Market Revenues & Volume Share, By Particle Size, 2022 & 2032F |
3.8 Netherlands Nano Gold Market Revenues & Volume Share, By Function, 2022 & 2032F |
3.9 Netherlands Nano Gold Market Revenues & Volume Share, By Technology, 2022 & 2032F |
4 Netherlands Nano Gold Market Dynamics |
4.1 Impact Analysis |
4.2 Market Drivers |
4.2.1 Increasing demand for advanced medical diagnostics and treatments using nano gold technology |
4.2.2 Growing investments in research and development of nanotechnology in the Netherlands |
4.2.3 Favorable government initiatives and policies supporting the adoption of nano gold products |
4.3 Market Restraints |
4.3.1 High initial costs associated with nano gold technology |
4.3.2 Regulatory challenges and uncertainty surrounding the use of nanomaterials in healthcare and other industries |
5 Netherlands Nano Gold Market Trends |
6 Netherlands Nano Gold Market, By Types |
6.1 Netherlands Nano Gold Market, By Form |
6.1.1 Overview and Analysis |
6.1.2 Netherlands Nano Gold Market Revenues & Volume, By Form, 2022 - 2032F |
6.1.3 Netherlands Nano Gold Market Revenues & Volume, By Nanoparticles, 2022 - 2032F |
6.1.4 Netherlands Nano Gold Market Revenues & Volume, By Colloidal Gold, 2022 - 2032F |
6.1.5 Netherlands Nano Gold Market Revenues & Volume, By Nano Gold Wires, 2022 - 2032F |
6.1.6 Netherlands Nano Gold Market Revenues & Volume, By Nano Gold Films, 2022 - 2032F |
6.1.7 Netherlands Nano Gold Market Revenues & Volume, By Hybrid Nano Gold, 2022 - 2032F |
6.2 Netherlands Nano Gold Market, By Application |
6.2.1 Overview and Analysis |
6.2.2 Netherlands Nano Gold Market Revenues & Volume, By Drug Delivery, 2022 - 2032F |
6.2.3 Netherlands Nano Gold Market Revenues & Volume, By Diagnostics, 2022 - 2032F |
6.2.4 Netherlands Nano Gold Market Revenues & Volume, By Electronics, 2022 - 2032F |
6.2.5 Netherlands Nano Gold Market Revenues & Volume, By Catalysis, 2022 - 2032F |
6.2.6 Netherlands Nano Gold Market Revenues & Volume, By Cosmetics, 2022 - 2032F |
6.3 Netherlands Nano Gold Market, By Particle Size |
6.3.1 Overview and Analysis |
6.3.2 Netherlands Nano Gold Market Revenues & Volume, By Below 10 nm, 2022 - 2032F |
6.3.3 Netherlands Nano Gold Market Revenues & Volume, By 10-50 nm, 2022 - 2032F |
6.3.4 Netherlands Nano Gold Market Revenues & Volume, By 50-100 nm, 2022 - 2032F |
6.3.5 Netherlands Nano Gold Market Revenues & Volume, By Above 100 nm, 2022 - 2032F |
6.3.6 Netherlands Nano Gold Market Revenues & Volume, By Custom Size, 2022 - 2032F |
6.4 Netherlands Nano Gold Market, By Function |
6.4.1 Overview and Analysis |
6.4.2 Netherlands Nano Gold Market Revenues & Volume, By Targeted Therapy, 2022 - 2032F |
6.4.3 Netherlands Nano Gold Market Revenues & Volume, By Imaging Contrast, 2022 - 2032F |
6.4.4 Netherlands Nano Gold Market Revenues & Volume, By Conductivity, 2022 - 2032F |
6.4.5 Netherlands Nano Gold Market Revenues & Volume, By Catalytic Activity, 2022 - 2032F |
6.4.6 Netherlands Nano Gold Market Revenues & Volume, By Anti-Aging, 2022 - 2032F |
6.5 Netherlands Nano Gold Market, By Technology |
6.5.1 Overview and Analysis |
6.5.2 Netherlands Nano Gold Market Revenues & Volume, By Biofunctionalization, 2022 - 2032F |
6.5.3 Netherlands Nano Gold Market Revenues & Volume, By Surface Plasmon Resonance, 2022 - 2032F |
6.5.4 Netherlands Nano Gold Market Revenues & Volume, By Nano-Interconnects, 2022 - 2032F |
6.5.5 Netherlands Nano Gold Market Revenues & Volume, By Thin-Film Deposition, 2022 - 2032F |
6.5.6 Netherlands Nano Gold Market Revenues & Volume, By Biocompatible Coatings, 2022 - 2032F |
7 Netherlands Nano Gold Market Import-Export Trade Statistics |
7.1 Netherlands Nano Gold Market Export to Major Countries |
7.2 Netherlands Nano Gold Market Imports from Major Countries |
8 Netherlands Nano Gold Market Key Performance Indicators |
8.1 Research and development expenditure in nanotechnology in the Netherlands |
8.2 Number of patents filed related to nano gold applications |
8.3 Adoption rate of nano gold technology in key industries in the Netherlands |
9 Netherlands Nano Gold Market - Opportunity Assessment |
9.1 Netherlands Nano Gold Market Opportunity Assessment, By Form, 2022 & 2032F |
9.2 Netherlands Nano Gold Market Opportunity Assessment, By Application, 2022 & 2032F |
9.3 Netherlands Nano Gold Market Opportunity Assessment, By Particle Size, 2022 & 2032F |
9.4 Netherlands Nano Gold Market Opportunity Assessment, By Function, 2022 & 2032F |
9.5 Netherlands Nano Gold Market Opportunity Assessment, By Technology, 2022 & 2032F |
10 Netherlands Nano Gold Market - Competitive Landscape |
10.1 Netherlands Nano Gold Market Revenue Share, By Companies, 2025 |
10.2 Netherlands Nano Gold Market Competitive Benchmarking, By Operating and Technical Parameters |
11 Company Profiles |
12 Recommendations |
13 Disclaimer |
Export potential assessment - trade Analytics for 2030
Export potential enables firms to identify high-growth global markets with greater confidence by combining advanced trade intelligence with a structured quantitative methodology. The framework analyzes emerging demand trends and country-level import patterns while integrating macroeconomic and trade datasets such as GDP and population forecasts, bilateral import–export flows, tariff structures, elasticity differentials between developed and developing economies, geographic distance, and import demand projections. Using weighted trade values from 2020–2024 as the base period to project country-to-country export potential for 2030, these inputs are operationalized through calculated drivers such as gravity model parameters, tariff impact factors, and projected GDP per-capita growth. Through an analysis of hidden potentials, demand hotspots, and market conditions that are most favorable to success, this method enables firms to focus on target countries, maximize returns, and global expansion with data, backed by accuracy.
By factoring in the projected importer demand gap that is currently unmet and could be potential opportunity, it identifies the potential for the Exporter (Country) among 190 countries, against the general trade analysis, which identifies the biggest importer or exporter.
To discover high-growth global markets and optimize your business strategy:
Click Here
Pricing
- Single User License$ 1,995
- Department License$ 2,400
- Site License$ 3,120
- Global License$ 3,795

Search
Thought Leadership and Analyst Meet


Our Clients
Latest Reports
- India Ultrasonic Smart Water Meter Market (2026-2032) | Outlook, Competition, Drivers, Trends, Demand, Competitive, Strategic Insights, Companies, Challenges, Strategy, Consumer Insights, Analysis, Opportunities, Growth, Size, Share, Industry, Revenue, Segments, Value, Segmentation, Supply, Forecast, Restraints,
- India Electromagnetic Bulk Flow Meter Market (2026-2032) | Analysis, Challenges, Strategic Insights, Supply, Forecast, Growth, Share, Consumer Insights, Competitive, Value, Outlook, Size & Demand,
- India Battery Powered Bulk Flow Meter Market (2026-2032) | Outlook, Analysis, Competitive Landscape, Growth, Size, Trends, Value, Revenue, Companies, Segmentation, Share & Forecast
- Bosnia and Herzegovina Fuel-Efficient Winglets Market (2026-2032) | Growth, Competition, Strategy, Restraints, Trends, Challenges, segmentation, Value, Outlook, Investment Opportunities, Analysis, Revenue, Companies, Insights, Pricing, Size, Drivers, Demand, Share, Forecast
- Canada Cloud CFD Market (2026-2032) | Size & Revenue, Industry, Growth, Competitive Landscape, Forecast, Segmentation, Value, Outlook, Trends, Share, Analysis, Companies
- Taiwan Food Delivery Platform Market (2026-2032) | Companies, Outlook, Analysis, Trends, Value, Revenue, Segmentation, Share, Forecast, Competitive Landscape, Growth, Size & Forecast
- United Kingdom (UK) Long-term Care Insurance Market (2026-2032) | Growth, Share, Consumer Insights, Drivers, Opportunities, Competition, Pricing Analysis, Segments, Restraints, Companies, Competitive, Value, Outlook, Size, Demand, Analysis, Challenges, Strategic Insights, Investment Trends, Revenue, Trends, Supply, Forecast
- United Kingdom (UK) Long Term Care Market (2026-2032) | Companies, Outlook, Analysis, Trends, Value, Revenue, Segmentation, Share, Forecast, Competitive Landscape, Growth, Size & Forecast
- Iraq Insulation and Waterproofing Market (2026-2032) | Outlook, Drivers, Growth, Size, Share, Industry, Revenue, Trends, Demand, Competitive, Strategic Insights, Opportunities, Segments, Companies, Challenges, Strategy, Consumer Insights, Analysis, Investment Trends, Value, Segmentation, Forecast, Restraints
- India Switchgear Market Outlook (2026-2032) | Size, Share, Trends, Growth, Revenue, Forecast, Analysis, Value, Outlook
Industry Events and Analyst Meet

India EV Show 2026

EV tech India Expo 2026

Auto Tech Asia 2026

Battery Tech India 2026

Smart Production Solutions Guangzhou 2026
Whitepaper
- Middle East & Africa Commercial Security Market Click here to view more.
- Middle East & Africa Fire Safety Systems & Equipment Market Click here to view more.
- GCC Drone Market Click here to view more.
- Middle East Lighting Fixture Market Click here to view more.
- GCC Physical & Perimeter Security Market Click here to view more.
6WResearch In News
- Doha a strategic location for EV manufacturing hub: IPA Qatar
- Demand for luxury TVs surging in the GCC, says Samsung
- Empowering Growth: The Thriving Journey of Bangladesh’s Cable Industry
- Demand for luxury TVs surging in the GCC, says Samsung
- Video call with a traditional healer? Once unthinkable, it’s now common in South Africa
- Intelligent Buildings To Smooth GCC’s Path To Net Zero