New Zealand Ink Market (2025-2031) | Segmentation, Trends, Outlook, Growth, Companies, Value, Size, Industry, Analysis, Forecast, Revenue & Share
Market Forecast By Technology (Lithographic , Flexographic , Gravure, Digital, Letterpress, Others), By Ink Type (Oil Based, Solvent Based, Water Based), By Applications (Label And Packaging, Commercial Printing, Publications, Others) And Competitive Landscape
| Product Code: ETC5099032 | Publication Date: Nov 2023 | Updated Date: Sep 2025 | Product Type: Market Research Report | |
| Publisher: 6Wresearch | Author: Sachin Kumar Rai | No. of Pages: 60 | No. of Figures: 30 | No. of Tables: 5 |
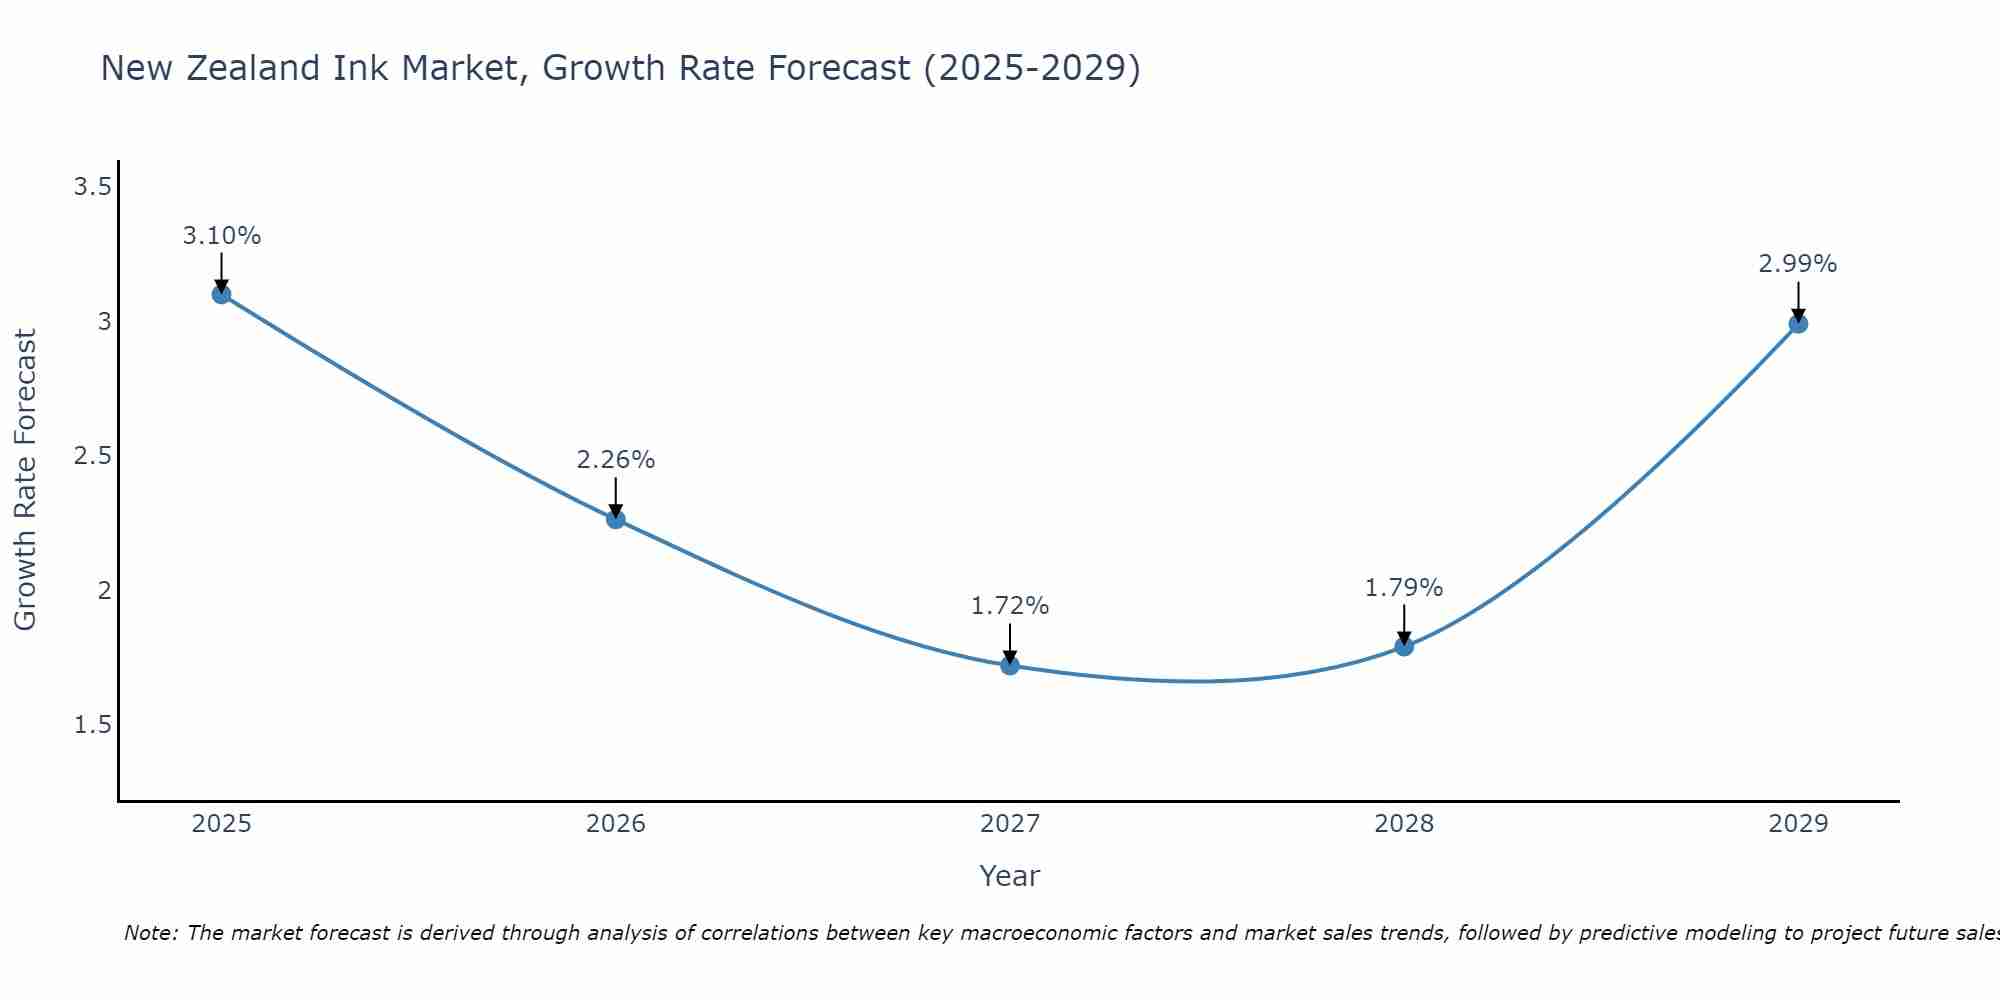
New Zealand Ink Market Size Growth Rate
The New Zealand Ink Market is projected to witness mixed growth rate patterns during 2025 to 2029. Although the growth rate starts strong at 3.10% in 2025, it steadily loses momentum, ending at 2.99% by 2029.
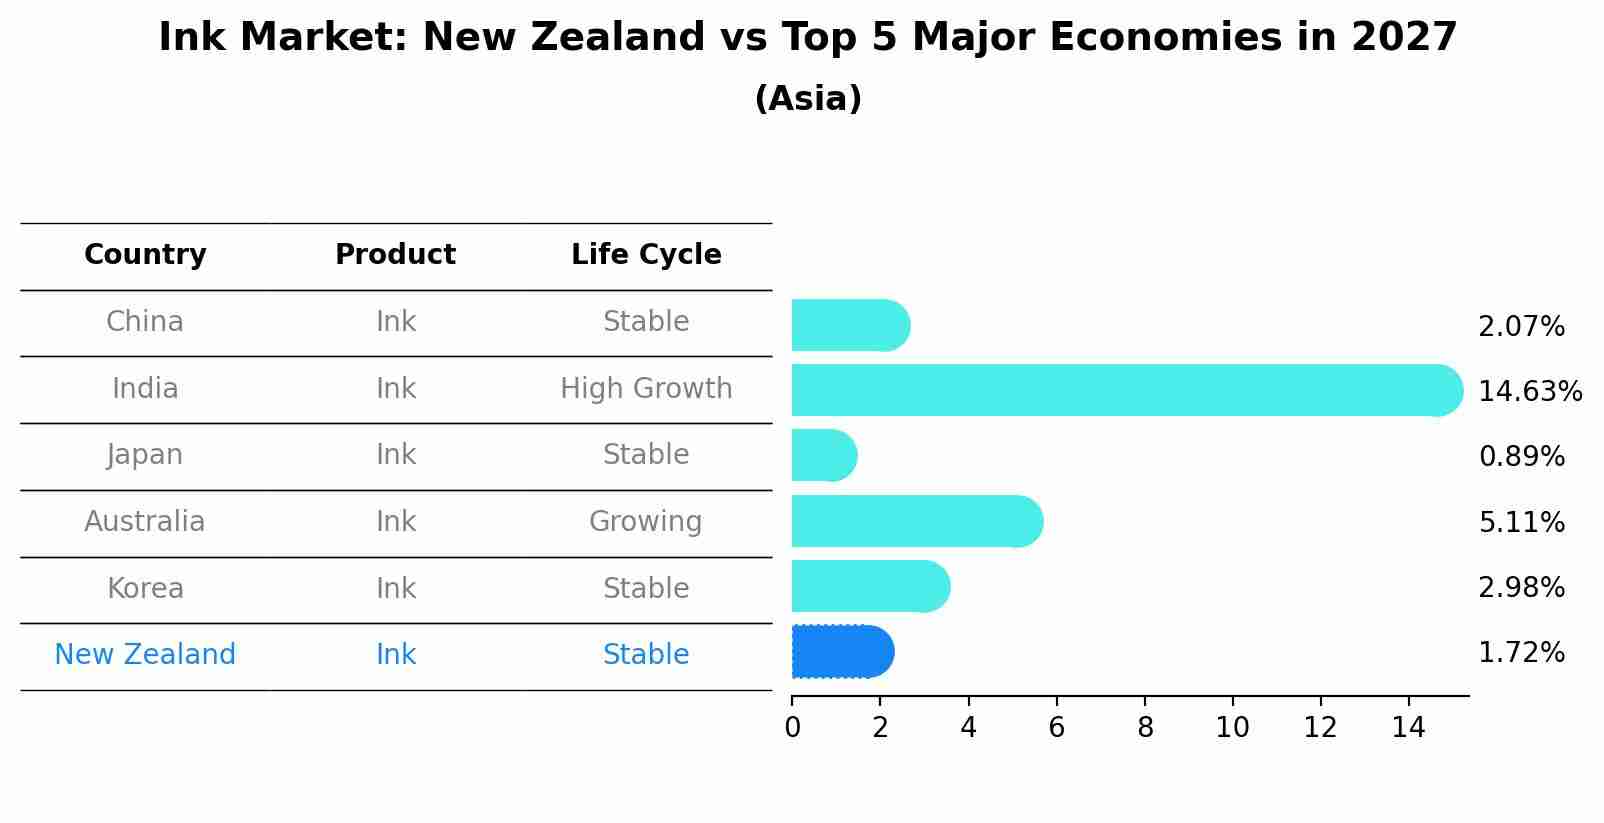
Ink Market: New Zealand vs Top 5 Major Economies in 2027 (Asia)
By 2027, New Zealand's Ink market is forecasted to achieve a stable growth rate of 1.72%, with China leading the Asia region, followed by India, Japan, Australia and South Korea.
New Zealand Ink Market Overview
The ink market in New Zealand serves various industries, including printing, packaging, and publishing. Innovations in ink formulations, such as eco-friendly and high-performance inks, are shaping the market landscape.
Drivers of the market
The printing industry, along with the packaging and textile sectors, constitutes significant end-users of ink products. Market drivers include technological advancements in printing processes, such as digital and UV printing, as well as the growing demand for eco-friendly and specialty inks.
Challenges of the market
Challenges in the ink market include environmental concerns related to solvent-based inks, the need for faster drying times, and maintaining color consistency across different printing substrates. Moreover, adapting to digital printing technologies and shifting consumer preferences pose additional challenges.
Government Policy of the market
The ink market in New Zealand is shaped by government policies related to environmental sustainability and industrial manufacturing. Regulations promoting the use of eco-friendly and non-toxic inks influence market trends. Government support for the printing and packaging industries through grants and incentives also contributes to market growth.
Key Highlights of the Report:
- New Zealand Ink Market Outlook
- Market Size of New Zealand Ink Market, 2024
- Forecast of New Zealand Ink Market, 2031
- Historical Data and Forecast of New Zealand Ink Revenues & Volume for the Period 2021-2031
- New Zealand Ink Market Trend Evolution
- New Zealand Ink Market Drivers and Challenges
- New Zealand Ink Price Trends
- New Zealand Ink Porter`s Five Forces
- New Zealand Ink Industry Life Cycle
- Historical Data and Forecast of New Zealand Ink Market Revenues & Volume By Technology for the Period 2021-2031
- Historical Data and Forecast of New Zealand Ink Market Revenues & Volume By Lithographic for the Period 2021-2031
- Historical Data and Forecast of New Zealand Ink Market Revenues & Volume By Flexographic for the Period 2021-2031
- Historical Data and Forecast of New Zealand Ink Market Revenues & Volume By Gravure for the Period 2021-2031
- Historical Data and Forecast of New Zealand Ink Market Revenues & Volume By Digital for the Period 2021-2031
- Historical Data and Forecast of New Zealand Ink Market Revenues & Volume By Letterpress for the Period 2021-2031
- Historical Data and Forecast of New Zealand Ink Market Revenues & Volume By Others for the Period 2021-2031
- Historical Data and Forecast of New Zealand Ink Market Revenues & Volume By Ink Type for the Period 2021-2031
- Historical Data and Forecast of New Zealand Ink Market Revenues & Volume By Oil Based for the Period 2021-2031
- Historical Data and Forecast of New Zealand Ink Market Revenues & Volume By Solvent Based for the Period 2021-2031
- Historical Data and Forecast of New Zealand Ink Market Revenues & Volume By Water Based for the Period 2021-2031
- Historical Data and Forecast of New Zealand Ink Market Revenues & Volume By Applications for the Period 2021-2031
- Historical Data and Forecast of New Zealand Ink Market Revenues & Volume By Label And Packaging for the Period 2021-2031
- Historical Data and Forecast of New Zealand Ink Market Revenues & Volume By Commercial Printing for the Period 2021-2031
- Historical Data and Forecast of New Zealand Ink Market Revenues & Volume By Publications for the Period 2021-2031
- Historical Data and Forecast of New Zealand Ink Market Revenues & Volume By Others for the Period 2021-2031
- New Zealand Ink Import Export Trade Statistics
- Market Opportunity Assessment By Technology
- Market Opportunity Assessment By Ink Type
- Market Opportunity Assessment By Applications
- New Zealand Ink Top Companies Market Share
- New Zealand Ink Competitive Benchmarking By Technical and Operational Parameters
- New Zealand Ink Company Profiles
- New Zealand Ink Key Strategic Recommendations
Frequently Asked Questions About the Market Study (FAQs):
6Wresearch actively monitors the New Zealand Ink Market and publishes its comprehensive annual report, highlighting emerging trends, growth drivers, revenue analysis, and forecast outlook. Our insights help businesses to make data-backed strategic decisions with ongoing market dynamics. Our analysts track relevent industries related to the New Zealand Ink Market, allowing our clients with actionable intelligence and reliable forecasts tailored to emerging regional needs.
Yes, we provide customisation as per your requirements. To learn more, feel free to contact us on sales@6wresearch.com
1 Executive Summary |
2 Introduction |
2.1 Key Highlights of the Report |
2.2 Report Description |
2.3 Market Scope & Segmentation |
2.4 Research Methodology |
2.5 Assumptions |
3 New Zealand Ink Market Overview |
3.1 New Zealand Country Macro Economic Indicators |
3.2 New Zealand Ink Market Revenues & Volume, 2021 & 2031F |
3.3 New Zealand Ink Market - Industry Life Cycle |
3.4 New Zealand Ink Market - Porter's Five Forces |
3.5 New Zealand Ink Market Revenues & Volume Share, By Technology, 2021 & 2031F |
3.6 New Zealand Ink Market Revenues & Volume Share, By Ink Type, 2021 & 2031F |
3.7 New Zealand Ink Market Revenues & Volume Share, By Applications, 2021 & 2031F |
4 New Zealand Ink Market Dynamics |
4.1 Impact Analysis |
4.2 Market Drivers |
4.2.1 Growing demand for sustainable and eco-friendly inks |
4.2.2 Increasing adoption of digital printing technologies |
4.2.3 Rising investments in packaging and labeling industries |
4.3 Market Restraints |
4.3.1 Volatility in raw material prices |
4.3.2 Intense competition from alternative technologies |
4.3.3 Regulatory restrictions on certain ink formulations |
5 New Zealand Ink Market Trends |
6 New Zealand Ink Market Segmentations |
6.1 New Zealand Ink Market, By Technology |
6.1.1 Overview and Analysis |
6.1.2 New Zealand Ink Market Revenues & Volume, By Lithographic , 2021-2031F |
6.1.3 New Zealand Ink Market Revenues & Volume, By Flexographic , 2021-2031F |
6.1.4 New Zealand Ink Market Revenues & Volume, By Gravure, 2021-2031F |
6.1.5 New Zealand Ink Market Revenues & Volume, By Digital, 2021-2031F |
6.1.6 New Zealand Ink Market Revenues & Volume, By Letterpress, 2021-2031F |
6.1.7 New Zealand Ink Market Revenues & Volume, By Others, 2021-2031F |
6.2 New Zealand Ink Market, By Ink Type |
6.2.1 Overview and Analysis |
6.2.2 New Zealand Ink Market Revenues & Volume, By Oil Based, 2021-2031F |
6.2.3 New Zealand Ink Market Revenues & Volume, By Solvent Based, 2021-2031F |
6.2.4 New Zealand Ink Market Revenues & Volume, By Water Based, 2021-2031F |
6.3 New Zealand Ink Market, By Applications |
6.3.1 Overview and Analysis |
6.3.2 New Zealand Ink Market Revenues & Volume, By Label And Packaging, 2021-2031F |
6.3.3 New Zealand Ink Market Revenues & Volume, By Commercial Printing, 2021-2031F |
6.3.4 New Zealand Ink Market Revenues & Volume, By Publications, 2021-2031F |
6.3.5 New Zealand Ink Market Revenues & Volume, By Others, 2021-2031F |
7 New Zealand Ink Market Import-Export Trade Statistics |
7.1 New Zealand Ink Market Export to Major Countries |
7.2 New Zealand Ink Market Imports from Major Countries |
8 New Zealand Ink Market Key Performance Indicators |
8.1 Adoption rate of eco-friendly ink solutions |
8.2 Percentage of market share held by digital printing technology |
8.3 Growth in revenue from packaging and labeling sectors |
9 New Zealand Ink Market - Opportunity Assessment |
9.1 New Zealand Ink Market Opportunity Assessment, By Technology, 2021 & 2031F |
9.2 New Zealand Ink Market Opportunity Assessment, By Ink Type, 2021 & 2031F |
9.3 New Zealand Ink Market Opportunity Assessment, By Applications, 2021 & 2031F |
10 New Zealand Ink Market - Competitive Landscape |
10.1 New Zealand Ink Market Revenue Share, By Companies, 2024 |
10.2 New Zealand Ink Market Competitive Benchmarking, By Operating and Technical Parameters |
11 Company Profiles |
12 Recommendations | 13 Disclaimer |
Export potential assessment - trade Analytics for 2030
Export potential enables firms to identify high-growth global markets with greater confidence by combining advanced trade intelligence with a structured quantitative methodology. The framework analyzes emerging demand trends and country-level import patterns while integrating macroeconomic and trade datasets such as GDP and population forecasts, bilateral import–export flows, tariff structures, elasticity differentials between developed and developing economies, geographic distance, and import demand projections. Using weighted trade values from 2020–2024 as the base period to project country-to-country export potential for 2030, these inputs are operationalized through calculated drivers such as gravity model parameters, tariff impact factors, and projected GDP per-capita growth. Through an analysis of hidden potentials, demand hotspots, and market conditions that are most favorable to success, this method enables firms to focus on target countries, maximize returns, and global expansion with data, backed by accuracy.
By factoring in the projected importer demand gap that is currently unmet and could be potential opportunity, it identifies the potential for the Exporter (Country) among 190 countries, against the general trade analysis, which identifies the biggest importer or exporter.
To discover high-growth global markets and optimize your business strategy:
Click Here
Pricing
- Single User License$ 1,995
- Department License$ 2,400
- Site License$ 3,120
- Global License$ 3,795

Search
Thought Leadership and Analyst Meet


Our Clients
Latest Reports
- India Ultrasonic Smart Water Meter Market (2026-2032) | Outlook, Competition, Drivers, Trends, Demand, Competitive, Strategic Insights, Companies, Challenges, Strategy, Consumer Insights, Analysis, Opportunities, Growth, Size, Share, Industry, Revenue, Segments, Value, Segmentation, Supply, Forecast, Restraints,
- India Electromagnetic Bulk Flow Meter Market (2026-2032) | Analysis, Challenges, Strategic Insights, Supply, Forecast, Growth, Share, Consumer Insights, Competitive, Value, Outlook, Size & Demand,
- India Battery Powered Bulk Flow Meter Market (2026-2032) | Outlook, Analysis, Competitive Landscape, Growth, Size, Trends, Value, Revenue, Companies, Segmentation, Share & Forecast
- Bosnia and Herzegovina Fuel-Efficient Winglets Market (2026-2032) | Growth, Competition, Strategy, Restraints, Trends, Challenges, segmentation, Value, Outlook, Investment Opportunities, Analysis, Revenue, Companies, Insights, Pricing, Size, Drivers, Demand, Share, Forecast
- Canada Cloud CFD Market (2026-2032) | Size & Revenue, Industry, Growth, Competitive Landscape, Forecast, Segmentation, Value, Outlook, Trends, Share, Analysis, Companies
- Taiwan Food Delivery Platform Market (2026-2032) | Companies, Outlook, Analysis, Trends, Value, Revenue, Segmentation, Share, Forecast, Competitive Landscape, Growth, Size & Forecast
- United Kingdom (UK) Long-term Care Insurance Market (2026-2032) | Growth, Share, Consumer Insights, Drivers, Opportunities, Competition, Pricing Analysis, Segments, Restraints, Companies, Competitive, Value, Outlook, Size, Demand, Analysis, Challenges, Strategic Insights, Investment Trends, Revenue, Trends, Supply, Forecast
- United Kingdom (UK) Long Term Care Market (2026-2032) | Companies, Outlook, Analysis, Trends, Value, Revenue, Segmentation, Share, Forecast, Competitive Landscape, Growth, Size & Forecast
- Iraq Insulation and Waterproofing Market (2026-2032) | Outlook, Drivers, Growth, Size, Share, Industry, Revenue, Trends, Demand, Competitive, Strategic Insights, Opportunities, Segments, Companies, Challenges, Strategy, Consumer Insights, Analysis, Investment Trends, Value, Segmentation, Forecast, Restraints
- India Switchgear Market Outlook (2026-2032) | Size, Share, Trends, Growth, Revenue, Forecast, Analysis, Value, Outlook
Industry Events and Analyst Meet

India EV Show 2026

EV tech India Expo 2026

Auto Tech Asia 2026

Battery Tech India 2026

Smart Production Solutions Guangzhou 2026
Whitepaper
- Middle East & Africa Commercial Security Market Click here to view more.
- Middle East & Africa Fire Safety Systems & Equipment Market Click here to view more.
- GCC Drone Market Click here to view more.
- Middle East Lighting Fixture Market Click here to view more.
- GCC Physical & Perimeter Security Market Click here to view more.
6WResearch In News
- Doha a strategic location for EV manufacturing hub: IPA Qatar
- Demand for luxury TVs surging in the GCC, says Samsung
- Empowering Growth: The Thriving Journey of Bangladesh’s Cable Industry
- Demand for luxury TVs surging in the GCC, says Samsung
- Video call with a traditional healer? Once unthinkable, it’s now common in South Africa
- Intelligent Buildings To Smooth GCC’s Path To Net Zero