New Zealand Mobility Scooter Market (2026-2032) | Segmentation, Size & Revenue, Share, Analysis, Industry, Trends, Outlook, Companies, Forecast, Growth, Competitive Landscape, Value
Market Forecast By Type (Small (Less than 110cm), Medium (110-150cm), Large (More than 150cm)), By Application (In-House, Outdoor, Off-Road), By Number of Wheels (Three Wheels, Four Wheels, Others), By Battery Range (Less than 10 Miles, 10-20 Miles, More than 20 Miles), By End use (Personal Use, Institutional Use) And Competitive Landscape
| Product Code: ETC8564784 | Publication Date: Sep 2024 | Updated Date: Apr 2026 | Product Type: Market Research Report | |
| Publisher: 6Wresearch | Author: Dhaval Chaurasia | No. of Pages: 75 | No. of Figures: 35 | No. of Tables: 20 |
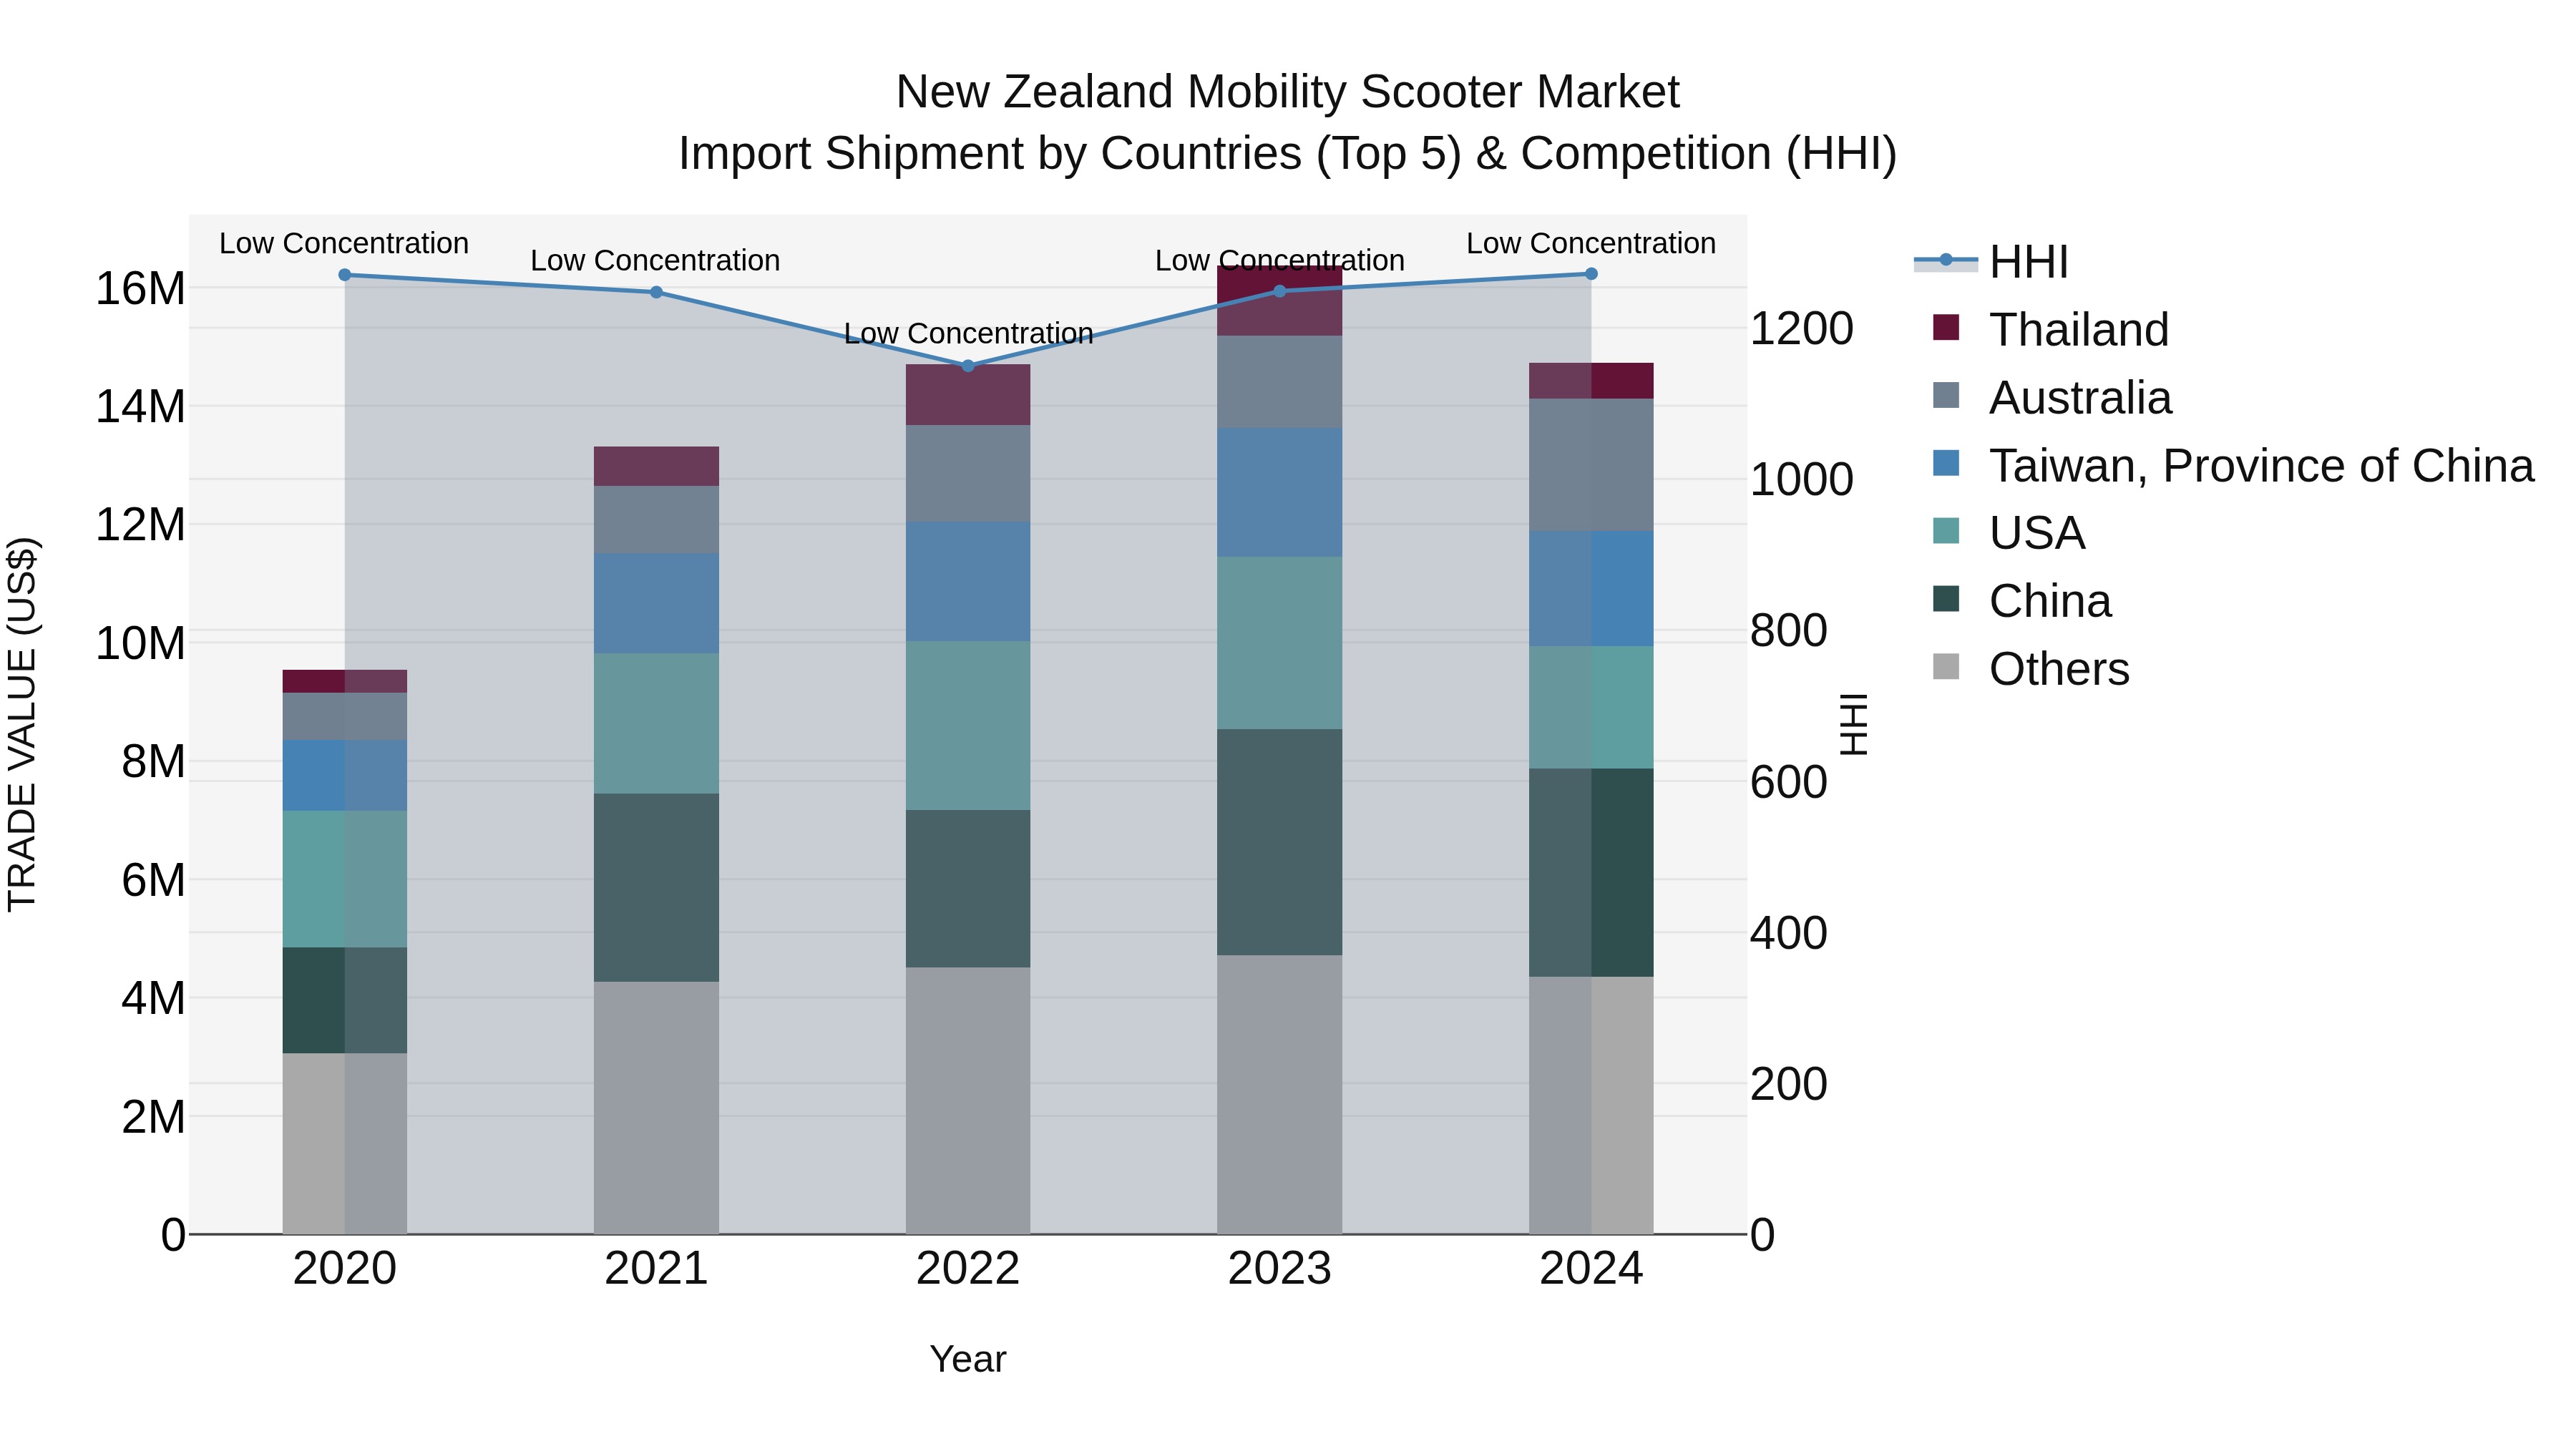
New Zealand Mobility Scooter Market Top 5 Importing Countries and Market Competition (HHI) Analysis
In 2024, New Zealand saw a diverse range of mobility scooter imports from key countries including China, Australia, USA, Taiwan, and Canada. The market continues to exhibit low concentration with a Herfindahl-Hirschman Index (HHI) reflecting a competitive landscape. Despite a slight decline in growth rate from 2023 to 2024, the compound annual growth rate (CAGR) from 2020 to 2024 remains strong at 11.46%, indicating sustained interest and investment in the mobility scooter market in New Zealand.
Key Highlights of the Report:
- New Zealand Mobility Scooter Market Outlook
- Market Size of New Zealand Mobility Scooter Market, 2025
- Forecast of New Zealand Mobility Scooter Market, 2032
- Historical Data and Forecast of New Zealand Mobility Scooter Revenues & Volume for the Period 2022 - 2032
- New Zealand Mobility Scooter Market Trend Evolution
- New Zealand Mobility Scooter Market Drivers and Challenges
- New Zealand Mobility Scooter Price Trends
- New Zealand Mobility Scooter Porter's Five Forces
- New Zealand Mobility Scooter Industry Life Cycle
- Historical Data and Forecast of New Zealand Mobility Scooter Market Revenues & Volume By Type for the Period 2022 - 2032
- Historical Data and Forecast of New Zealand Mobility Scooter Market Revenues & Volume By Small (Less than 110cm) for the Period 2022 - 2032
- Historical Data and Forecast of New Zealand Mobility Scooter Market Revenues & Volume By Medium (110-150cm) for the Period 2022 - 2032
- Historical Data and Forecast of New Zealand Mobility Scooter Market Revenues & Volume By Large (More than 150cm) for the Period 2022 - 2032
- Historical Data and Forecast of New Zealand Mobility Scooter Market Revenues & Volume By Application for the Period 2022 - 2032
- Historical Data and Forecast of New Zealand Mobility Scooter Market Revenues & Volume By In-House for the Period 2022 - 2032
- Historical Data and Forecast of New Zealand Mobility Scooter Market Revenues & Volume By Outdoor for the Period 2022 - 2032
- Historical Data and Forecast of New Zealand Mobility Scooter Market Revenues & Volume By Off-Road for the Period 2022 - 2032
- Historical Data and Forecast of New Zealand Mobility Scooter Market Revenues & Volume By Number of Wheels for the Period 2022 - 2032
- Historical Data and Forecast of New Zealand Mobility Scooter Market Revenues & Volume By Three Wheels for the Period 2022 - 2032
- Historical Data and Forecast of New Zealand Mobility Scooter Market Revenues & Volume By Four Wheels for the Period 2022 - 2032
- Historical Data and Forecast of New Zealand Mobility Scooter Market Revenues & Volume By Others for the Period 2022 - 2032
- Historical Data and Forecast of New Zealand Mobility Scooter Market Revenues & Volume By Battery Range for the Period 2022 - 2032
- Historical Data and Forecast of New Zealand Mobility Scooter Market Revenues & Volume By Less than 10 Miles for the Period 2022 - 2032
- Historical Data and Forecast of New Zealand Mobility Scooter Market Revenues & Volume By 10-20 Miles for the Period 2022 - 2032
- Historical Data and Forecast of New Zealand Mobility Scooter Market Revenues & Volume By More than 20 Miles for the Period 2022 - 2032
- Historical Data and Forecast of New Zealand Mobility Scooter Market Revenues & Volume By End use for the Period 2022 - 2032
- Historical Data and Forecast of New Zealand Mobility Scooter Market Revenues & Volume By Personal Use for the Period 2022 - 2032
- Historical Data and Forecast of New Zealand Mobility Scooter Market Revenues & Volume By Institutional Use for the Period 2022 - 2032
- New Zealand Mobility Scooter Import Export Trade Statistics
- Market Opportunity Assessment By Type
- Market Opportunity Assessment By Application
- Market Opportunity Assessment By Number of Wheels
- Market Opportunity Assessment By Battery Range
- Market Opportunity Assessment By End use
- New Zealand Mobility Scooter Top Companies Market Share
- New Zealand Mobility Scooter Competitive Benchmarking By Technical and Operational Parameters
- New Zealand Mobility Scooter Company Profiles
- New Zealand Mobility Scooter Key Strategic Recommendations
Frequently Asked Questions About the Market Study (FAQs):
6Wresearch actively monitors the New Zealand Mobility Scooter Market and publishes its comprehensive annual report, highlighting emerging trends, growth drivers, revenue analysis, and forecast outlook. Our insights help businesses to make data-backed strategic decisions with ongoing market dynamics. Our analysts track relevent industries related to the New Zealand Mobility Scooter Market, allowing our clients with actionable intelligence and reliable forecasts tailored to emerging regional needs.
Yes, we provide customisation as per your requirements. To learn more, feel free to contact us on sales@6wresearch.com
1 Executive Summary |
2 Introduction |
2.1 Key Highlights of the Report |
2.2 Report Description |
2.3 Market Scope & Segmentation |
2.4 Research Methodology |
2.5 Assumptions |
3 New Zealand Mobility Scooter Market Overview |
3.1 New Zealand Country Macro Economic Indicators |
3.2 New Zealand Mobility Scooter Market Revenues & Volume, 2022 & 2032F |
3.3 New Zealand Mobility Scooter Market - Industry Life Cycle |
3.4 New Zealand Mobility Scooter Market - Porter's Five Forces |
3.5 New Zealand Mobility Scooter Market Revenues & Volume Share, By Type, 2022 & 2032F |
3.6 New Zealand Mobility Scooter Market Revenues & Volume Share, By Application, 2022 & 2032F |
3.7 New Zealand Mobility Scooter Market Revenues & Volume Share, By Number of Wheels, 2022 & 2032F |
3.8 New Zealand Mobility Scooter Market Revenues & Volume Share, By Battery Range, 2022 & 2032F |
3.9 New Zealand Mobility Scooter Market Revenues & Volume Share, By End use, 2022 & 2032F |
4 New Zealand Mobility Scooter Market Dynamics |
4.1 Impact Analysis |
4.2 Market Drivers |
4.2.1 Growing aging population in New Zealand leading to increased demand for mobility solutions. |
4.2.2 Rising awareness about the benefits of mobility scooters in improving independence and quality of life. |
4.2.3 Government initiatives promoting accessibility and mobility for elderly and disabled individuals. |
4.3 Market Restraints |
4.3.1 High cost associated with purchasing and maintaining mobility scooters. |
4.3.2 Limited availability of specialized mobility scooter retailers and service providers. |
4.3.3 Safety concerns and regulations impacting the usage of mobility scooters in public spaces. |
5 New Zealand Mobility Scooter Market Trends |
6 New Zealand Mobility Scooter Market, By Types |
6.1 New Zealand Mobility Scooter Market, By Type |
6.1.1 Overview and Analysis |
6.1.2 New Zealand Mobility Scooter Market Revenues & Volume, By Type, 2022 - 2032F |
6.1.3 New Zealand Mobility Scooter Market Revenues & Volume, By Small (Less than 110cm), 2022 - 2032F |
6.1.4 New Zealand Mobility Scooter Market Revenues & Volume, By Medium (110-150cm), 2022 - 2032F |
6.1.5 New Zealand Mobility Scooter Market Revenues & Volume, By Large (More than 150cm), 2022 - 2032F |
6.2 New Zealand Mobility Scooter Market, By Application |
6.2.1 Overview and Analysis |
6.2.2 New Zealand Mobility Scooter Market Revenues & Volume, By In-House, 2022 - 2032F |
6.2.3 New Zealand Mobility Scooter Market Revenues & Volume, By Outdoor, 2022 - 2032F |
6.2.4 New Zealand Mobility Scooter Market Revenues & Volume, By Off-Road, 2022 - 2032F |
6.3 New Zealand Mobility Scooter Market, By Number of Wheels |
6.3.1 Overview and Analysis |
6.3.2 New Zealand Mobility Scooter Market Revenues & Volume, By Three Wheels, 2022 - 2032F |
6.3.3 New Zealand Mobility Scooter Market Revenues & Volume, By Four Wheels, 2022 - 2032F |
6.3.4 New Zealand Mobility Scooter Market Revenues & Volume, By Others, 2022 - 2032F |
6.4 New Zealand Mobility Scooter Market, By Battery Range |
6.4.1 Overview and Analysis |
6.4.2 New Zealand Mobility Scooter Market Revenues & Volume, By Less than 10 Miles, 2022 - 2032F |
6.4.3 New Zealand Mobility Scooter Market Revenues & Volume, By 10-20 Miles, 2022 - 2032F |
6.4.4 New Zealand Mobility Scooter Market Revenues & Volume, By More than 20 Miles, 2022 - 2032F |
6.5 New Zealand Mobility Scooter Market, By End use |
6.5.1 Overview and Analysis |
6.5.2 New Zealand Mobility Scooter Market Revenues & Volume, By Personal Use, 2022 - 2032F |
6.5.3 New Zealand Mobility Scooter Market Revenues & Volume, By Institutional Use, 2022 - 2032F |
7 New Zealand Mobility Scooter Market Import-Export Trade Statistics |
7.1 New Zealand Mobility Scooter Market Export to Major Countries |
7.2 New Zealand Mobility Scooter Market Imports from Major Countries |
8 New Zealand Mobility Scooter Market Key Performance Indicators |
8.1 Average age of mobility scooter users in New Zealand. |
8.2 Number of government-funded programs supporting mobility solutions for elderly and disabled individuals. |
8.3 Percentage increase in online searches for mobility scooters in New Zealand. |
8.4 Number of mobility scooter accidents reported annually in New Zealand. |
8.5 Growth in the number of mobility scooter retailers and service providers in the market. |
9 New Zealand Mobility Scooter Market - Opportunity Assessment |
9.1 New Zealand Mobility Scooter Market Opportunity Assessment, By Type, 2022 & 2032F |
9.2 New Zealand Mobility Scooter Market Opportunity Assessment, By Application, 2022 & 2032F |
9.3 New Zealand Mobility Scooter Market Opportunity Assessment, By Number of Wheels, 2022 & 2032F |
9.4 New Zealand Mobility Scooter Market Opportunity Assessment, By Battery Range, 2022 & 2032F |
9.5 New Zealand Mobility Scooter Market Opportunity Assessment, By End use, 2022 & 2032F |
10 New Zealand Mobility Scooter Market - Competitive Landscape |
10.1 New Zealand Mobility Scooter Market Revenue Share, By Companies, 2025 |
10.2 New Zealand Mobility Scooter Market Competitive Benchmarking, By Operating and Technical Parameters |
11 Company Profiles |
12 Recommendations |
13 Disclaimer |
Global Go To Market Strategy - 2030
Export potential enables firms to identify high-growth global markets with greater confidence by combining advanced trade intelligence with a structured quantitative methodology. The framework analyzes emerging demand trends and country-level import patterns while integrating macroeconomic and trade datasets such as GDP and population forecasts, bilateral import–export flows, tariff structures, elasticity differentials between developed and developing economies, geographic distance, and import demand projections. Using weighted trade values from 2020–2024 as the base period to project country-to-country export potential for 2030, these inputs are operationalized through calculated drivers such as gravity model parameters, tariff impact factors, and projected GDP per-capita growth. Through an analysis of hidden potentials, demand hotspots, and market conditions that are most favorable to success, this method enables firms to focus on target countries, maximize returns, and global expansion with data, backed by accuracy.
By factoring in the projected importer demand gap that is currently unmet and could be potential opportunity, it identifies the potential for the Exporter (Country) among 190 countries, against the general trade analysis, which identifies the biggest importer or exporter.
To discover high-growth global markets and optimize your business strategy:
Click Here
Pricing
- Single User License$ 1,995
- Department License$ 2,400
- Site License$ 3,120
- Global License$ 3,795

Leadership Perspectives from Industry Events
Search
Thought Leadership and Analyst Meet


Our Clients
6WResearch In News
- Doha a strategic location for EV manufacturing hub: IPA Qatar
- Demand for luxury TVs surging in the GCC, says Samsung
- Empowering Growth: The Thriving Journey of Bangladesh’s Cable Industry
- Demand for luxury TVs surging in the GCC, says Samsung
- Video call with a traditional healer? Once unthinkable, it’s now common in South Africa
- Intelligent Buildings To Smooth GCC’s Path To Net Zero
Latest Reports
- New Zealand Aseptic Manufacturing Market (2026-2032)
- Netherlands Aseptic Manufacturing Market (2026-2032)
- Nauru Aseptic Manufacturing Market (2026-2032)
- Namibia Aseptic Manufacturing Market (2026-2032)
- Mozambique Aseptic Manufacturing Market (2026-2032)
- Montenegro Aseptic Manufacturing Market (2026-2032)
- Mongolia Aseptic Manufacturing Market (2026-2032)
- Monaco Aseptic Manufacturing Market (2026-2032)
- Micronesia Aseptic Manufacturing Market (2026-2032)
- Mauritius Aseptic Manufacturing Market (2026-2032)
Industry Events and Analyst Meet

HIMTEX 2026

India Refining Summit 2026

India EV Show 2026

EV tech India Expo 2026

Auto Tech Asia 2026
Whitepaper
- Middle East & Africa Commercial Security Market Click here to view more.
- Middle East & Africa Fire Safety Systems & Equipment Market Click here to view more.
- GCC Drone Market Click here to view more.
- Middle East Lighting Fixture Market Click here to view more.
- GCC Physical & Perimeter Security Market Click here to view more.