New Zealand Polyurethane (PU) Microspheres Market (2025-2031) | Revenue, Analysis, Forecast, Value, Industry, Segmentation, Share, Growth, Outlook, Companies, Size & Trends
Market Forecast By Applications (Encapsulation, Paints & coatings, Adhesives films, Cosmetics, Other applications) And Competitive Landscape
| Product Code: ETC5738078 | Publication Date: Nov 2023 | Updated Date: Nov 2025 | Product Type: Market Research Report | |
| Publisher: 6Wresearch | Author: Sumit Sagar | No. of Pages: 60 | No. of Figures: 30 | No. of Tables: 5 |
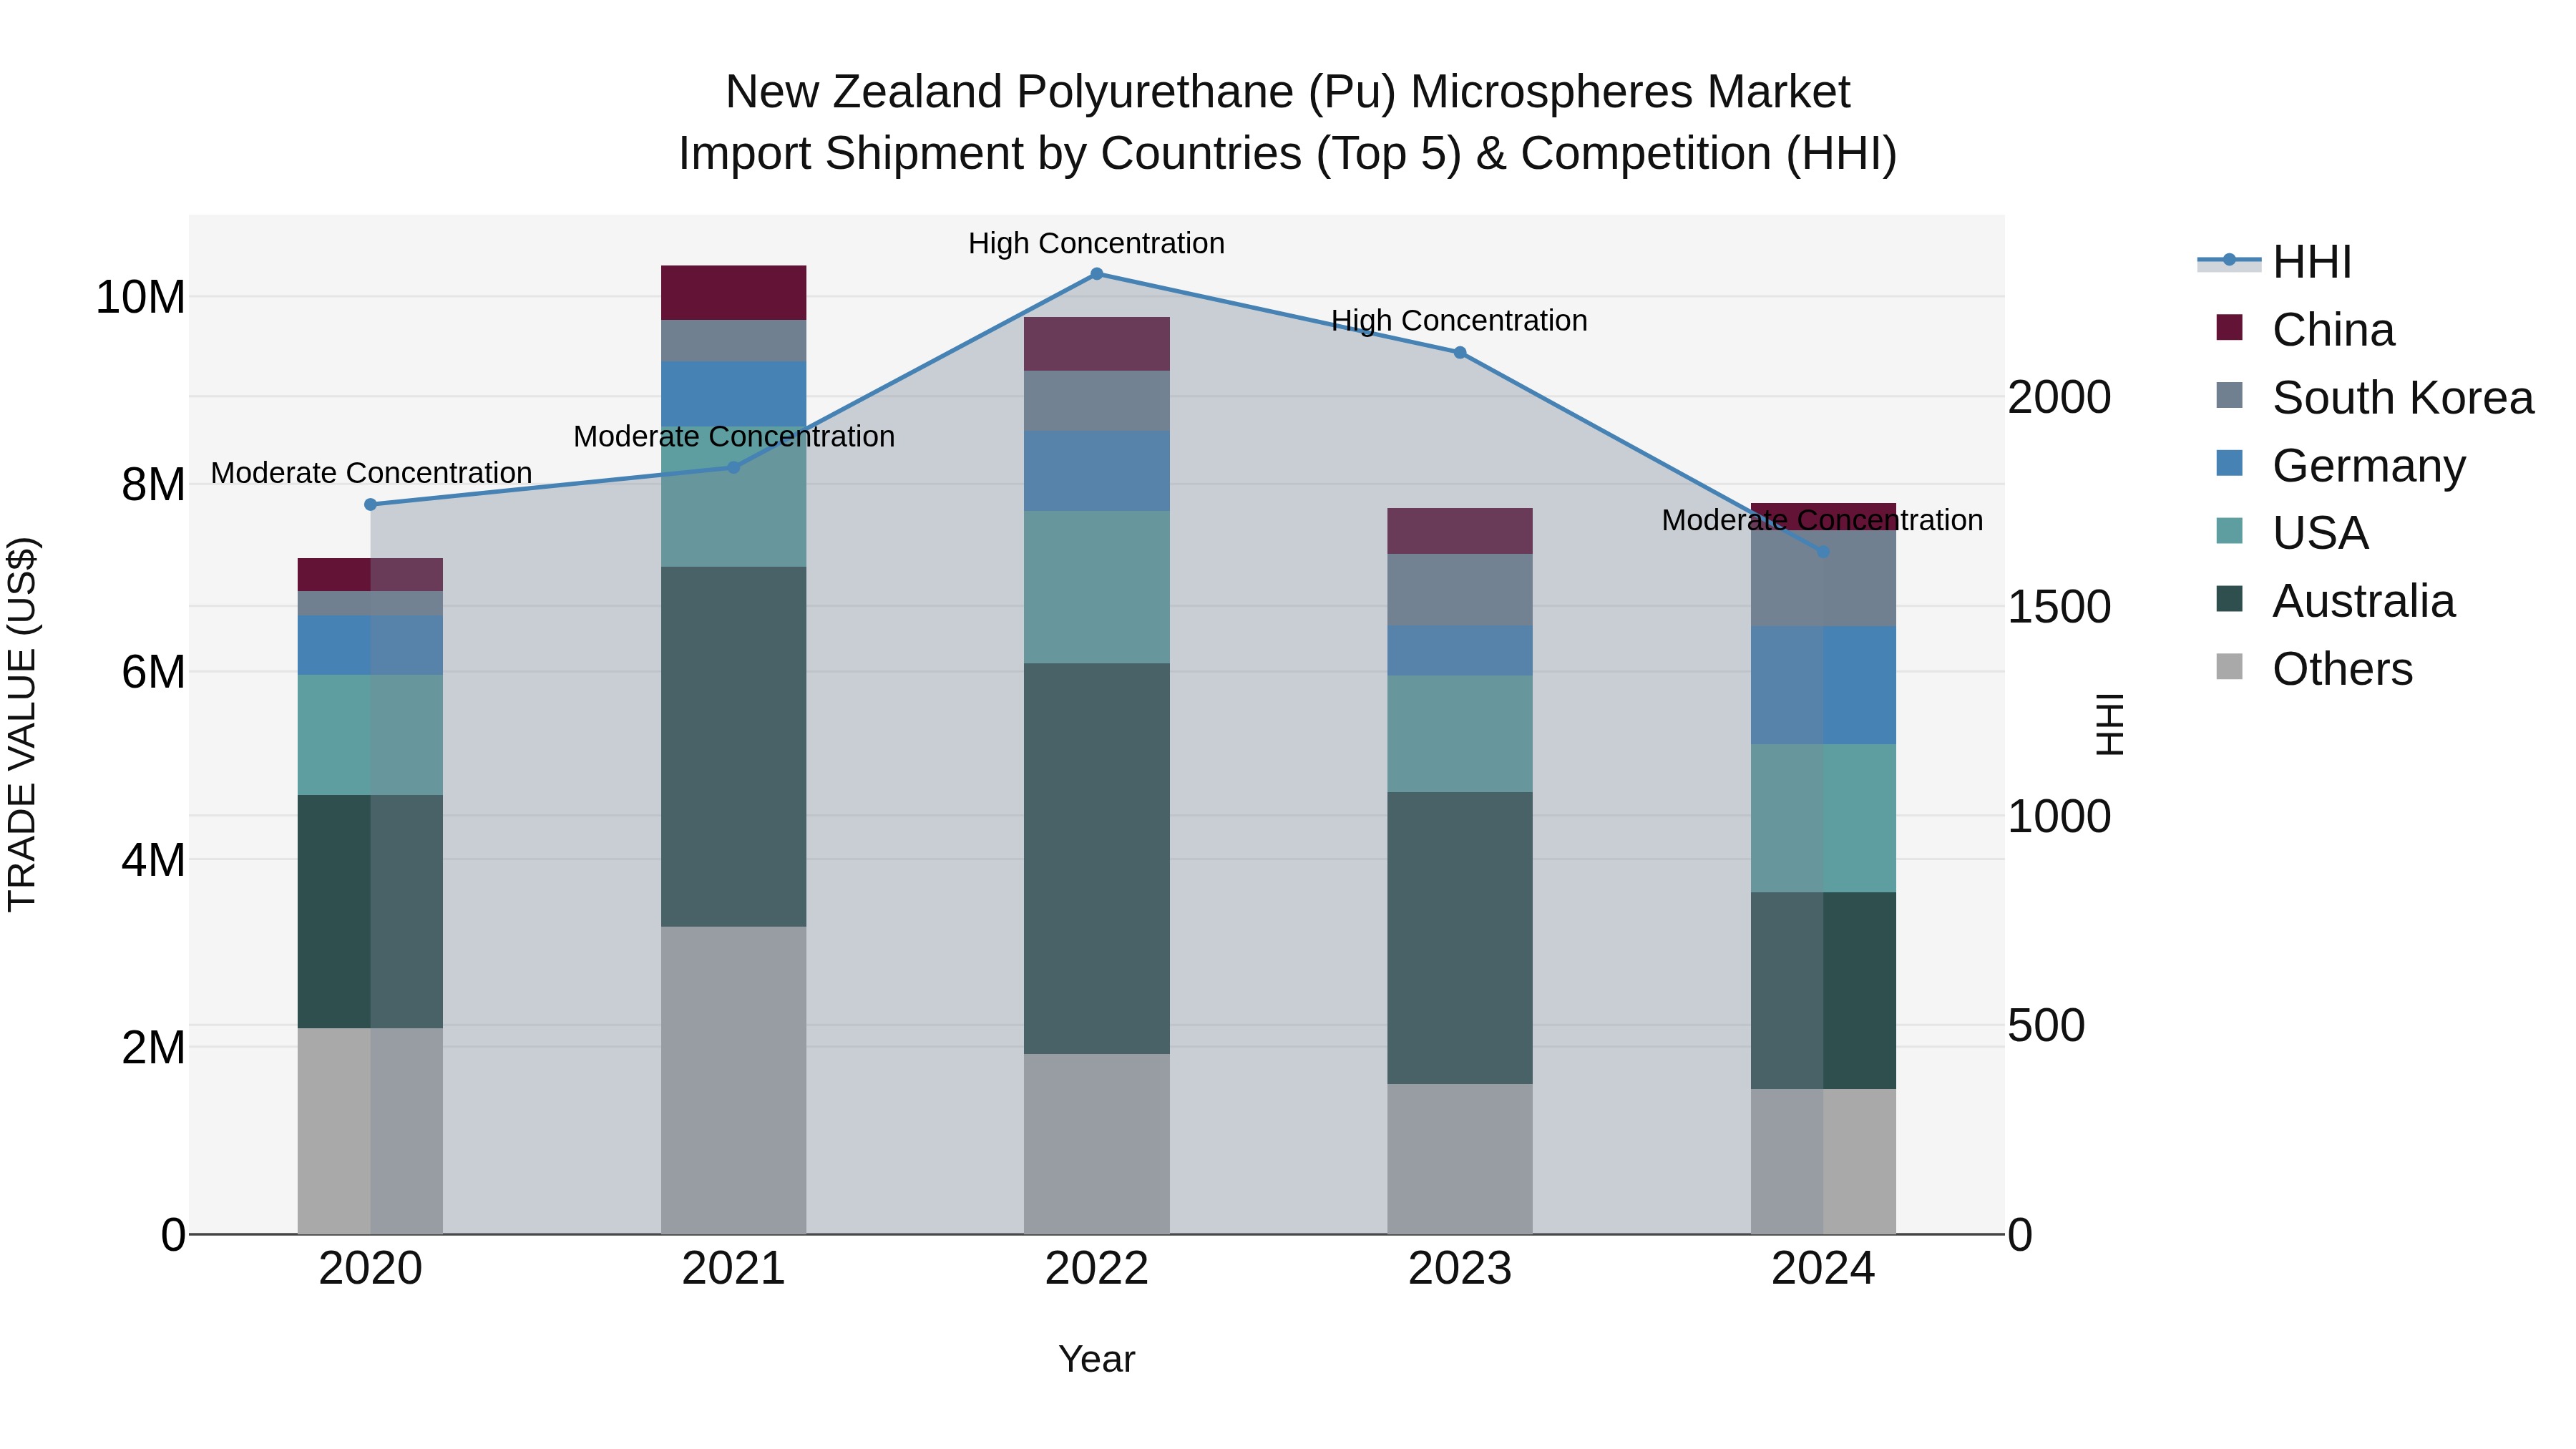
New Zealand Polyurethane (Pu) Microspheres Market Top 5 Importing Countries and Market Competition (HHI) Analysis
In 2024, New Zealand`s polyurethane microspheres import market saw a shift in concentration from high to moderate, reflecting a more balanced distribution among top exporting countries. The top exporters to New Zealand, including Australia, USA, Germany, South Korea, and Netherlands, continue to play a significant role in supplying these essential materials. With a steady CAGR of 1.97% from 2020 to 2024 and a growth rate of 0.74% in 2024, the market shows resilience and steady growth in meeting the demand for polyurethane microspheres in New Zealand.
New Zealand Polyurethane (PU) Microspheres Market Overview
The Polyurethane (PU) Microspheres Market in New Zealand is expanding due to their applications in coatings, adhesives, and sealants. PU microspheres are valued for their lightweight, flexibility, and durability. The market includes products used in various industries, from automotive to construction. Innovations in microsphere technology and increasing demand for advanced materials drive market growth.
Drivers of the market
The New Zealand polyurethane (PU) microspheres market is experiencing significant growth, driven by the increasing demand for lightweight fillers and additives in various end-use industries such as paints and coatings, cosmetics, and healthcare. PU microspheres offer several advantages, including low density, high compressibility, and excellent thermal and chemical resistance, making them ideal for use in diverse applications. The growing emphasis on energy efficiency and sustainability has led to the adoption of PU microspheres in architectural coatings, automotive coatings, and personal care products as alternatives to conventional fillers. Moreover, advancements in microencapsulation technologies and the development of novel PU formulations have expanded the application scope of PU microspheres, further fueling market growth. However, the availability of alternative microsphere materials and stringent regulations regarding VOC emissions may hinder market growth to some extent.
Challenges of the market
In the realm of Polyurethane Composites, New Zealand faces the challenge of establishing a robust supply chain to support the growing demand across sectors like construction, automotive, and aerospace. Balancing cost-effectiveness with quality standards remains pivotal, while environmental concerns drive the need for sustainable composite materials.
Government Policy of the market
Polyurethane microspheres market in New Zealand is witnessing significant growth, driven by its applications in paints, coatings, and cosmetics. Government initiatives promoting innovation and investments in advanced materials are expected to boost market growth.
Key Highlights of the Report:
- New Zealand Polyurethane (PU) Microspheres Market Outlook
- Market Size of New Zealand Polyurethane (PU) Microspheres Market, 2024
- Forecast of New Zealand Polyurethane (PU) Microspheres Market, 2031
- Historical Data and Forecast of New Zealand Polyurethane (PU) Microspheres Revenues & Volume for the Period 2021-2031
- New Zealand Polyurethane (PU) Microspheres Market Trend Evolution
- New Zealand Polyurethane (PU) Microspheres Market Drivers and Challenges
- New Zealand Polyurethane (PU) Microspheres Price Trends
- New Zealand Polyurethane (PU) Microspheres Porter`s Five Forces
- New Zealand Polyurethane (PU) Microspheres Industry Life Cycle
- Historical Data and Forecast of New Zealand Polyurethane (PU) Microspheres Market Revenues & Volume By Applications for the Period 2021-2031
- Historical Data and Forecast of New Zealand Polyurethane (PU) Microspheres Market Revenues & Volume By Encapsulation for the Period 2021-2031
- Historical Data and Forecast of New Zealand Polyurethane (PU) Microspheres Market Revenues & Volume By Paints & coatings for the Period 2021-2031
- Historical Data and Forecast of New Zealand Polyurethane (PU) Microspheres Market Revenues & Volume By Adhesives films for the Period 2021-2031
- Historical Data and Forecast of New Zealand Polyurethane (PU) Microspheres Market Revenues & Volume By Cosmetics for the Period 2021-2031
- Historical Data and Forecast of New Zealand Polyurethane (PU) Microspheres Market Revenues & Volume By Other applications for the Period 2021-2031
- New Zealand Polyurethane (PU) Microspheres Import Export Trade Statistics
- Market Opportunity Assessment By Applications
- New Zealand Polyurethane (PU) Microspheres Top Companies Market Share
- New Zealand Polyurethane (PU) Microspheres Competitive Benchmarking By Technical and Operational Parameters
- New Zealand Polyurethane (PU) Microspheres Company Profiles
- New Zealand Polyurethane (PU) Microspheres Key Strategic Recommendations
Frequently Asked Questions About the Market Study (FAQs):
6Wresearch actively monitors the New Zealand Polyurethane (PU) Microspheres Market and publishes its comprehensive annual report, highlighting emerging trends, growth drivers, revenue analysis, and forecast outlook. Our insights help businesses to make data-backed strategic decisions with ongoing market dynamics. Our analysts track relevent industries related to the New Zealand Polyurethane (PU) Microspheres Market, allowing our clients with actionable intelligence and reliable forecasts tailored to emerging regional needs.
Yes, we provide customisation as per your requirements. To learn more, feel free to contact us on sales@6wresearch.com
1 Executive Summary |
2 Introduction |
2.1 Key Highlights of the Report |
2.2 Report Description |
2.3 Market Scope & Segmentation |
2.4 Research Methodology |
2.5 Assumptions |
3 New Zealand Polyurethane (PU) Microspheres Market Overview |
3.1 New Zealand Country Macro Economic Indicators |
3.2 New Zealand Polyurethane (PU) Microspheres Market Revenues & Volume, 2021 & 2031F |
3.3 New Zealand Polyurethane (PU) Microspheres Market - Industry Life Cycle |
3.4 New Zealand Polyurethane (PU) Microspheres Market - Porter's Five Forces |
3.5 New Zealand Polyurethane (PU) Microspheres Market Revenues & Volume Share, By Applications, 2021 & 2031F |
4 New Zealand Polyurethane (PU) Microspheres Market Dynamics |
4.1 Impact Analysis |
4.2 Market Drivers |
4.2.1 Increasing demand for lightweight materials in various industries such as automotive, construction, and aerospace |
4.2.2 Growing awareness about the benefits of polyurethane microspheres in reducing weight and enhancing performance of end products |
4.2.3 Rising investments in research and development for new applications of polyurethane microspheres |
4.3 Market Restraints |
4.3.1 Fluctuating raw material prices impacting production costs |
4.3.2 Stringent regulations related to environmental concerns and safety standards |
4.3.3 Competition from alternative materials and technologies in the market |
5 New Zealand Polyurethane (PU) Microspheres Market Trends |
6 New Zealand Polyurethane (PU) Microspheres Market Segmentations |
6.1 New Zealand Polyurethane (PU) Microspheres Market, By Applications |
6.1.1 Overview and Analysis |
6.1.2 New Zealand Polyurethane (PU) Microspheres Market Revenues & Volume, By Encapsulation, 2021-2031F |
6.1.3 New Zealand Polyurethane (PU) Microspheres Market Revenues & Volume, By Paints & coatings, 2021-2031F |
6.1.4 New Zealand Polyurethane (PU) Microspheres Market Revenues & Volume, By Adhesives films, 2021-2031F |
6.1.5 New Zealand Polyurethane (PU) Microspheres Market Revenues & Volume, By Cosmetics, 2021-2031F |
6.1.6 New Zealand Polyurethane (PU) Microspheres Market Revenues & Volume, By Other applications, 2021-2031F |
7 New Zealand Polyurethane (PU) Microspheres Market Import-Export Trade Statistics |
7.1 New Zealand Polyurethane (PU) Microspheres Market Export to Major Countries |
7.2 New Zealand Polyurethane (PU) Microspheres Market Imports from Major Countries |
8 New Zealand Polyurethane (PU) Microspheres Market Key Performance Indicators |
8.1 Percentage of market penetration in key industries (automotive, construction, aerospace) |
8.2 Number of patents filed for new applications of polyurethane microspheres |
8.3 Research and development expenditure as a percentage of total revenue |
8.4 Customer satisfaction scores for product quality and performance |
8.5 Number of partnerships and collaborations for product development and market expansion. |
9 New Zealand Polyurethane (PU) Microspheres Market - Opportunity Assessment |
9.1 New Zealand Polyurethane (PU) Microspheres Market Opportunity Assessment, By Applications, 2021 & 2031F |
10 New Zealand Polyurethane (PU) Microspheres Market - Competitive Landscape |
10.1 New Zealand Polyurethane (PU) Microspheres Market Revenue Share, By Companies, 2024 |
10.2 New Zealand Polyurethane (PU) Microspheres Market Competitive Benchmarking, By Operating and Technical Parameters |
11 Company Profiles |
12 Recommendations | 13 Disclaimer |
Export potential assessment - trade Analytics for 2030
Export potential enables firms to identify high-growth global markets with greater confidence by combining advanced trade intelligence with a structured quantitative methodology. The framework analyzes emerging demand trends and country-level import patterns while integrating macroeconomic and trade datasets such as GDP and population forecasts, bilateral import–export flows, tariff structures, elasticity differentials between developed and developing economies, geographic distance, and import demand projections. Using weighted trade values from 2020–2024 as the base period to project country-to-country export potential for 2030, these inputs are operationalized through calculated drivers such as gravity model parameters, tariff impact factors, and projected GDP per-capita growth. Through an analysis of hidden potentials, demand hotspots, and market conditions that are most favorable to success, this method enables firms to focus on target countries, maximize returns, and global expansion with data, backed by accuracy.
By factoring in the projected importer demand gap that is currently unmet and could be potential opportunity, it identifies the potential for the Exporter (Country) among 190 countries, against the general trade analysis, which identifies the biggest importer or exporter.
To discover high-growth global markets and optimize your business strategy:
Click Here
Pricing
- Single User License$ 1,995
- Department License$ 2,400
- Site License$ 3,120
- Global License$ 3,795

Search
Thought Leadership and Analyst Meet


Our Clients
Latest Reports
- Taiwan Food Delivery Platform Market (2026-2032) | Companies, Outlook, Analysis, Trends, Value, Revenue, Segmentation, Share, Forecast, Competitive Landscape, Growth, Size & Forecast
- United Kingdom (UK) Long-term Care Insurance Market (2026-2032) | Growth, Share, Consumer Insights, Drivers, Opportunities, Competition, Pricing Analysis, Segments, Restraints, Companies, Competitive, Value, Outlook, Size, Demand, Analysis, Challenges, Strategic Insights, Investment Trends, Revenue, Trends, Supply, Forecast
- United Kingdom (UK) Long Term Care Market (2026-2032) | Companies, Outlook, Analysis, Trends, Value, Revenue, Segmentation, Share, Forecast, Competitive Landscape, Growth, Size & Forecast
- Iraq Insulation and Waterproofing Market (2026-2032) | Outlook, Drivers, Growth, Size, Share, Industry, Revenue, Trends, Demand, Competitive, Strategic Insights, Opportunities, Segments, Companies, Challenges, Strategy, Consumer Insights, Analysis, Investment Trends, Value, Segmentation, Forecast, Restraints
- India Switchgear Market Outlook (2026-2032) | Size, Share, Trends, Growth, Revenue, Forecast, Analysis, Value, Outlook
- Pakistan Contraceptive Implants Market (2025-2031) | Demand, Growth, Size, Share, Industry, Pricing Analysis, Competitive, Strategic Insights, Strategy, Consumer Insights, Analysis, Investment Trends, Opportunities, Revenue, Segments, Value, Segmentation, Supply, Forecast, Restraints, Outlook, Competition, Drivers, Trends, Companies, Challenges
- Sri Lanka Packaging Market (2026-2032) | Outlook, Competition, Drivers, Trends, Demand, Pricing Analysis, Competitive, Strategic Insights, Companies, Challenges, Strategy, Consumer Insights, Analysis, Investment Trends, Opportunities, Growth, Size, Share, Industry, Revenue, Segments, Value, Segmentation, Supply, Forecast, Restraints
- India Kids Watches Market (2026-2032) | Strategy, Consumer Insights, Analysis, Investment Trends, Opportunities, Growth, Size, Share, Industry, Revenue, Segments, Value, Segmentation, Supply, Forecast, Restraints, Outlook, Competition, Drivers, Trends, Demand, Pricing Analysis, Competitive, Strategic Insights, Companies, Challenges
- Saudi Arabia Core Assurance Service Market (2025-2031) | Strategy, Consumer Insights, Analysis, Investment Trends, Opportunities, Growth, Size, Share, Industry, Revenue, Segments, Value, Segmentation, Supply, Forecast, Restraints, Outlook, Competition, Drivers, Trends, Demand, Pricing Analysis, Competitive, Strategic Insights, Companies, Challenges
- Romania Uninterruptible Power Supply (UPS) Market (2026-2032) | Industry, Analysis, Revenue, Size, Forecast, Outlook, Value, Trends, Share, Growth & Companies
Industry Events and Analyst Meet

India EV Show 2026

EV tech India Expo 2026

Auto Tech Asia 2026

Battery Tech India 2026

Smart Production Solutions Guangzhou 2026
Whitepaper
- Middle East & Africa Commercial Security Market Click here to view more.
- Middle East & Africa Fire Safety Systems & Equipment Market Click here to view more.
- GCC Drone Market Click here to view more.
- Middle East Lighting Fixture Market Click here to view more.
- GCC Physical & Perimeter Security Market Click here to view more.
6WResearch In News
- Doha a strategic location for EV manufacturing hub: IPA Qatar
- Demand for luxury TVs surging in the GCC, says Samsung
- Empowering Growth: The Thriving Journey of Bangladesh’s Cable Industry
- Demand for luxury TVs surging in the GCC, says Samsung
- Video call with a traditional healer? Once unthinkable, it’s now common in South Africa
- Intelligent Buildings To Smooth GCC’s Path To Net Zero